How is the story being told? The importance of appropriately synthesizing data and information
|
|
|
- Gabriella Dean
- 5 years ago
- Views:
Transcription
1 How is the story being told? The importance of appropriately synthesizing data and information 2018 Toronto RAP Science Seminar Mary Thorburn Ministry of the Environment, Conservation and Parks November 21, 2018
2 Advantages of Synthesizing Data and Information Integrating information from different locations, spatial and temporal scales and fields of study enables a better understanding of what is going on in the system (Great Lakes basin scale, lake scale, nearshore, and watershed scale). Combining different data and information sets improves the over all analysis and interpretation (often provides a more complete picture). Leveraging data and information from a wider group of potential partners enhances knowledge transfer, decisionmaking and policy development. Enables better coordination of monitoring and surveillance efforts to maximize value of the data.


3 Recent Examples of Synthesized Data & Information

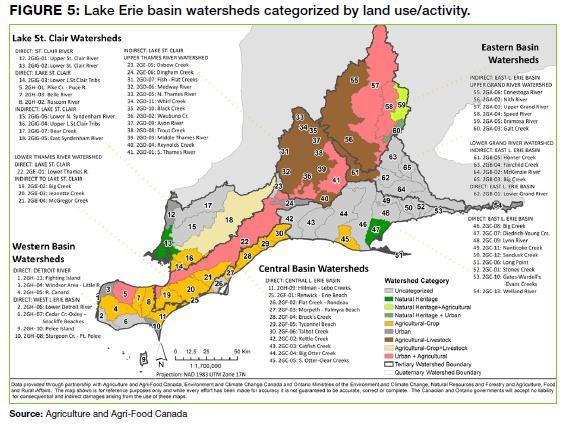
4 Canada-Ontario Lake Erie Action Plan Staff from 5 federal and provincial agencies were asked to compile and assess existing data and information to characterize geographic areas within the Canadian side of the Lake Erie basin

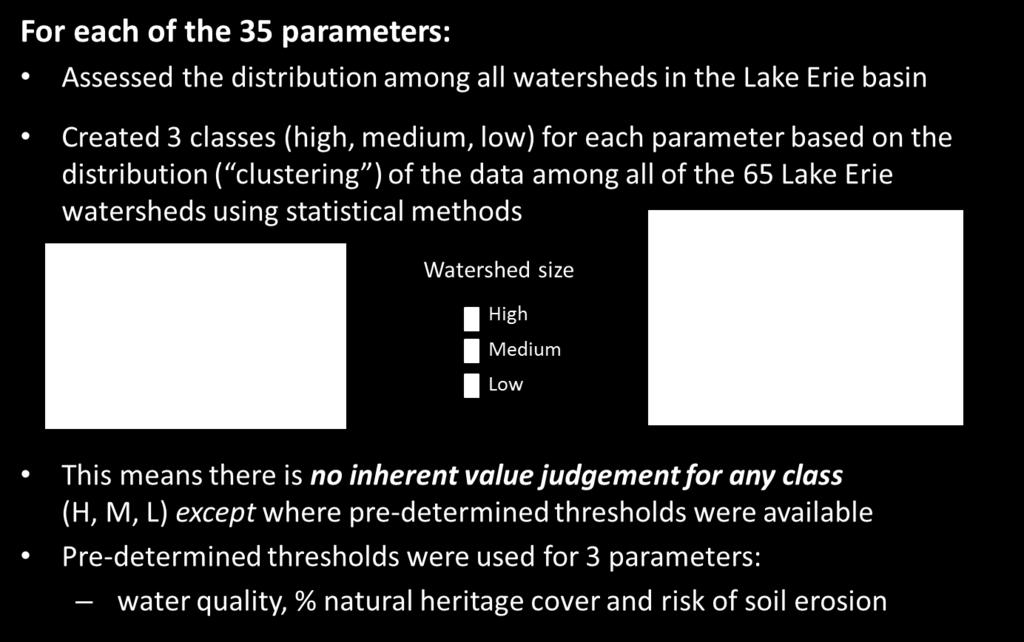
5 Data and Information Selection Criteria

6
7
8

9
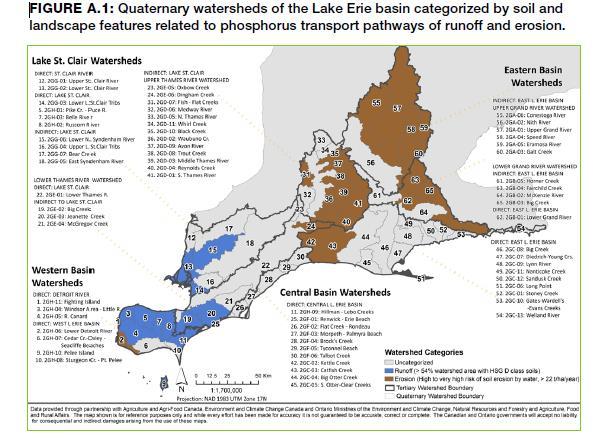
10 Characterization process highlighted data gaps Water Quality Data measured P loading data good for base flow conditions but not for spring/storm runoff events, 35 % of watersheds have no data Soil Phosphorus Accessible soil phosphorus data at the basin wide scale (currently most of the data is privately held and often not geo-referenced) Land Management Data consistent quaternary (sub)watershed-level data on urban and agricultural land management activities

11 Great Lakes Nearshore Framework Improved ecological health of nearshore areas through assessment, identification of priority areas and integrated management, including prevention, restoration and protection

12

13 Draft Nearshore Assessment Phase 1: Delineation of the Nearshore
 Sensitive (variables and scoring approach can discriminate) Operational (data available for baseline and")
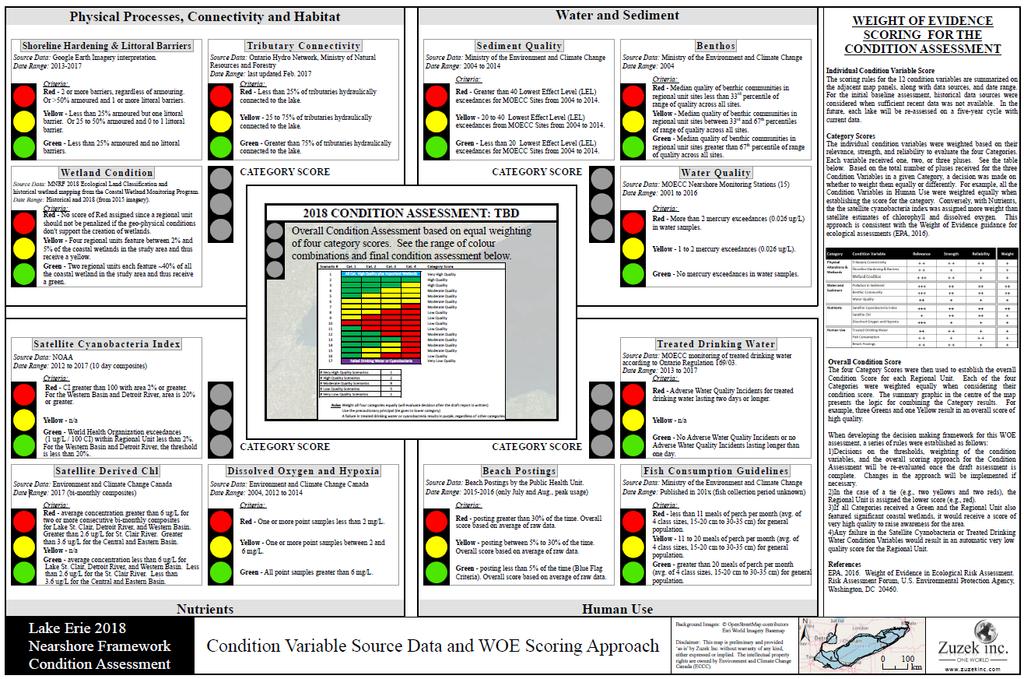
14 Draft Nearshore Assessment Phase 2: Condition Assessment Followed the US EPA weight evidence approach. Guided by the following principals: Transparent (for data, decision making and reporting) Sensitive (variables and scoring approach can discriminate) Operational (data available for baseline and repeat surveys) Adaptive (variable, data and methods will improve overtime) Aligns with the Great Lakes Water Quality Agreement Objectives
15

16 Draft Nearshore Assessment Phase 3: Biological Confirmation

17 The 2018 Draft Condition Assessment for Lake Erie and the Huron Erie Corridor

18 2017 State of the Great Lakes Report on the 9 general objectives of the 2012 Great Lakes Water Quality Agreement Nearly 200 authors and contributors prepared 44 subindicator reports used in the assessment State of the Great Lakes are reported on every three years


19
20 Discussion A good story needs to be supported by comprehensive and reliable data and information. Synthesizing data and information from different sources often improves the collective understanding of a system it can also shine a light on data and information gaps. Assumptions made and threshold used, to compare, contrast, and characterize the different areas will strongly influence the final assessment. Synthesizing data and information is time consuming as it requires multiple parties to come together with their data but it will also help develop and reinforce strong, constructive inter-agency working relationships.
21 Acknowledgements COA Nutrients Annex Science Task Team GLWQA Lakewide Management Annex Nearshore Assessment Core Team GLWQA Science Annex Indicators Task Team