Rapid Valley Sanitary District Water Service Annual Report
|
|
|
- Barnaby Lawson
- 5 years ago
- Views:
Transcription


1 Rapid Valley Sanitary District Water Service Annual Report December
2 HOW WAS 2017? WHAT DOES THE FUTURE HOLD? The RVSD is an established regional system founded in The system is mature and is in the process of replacing aging portions of the original water distribution and sewer collection system. The District produces 100% of water served to customers. RVSD saw significant growth of 2.7% in (MG) Production No. Water Year Total Customers , , , , ,822 New customers will help provide long-term system stability for the District. Transmission line and trunk sewer extensions to new developments often improve the existing system. RVSD typically produces over 300 million gallons (MG) of water per year for use by approximately 10,000 people within the District.

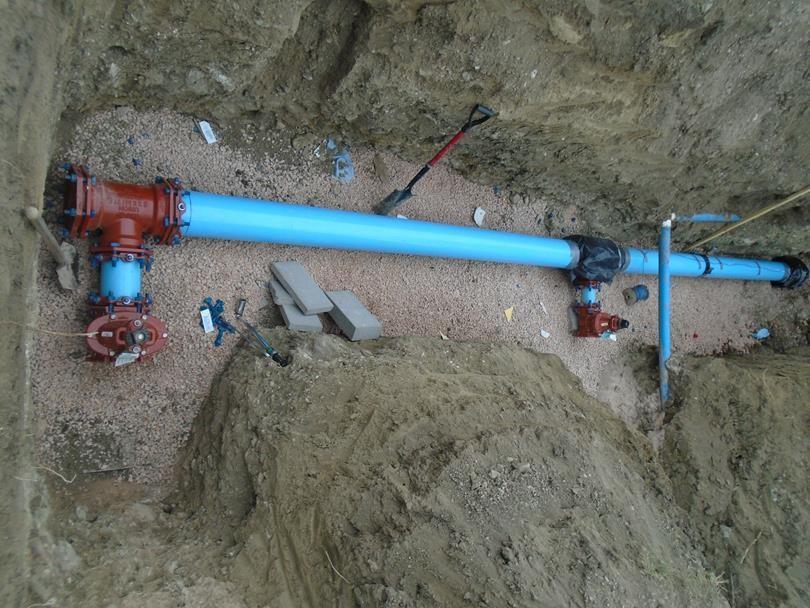
3 2018 CAPITAL IMPROVEMENT PROJECTS Earth Dr./Legacy Ln. 8 Water Main Looping & Extension, 900 LF. Benefits: new water service, water quality improvement, fire flow improvement. Longview Dr. 12 Water Main Extension, Springfield Rd. east 1,200 LF. Benefits: add new customers that are currently within District. Water Treatment Plant Upgrades: 36 Ceramic Filter Module Replacement on Skid B. Benefits: improved water quality, reduced chemical consumption, reduced backwash waste, reduced power consumption, extended life expectancy with 20 year warranty and increased water production.
4 RVSD SYSTEM-WIDE GOALS Maintain high water quality level and capacity by exceeding all EPA and DENR standards. Reduce water loss and expand leak detection program with new technology. Replacement of aging and undersized water and sewer lines with multiple projects per year. Optimize and reduce chemical and power consumption. Provide adequate sewer capacity with new extensions and upgrades. Looping and extensions to existing homes to improve fire flows, water quality and sewer service. Staff training, operator certifications and customer services. Maintain equipment and assets to provide lowest life cycle cost with daily monitoring of all assets. Orderly growth for new development and in-fill.


5 REGIONAL WATER SYSTEM RATE COMPARISON RVSD has the lowest average water bill of Regional Systems in the study. SOUTHDAKOTA Rapid ValleySD-Water,SD^ Brookings-DeuelRWS, SD~ WebWDA,Inc.,SD^ $36.65 $52.20 $54.50 Water FixedCharge Water VolumeCharge Based on 6,000Gallons West River/Lyman JonesRWS, Inc.,SD*^ KingbrookRWS,SD# Clay RWS, Inc.,SD# Mid-DakotaRWS,Inc.,SD^ B-YWD,SD^ BDMRWS,Inc.,SD# FallRiverWUD,SD# SouthernBlackHillsWS,SD# PerkinsCountyRWS, SD*^ $55.00 $56.10 $64.80 $65.50 $69.50 $70.00 $72.50 $ $ ^ SurfaceWater # GroundWater ~ Both Surface and GroundWater * All or Partial Purchase $0.00 $36.00 $72.00 $ $ $ TYPICALMONTHLYWATERBILL($) The Financial Link Copyright 2017 AE2S- All Rights Reserved

6 HOW RVSD RATES COMPARES TO OTHER UTILITIES? Annual Average Electricity Price for South Dakota Year Cents/kWhr %/Yr % % % % % % Average Annual Increase 4.3% Source: Electric Power Annual. Energy Information Administration, Washington, DC Note: Does not consider base rate adjustments


 PPI: average")


7 RATE INCREASE BENCHMARKS 2018 RVSD RATES: Increase Residential Rates 1.6% Increase Commercial Rates 7.2% 1.6% RVSD Residential Increase 1.7% CPI-U 1.9% PPI *Values in Percentages for Annual Average 4.3% SD Electrical Average 6.4% Regional Water/Sewer 6 state Ave 7.2% RVSD Commercial 8.0% BHEC Electrical Increase CPI-U: changes in the prices paid by urban consumers for a representative basket of goods and services (related to other cost increases utility users see ) PPI: average change over time in the selling prices received by domestic producers for their output (related to costs for Utility Providers ) Regional Average: 4-year average of rate increases from respondents to the AE2S Utility Rate Survey. Utility Provider Respondents in SD, ND, MN, MT, UT, NE 2014 to 2017)
8 2018 RVSD WATER AND SEWER RATES RESIDENTIAL and COMMERCIAL RVSD WATER AND SEWER RATES Residential Increase Water Monthly Base Rate $ $ % Water/1000 Gallons $ 3.96 $ % Sewer Monthly Base Rate $ $ % Sewer/1000 Gallons $ 4.50 $ % RVSD WATER AND SEWER RATES Commercial Increase Water Monthly Base Rate $ $ % Water/1000 Gallons $ 3.96 $ % Sewer Monthly Base Rate $ $ % Sewer/1000 Gallons $ 4.50 $ % Base rate on commercial shown is for ¾ meter

9 SUMMARY OF IMPACTS TO USER RATES Rate analysis, budgeting and other considerations includes obligations such as debt coverage for Rural Development and State Revolving Fund loans. The system capacity and cost of service is variable for residential and commercial customers. The rates are reviewed to reflect the costs to provide services for multiple customer types. Planning now for replacement of older portions of the established system will allow for a stable future and reliable service. The District land area is approximately 50% developed and the Board of Trustees is planning for the future. New growth will enhance the existing system.


10 WATER RATE DISCUSSION POINTS A Cost of Service Analysis is used to evaluate rate structures. Operational costs and capital improvements impact user costs. Affordability and level of service are reviewed and evaluated when making rate adjustments. Water and sewer service remains affordable and compares well with other industries, such as: electrical, gas, cellular phone service, cable television and others. $6.33/gal