CORFU project FLOOD HAZARD ASSESSMENT CONSIDERING CLIMATE CHANGE IMPACTS: APPLICATION TO BARCELONA CASE STUDY USING A 1D/2D DETAILED COUPLED MODEL
|
|
|
- Shona Perry
- 5 years ago
- Views:
Transcription

1 Exeter (UK), September 2013 CORFU project FLOOD HAZARD ASSESSMENT CONSIDERING CLIMATE CHANGE IMPACTS: APPLICATION TO BARCELONA CASE STUDY USING A 1D/2D DETAILED COUPLED MODEL Beniamino Russo PhD, Civil Engineer 1


2 Introduction about Barcelona Case Study CORFU (Collaborative Research on Flood Resilience in Urban areas) aims to improve the practice of urban flood risk management. Through the project, European and Asian citieswill learn from each other through the development, investigation and dissemination of strategies that aim to improve flood resilience. 2

.")
3 Introduction about Barcelona Case Study General information: Barcelona is located din Mdit Mediterranean area (NE Spain) 1,621,000 inhabitants Area of Km 2 Density of 15,980 inhab./ Km 2 (19,200 inhab./ Km 2 not considering Collserola mountain) High slopes in the mountain and nearly flat on the coast High density of population and land imperviousness Climate: Mediterranean, with cool winters and hot summers Heavy rainfall with high intensities (flash flood events). Average annual precipitation 600 mm Maximum intensity in 5 min is 205 mm/h for a 10 yr return period 50% of annual precipitation can occur in only 2 or 3 events 3


4 Introduction about Barcelona Case Study Collserola mountain Besós River Llobregat River High gradients Runoff preferred direction Low Well channeled gradients and critical rivers points FLOODS Mediterranean sea 4


5 Introduction about Barcelona Case Study Raval District i t Spot susceptible to flooding as demonstrated by historical data inh./km 2 High social and economical vulnerability Traditional 1D sewer models do not detect flooding problems 5


6 Model setup 1D/2D coupled model through Infoworks ICM software 5 catchments (aprox. 44 Km 2 ) involved with 241 Km of pipes with 3826 manholes 38 sluices (fixed and variable) 27 weirs and 3 flap valves 6 storage tanks with a storage volume of more than 170,000 m 3 6

 for the building area Definition of 338 2D infiltration zones in the 2D")

7 Model setup Creation of 1D/2D detailed coupled model with secondary network and microcatchments inside the Raval District for the hydraulic characterization of surface drainage structures Definition of the Rainfall Runoff transformation model (losses and routing models) for the building area Definition of 338 2D infiltration zones in the 2D mesh (more than cells). Hydrological characterization of pervious and the impervious areas using the hydrological model of the cells (new feature of the last version of ICM). 7


 Gully2D")


8 Model setup 1D/2D approach Rainfalldirectlyfalls falls on cellscharacterized characterized bya hydrological model 1D and 2D models are coupled through Node Type 2D (manholes) or Node Type Gully2D (inlets) Gully2D nodes were hydraulically characterized using experimental expressions achieved for the most common inlets of Spain, in order to take into account flow entering into the network and surcharged overflows. 8


9 Model setup Topographic information was provided by Catalan Institute of Cartography (ICC). DTM covers almost the whole administrative land of the city (92 Km2) with a resolution of 1x1 m2. According to the information provided by ICC, DTM used for this model is characterized by a precision of 15 cm in terms of ground level. 9
10 Calibration of the 1D/2D coupled model Calibration process Selection of 3 calibration lb events and 1 validation ld event. Due to the recent significant changes of the Barcelona sewer system, rainfall events were selected in the year This year was characterized by several heavy rainfall events Date event Cumulative rainfall Maximum rainfall intensity in 20 minutes Maximum rainfall intensity in 5 minutes Function of the event (mm) (mm/h) (mm/h) 15/03/ Calibration 07/06/ Calibration 19/07/ Calibration 30/07/ Verification Processing of rainfall data from 11 rain gauge, flow depth time series from 27 limnimeters and time series of 12 variable sluices Collection of field data (reports of policemen, firemen, municipality authorities, etc.) concerning selected events Selection and adjustment of the calibration model parameters Calibration related to surface flooded areas, pressured pipes and manholes with overflows Results verification 10
11 Calibration of the 1D/2D coupled model Selection of calibration model parameters Runoff model parameters for building areas globally affecting the calibration of all catchments Surface classification type Roughness factor Hydrological losses model Surface type Initial loss value Initial infiltration rate f 0 Residual infiltration rate f Decay constant k Recovery constant k' s m 1/3 m mm/h mm/h 1/h 1/h Road Fixed Impervious Roof Fixed Impervious Pervious Horton Pervious Overland flow calibration parameters for the main sewer model Maximum triangle area: 25 m 2 Minimum virtual element area: 10 m 2 (in order to adapt the mesh to the urban topography, model reduce this area automatically to very small cells (less than 1 m 2 ) Manning s roughness: s/m 1/3 for impervious i areas and s/m 1/3 for green areas Minimum angle: 25 degree Boundary points: Critical conditions Mesh summary: 403,822 triangles 11
12 Calibration of the 1D/2D coupled model Locations of the sewers and surface points used for the calibration and the validation of the model. 12
13 Calibration of the 1D/2D coupled model Sewer system calibration (Flow depths timeseries in pipes, manholesand and storage tanks) Situation for a monitored manhole (P AV65) in Parallel Street Measured Simulated 13
14 Calibration of the 1D/2D coupled model Sewer system calibration (Flow depths timeseries in pipes, manholesand and storage tanks) Situation for a monitored pipes (P IV35.1) in Diagonal Avenue (close to Balmes Street) Measured Simulated 14
15 Calibration of the 1D/2D coupled model Sewer system calibration (Flow depths timeseries in pipes, manholesand and storage tanks) Situation for several monitored storage tanks Bori i Fontestá Escola Industrial Joan Miró Measured Simulated 15
16 Calibration of the 1D/2D coupled model Sewer system validation (Flow depths time series in pipes, manholes and storage tanks) Situation for several monitored sewer system infrastructures Manhole P AV65 Parallel Street Manhole BR CL205 Parallel Street Pipe P IV35.1 Balmes Street Diagonal Avenue Urgell storage tank 16


17 Calibration of the 1D/2D coupled model Surface flow validation Sant Pau Street: Comparison between flow depths provided by model simulations and youtube video recorded during the event of 30/07/ m 17


18 Calibration of the 1D/2D coupled model Surface flow validation Sant Pau Street: Comparison between flow depths provided by model simulations and youtube video recorded during the event of 30/07/


19 Calibration of the 1D/2D coupled model Surface flow validation Diagonal Avenue with Casanova Street: Analysis of sewer profile focusing on the surcharged manholes. Comparison with a photo taken during the event of 30/07/
20 Computational time analysis In this case study a computational analysis was carried out considering the following hardware configurations for a specific simulation of 3 hours, with storm duration of 1 hour: 1. Workstation with 64 bit operating system (Windows 7) and 2Gb of RAM memory. 2. Virtual server in a blade system with 64 bit operating system (Windows 7), 2Gb of RAM memory and 4 CPU Intelxeon in order to exploit the ability of ICM to support full multi core processing. 3. Workstation with 64 bit operating system (Windows 7), 2Gb of RAM memory, 4 CPU Intelxeon for multi core processing and a specific GPU card that play an important role during the treatment of the 2D calculations. The results of this analysis showed that run time vary from 6 7 days for Configuration 1 to 5 6 hours for Configuration 2 to 3 4 minutes for the Configuration 3. It is clear that, since simulations can be carried out in few minutes, real time strategies and early,, g y warning systems could be activated on the basis of the results of this coupled model continuously running. 20


21 Targets of flood hazard maps For the Barcelona case study, flood hazard was assessed for current and future scenarios and the analysis was focused on the following targets: Flood hazard concerning pedestrian circulation Flood hazard concerning vehicular circulation Flood hazard concerning goods and properties (not explained in this presentation) 21
22 Definition of future scenarios A combination of different future scenarios of climate, adaptive capacity and socioeconomic aspects was developedfor thehorizon2050 horizon One of the considered scenarios was a business as usual (BAU) scenario, in which no adaptation strategies were implemented and it was associated to medium growth. In addition, 3 levels of adaptive capacity (Adaptation 1, 2 and 3 scenarios respectively related to non structural, structural and SUDS measures) that could be reached were considered. In order to beableto compare the efficiencyof thedifferentadaptationmeasures measures, theywere relatedto to the same climate scenario (pessimistic scenario) and the medium socioeconomic scenario. Scenarios considered in this presentation 22
 Rainfall series for: 5 GCM for A1B, A2, B1, B2 Daily results at 6 points in")
 Daily results corrected New IDF curves and project storms Extreme s")
23 Definition of future scenarios Generation of future climate change scenario (Collaboration with FIC and UB in the framework of an ALLIANCE project) Rainfall series for: 5 GCM for A1B, A2, B1, B2 Daily results at 6 points in Barcelona: Control period Future period Statistical Downscalling (analogue method FIC) Correction of systematic errors (biases) Daily results corrected New IDF curves and project storms Extreme s analysis (UB) 23
24 Definition of future scenarios Climate change coefficients Fractal property of rainfall for extreme events (Temporal downscaling) Final results: Climate change coefficients (commonly used in several countries like lk Belgium, Denmark, United Kingdom) For the Barcelona Case Study pessimistic scenarios will characterized using the most critical emission scenario (A1B) and a sea rise of m Horizon Return period T A1B A2 B1 B2 Average c f Pessimistic scenario I( T, d) = I( T, d Future ) Pr esent For the horizon 2050 T= 10 years, c f ranges from 4% to +12% T = 1 T = 10 T =

25 Hazard criteria for pedestrians Flood hazard assessment for pedestrian circulation was carried out for the Raval district according to specific criteria achieved for flooded streets during heavy storm events High hazard conditions were defined for velocities above 1.88 m/s and flow depths above 10 cm, while for moderate hazard, 1.5 m/s and 6 cm were considered as thresholds Hazard level Flow conditions (for flow depths between 9 and 16 cm) High v m/s Moderate 1.51 v < 1.88 m/s Low v <


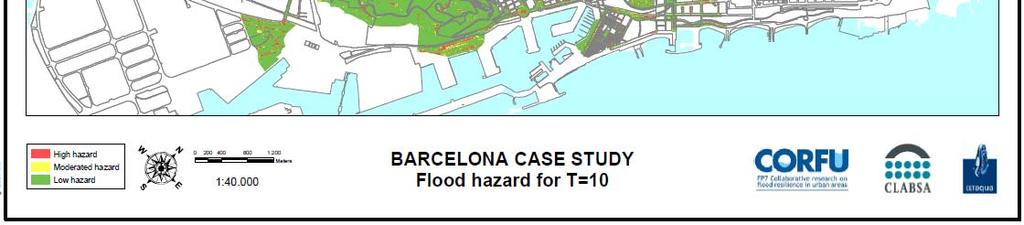
26 Hazard maps for pedestrian circulation 26

, 0.18 Km 2 (T10), 0.")

27 Hazard maps for pedestrian circulation Flood hazard maps for synthetic design storms (T1, T10, T100) High hazard areas: 0.05 Km 2 (T1), 0.18 Km 2 (T10), 0.40 Km 2 (T100) High hazard: 55%of 5.5% the total area High hazard: 19% of the total area High hazard: 44 % of the total area 27
 considering CC High")
 High hazard: High hazard: High hazard: 6.")

28 Hazard maps for pedestrian circulation Flood hazard maps for synthetic design storms (T1, T10, T100) considering CC High hazard areas: 0.06 Km 2 (T1), 0.24 Km 2 (T10), 0.50 Km 2 (T100) High hazard: High hazard: High hazard: 6.5% of the 26% of the 54% of the total area total t area total area Relative increase: 15% Relative increase: 34% Relative increase: 23% 28


29 Hazard criteria for vehicles Specific hazard criteria provided by Water Research Laboratory (Australian Water Engineering Association) i were used to define the hazard level lof the vehicles related to floating and friction i instability. 29

, 0.008 Km 2 (T10), 0.")

30 Hazard maps for vehicular circulation Flood hazard maps for synthetic design storms (T1, T10, T100) High hazard areas: Km 2 (T1), Km 2 (T10), Km 2 (T100) High hazard: High hazard: High hazard: 0.14 % of the 2.4 % of the 25.8 % of the total area total area total t area 30
")
, 0.024 Km 2 (T10), 0.")

31 Hazard maps for vehicular circulation Flood hazard maps for synthetic design storms (T1, T10, T100) considering CC High hazard areas: Km 2 (T1), Km 2 (T10), Km 2 (T100) High hazard: 0.16 % of the total area High hazard: 7.2 % of the total area High hazard: 35.9% of the total area 31
32 Conclusions In the framework of 7th FP CORFU project, the hydraulic behavior and flood resilience of a critical area of Barcelona (Raval District) is analyzed. A 1D/2D coupled model was developed and the interface between the two drainage layers was characterized through empirical expressions related to hydraulic performance of surface drainage systems. Calibration and validation of the model were based on the data (rain gauge data, time series of flow depths recorded by water level gauges, reports and videos concerning flooded areas) related to 4 heavy storm events occurred in The obtained results show that it is possible to reproduce the effects of urban floods in the Raval District in a more realistic way than traditional 1D sewer flow simulations. A specific analysis on the computational time proved that it is possible to carry out simulations in few minutes. This aspect allows to use simulation results for real time strategies and early warning systems. Flood hazard maps concerning pedestrian circulation and vehicular circulation and goods were elaborated for historical heavy storms and several synthetic project storms (T1, T10, T11), and comparisons between current and future scenario were done. 32
33 Other tasks in the BCN Case Study A flood damage model was also developed using specific depth damage curves. The model was calibrated using surveys and data provided by the Spanish Consorcio de Compensación de Seguros. Simulated data seem to overestimate the real damage but this difference can be explained by several considerations. A new calibration process will be carried out using long time series of damage. Moreover a specific procedure for the vulnerability assessment for pedestrian, vehicles was established and implemented. Finally flood risk maps were be developed for current and future scenarios. Several adaptation measures (structural, non structural and SUDS) were planned and simulated to reduce flood risk in Raval District for the future scenarios defined as Adaptation 1, 2 and 3. Comparative analysis will be carried out in order to evaluate the effectiveness of each group of measures. In the final part of the project, FRI (flood resilience indexes) will be defined in order to provide a general procedure to estimate the resilience in the Raval District at different scales. 33


34 Beniamino Russo 34