SPECIAL MONTHLY REPORT ON. ENERGY (Aug 2016)
|
|
|
- Daniela Rich
- 5 years ago
- Views:
Transcription

")

1 SPECIAL MONTHLY REPORT ON ()


 (% change)")

2 PERFORMANCE (July 2016) (% change) NYMEX Natural Gas Crude oil MCX Source: Reuters & SMC PERFORMANCE (January July 2016) (% change) NYMEX MCX Natural gas Crude oil 1
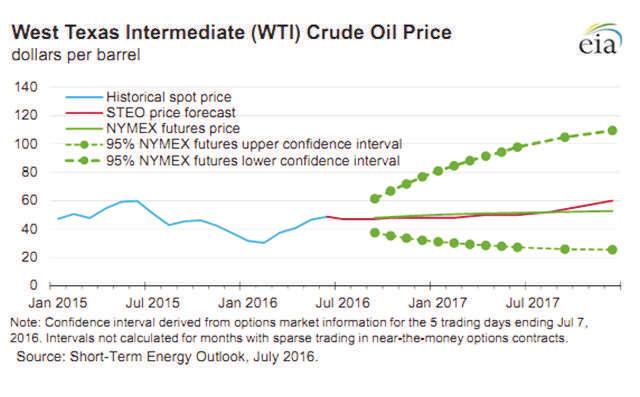
3 COMPLEX Crude Oil Overview In the month of July crude oil prices continued its bearish momentum on supply glut disruptions and decline in demand. Prices managed to hover in range of $ in NYMEX and in MCX. Russian Energy Minister Alexander Novak stated that there were no discussions about possible coordination with OPEC on oil output after a failed attempt to jointly maintain production levels earlier this year. Energy Information Administration (EIA) stated that crude inventories dropped 2.3 million barrels in third week of July, versus forecasts for a 2.1 million-barrel decline. It was the ninth straight weekly draw. Still, U.S. crude inventories are at a historically high million barrels for this time of year. Total U.S. crude and oil product stocks rose 2.62 million barrels to an all-time high of 2.08 billion barrels as gasoline stocks posted a surprise build of 911,000 barrels during summer driving season. Outlook Crude oil futures are expected to trade on volatile path with negative bias in the month of August. Movement of greenback will also affect the price movement of crude oil in near term which can move in range of Crude oil can move in range of in the month of August. U.S. crude headed for its biggest monthly loss in a year, on growing worries that the world was pumping more crude than needed. Surplus barrels of gasoline already have made the glut developing in oil this year more worrisome to some than the crude oversupply of the past two years that had halved prices. U.S. Gulf Coast gasoline stocks hit record highs for the month of July while East Coast inventories reached all-time peaks. US crude oil production peaked at 9.6 MMbpd in June Saudi Arabia Oil Demand Growth at 6- Year Low on Slowdown Oil consumption in Saudi Arabia, the world's biggest crude exporter, is expanding at the slowest pace in at least six years as low energy prices hurt economic growth. The kingdom's demand for oil increased by an average of 24,000 barrels a day in the first five months of 2016, the slowest growth rate for that period since at least 2010, the first year for which data are available from the Joint Organisations Data Initiative in Riyadh. The International Energy Agency is now looking for a drop in demand in Saudi Arabia for all of 2016, after forecasting an increase earlier this year. Latest US rig count The number of rigs drilling for oil in the U.S. rose by three in the penultimate week to 374, marking the fifth straight week of increases, though at a slower clip than the week before, according to oil-field services company Baker Hughes Inc. The U.S. offshore-rig count was unchanged from last week at 19, which are 15 less than a year ago. Latest CFTC report Hedge funds under the Managed Money heading in the Commodity Futures Trading Commission (CFTC) weekly Commitments of Traders report added 37,516 short contracts for WTI crude oil in penultimate week and added 2,037 long contracts. 2

4 Brent WTI Spread Analysis: Brent WTI crude oil spread can hover in range of $0-2 in the month of July. Source: Reuters 3
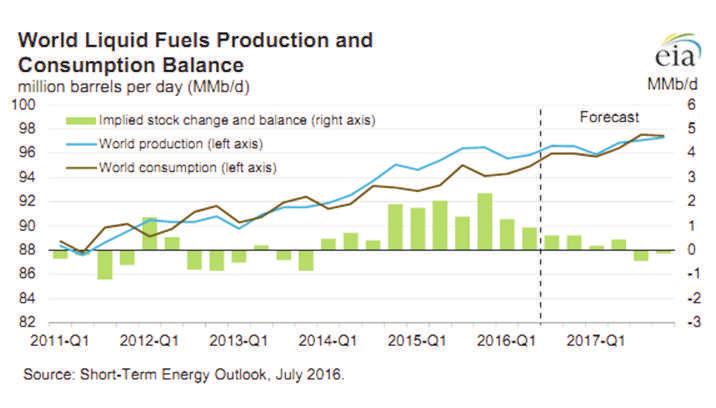
5 Some key points from EIA estimates Liquid fuel Consumption Global consumption of petroleum and other liquid fuels is estimated to have grown by 1.4 million b/d in EIA expects global consumption of petroleum and other liquid fuels to increase by 1.4 million b/d in 2016 and by 1.5 million b/d in 2017, mostly driven by growth in countries outside of the Organization for Economic Cooperation and Development (OECD). Non-OECD consumption growth was an estimated 1.0 million b/d in 2015, and it is expected to be 1.3 million b/d in 2016 and 1.5 million b/d in Liquid Fuels Supply production decline rates and relatively short investment horizons, making it among the most price-sensitive oil production globally. Forecast total U.S. production of liquid fuels declines by 0.5 million b/d in 2016 and by 0.1 million b/d in 2017, as declining onshore crude oil production is partially offset by expected growth in HGL production, Gulf of Mexico crude oil production, and liquid biofuels production. Outside the United States, forecast non-opec production declines by 0.1 million b/d in both 2016 and Crude oil may trade on downside path as supply glut scenario and weak demand can keep the prices on weaker side. Global macroeconomic numbers along with weekly inventory data in US will also affect the overall sentiments. EIA estimates that petroleum and other liquid fuels production in countries outside the Organization of the Petroleum Exporting Countries (OPEC) grew by 1.6 million b/d in 2015, with more than half of the growth occurring in North America. EIA expects non-opec production to decline by 0.6 million b/d in 2016 and by 0.2 million b/d in Changes in non-opec production are largely driven by changes in U.S. tight oil production, which has high Range Crude Oil MCX NYMEX Rs per barrel $37-47 per barrel 4
6 5
7 6
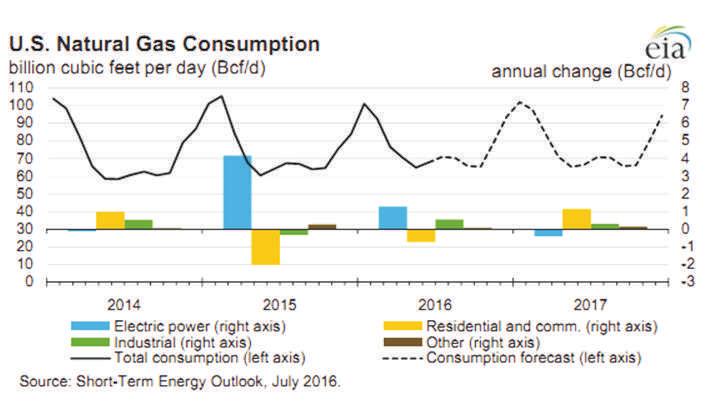
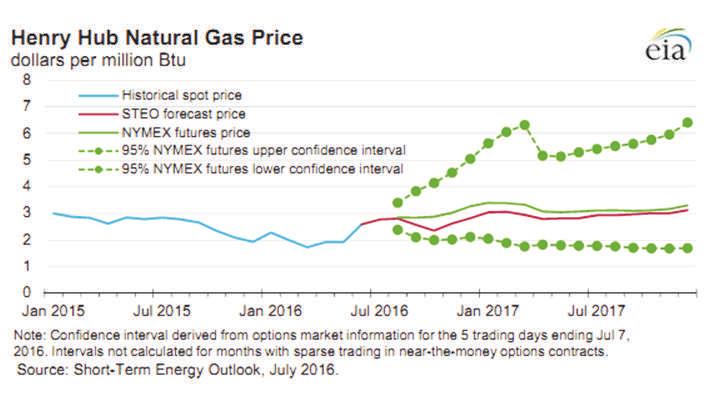
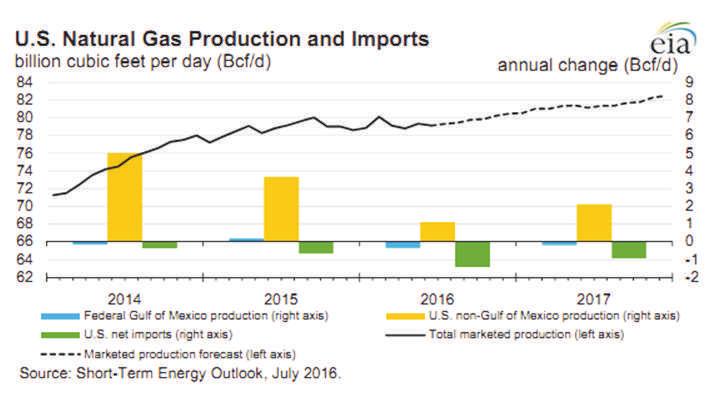
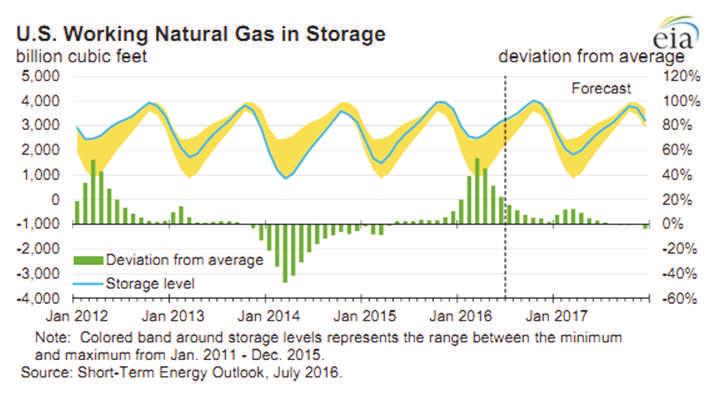
8 Natural Gas Overview Natural gas continued its upside momentum in the month of July amid increasing demand amid hotter temperatures and falling production. Overall it traded in range of $ in NYMEX and in MCX in the month of July. Natural gas prices are down more than 10% since reaching a 13- month high on July 1 amid speculation that July heat won't prevent stockpiles from reaching a record before the winter. So far this year, US drillers have reduced average dry gas output in the lower 48 states to 73.0 bcfd from a record 73.5 bcfd in The US power sector has burned an average of 26.3 bcf per day so far in 2016, topping the record 24.7 bcfd of a year earlier. Generators are expected to burn more than 40 bcfd on several days over the next two weeks to meet air conditioning demand. Outlook Natural gas may trade on upside path as it can move in range of in the month of August. The EIA reported that U.S. working stocks of natural gas totaled about trillion cubic feet, around 524 billion cubic feet above the five-year average of trillion cubic feet and 436 billion cubic feet above last year's total for the same period. Unless intense summer heat boosts demand from power plants, stockpiles will test physical storage limits of 4.3 trillion cubic feet at the end of October. Inventory injections have been trailing historic averages for most of the season, diminishing the supply glut as power generators consume a record amount of fuel while output declines. Heat wave in US to increase natural gas demand More people have been running their air conditioners to combat the heat, so more natural gas is being used to power the AC. The reduced stockpile has some traders concerned this could affect natural gas in the winter, when it becomes the primary fuel for heating homes. The rising temperatures have caused an uptick in electricity generation for cooling to combat the summer heat. According to PointLogic Energy data, power generators burned about 36.2 bcf a day of gas so far this month, up 9.6% year-over-year. EIA Forecasts U.S. Natural Gas Consumption EIA's forecast of U.S. total natural gas consumption averages 76.5 Bcf/d in 2016 and 77.7 Bcf/d in 2017, compared with 75.3 Bcf/d in In 2016, increases in total natural gas consumption are mainly attributed to increases in electric power sector use. Forecast electric power sector use of natural gas increases by 4.9% in 2016, then declines by 1.4% in 2017, as rising natural gas prices contribute to increasing coal use for electricity generation. Forecast industrial sector consumption of natural gas increases by 2.7% in 2016 and by 1.5% in 2017, as new fertilizer and chemical projects come online. Natural Gas Production and Trade EIA's estimated natural gas production in June averaged 79.1 Bcf/d, which is down almost 1.0 Bcf/d from the record-high daily average production in February EIA expects production to rise through 2016 and 2017 in response to forecast price increases and increases in liquefied natural gas (LNG) exports. Overall, EIA expects natural gas production to rise by 1.0% in 2016 and by 2.4% in Natural gas pipeline exports to Mexico have risen this year, and EIA expects that growth to continue because of growing demand from Mexico's electric power sector and because of flat natural gas production in Mexico. Gross pipeline exports are expected to increase by 0.7 Bcf/d in 2016 before falling by 0.2 Bcf/d in 2017 to an average of 5.3 Bcf/d. Natural gas may continue its bullish momentum in the month of August on renewed demand and fall in rig count. Weather conditions in US and inventory data is likely to give further direction to the prices. Range Natural gas NYMEX $2.50- $3.20 per mmbtu MCX Rs per mmbtu 7
9 8

10 9
11 July 2016 Sandeep Joon Boardline : Extn: 683 SMC Global Securities Limited is proposing, subject to receipt of requisite approvals, market conditions and other considerations, a further public offering of its equity shares and has filed the Draft Red Herring Prospectus with the Securities and Exchange Board of India ( SEBI ) and the Stock Exchanges. The Draft Red Herring Prospectus is available on the website of SEBI at and on the websites of the Book Running Lead Manager i.e., ICICI Securities Limited at and the Co- Book Running Lead Manager i.e., Elara Capital (India) Private Limited at Investors should note that investment in equity shares involves a high degree of risk and for details relating to the same, please see the section titled Risk Factors of the aforementioned offer document. Disclaimer: Sr. Research Analyst (Metals & Energy) sandeepjoon@smcindiaonline.com This report is for the personal information of the authorized recipient and doesn't construe to be any investment, legal or taxation advice to you. It is only for private circulation and use.the report is based upon information that we consider reliable, but we do not represent that it is accurate or complete, and it should not be relied upon as such. No action is solicited on the basis of the contents of the report. The report should not be reproduced or redistributed to any other person(s)in any form without prior written permission of the SMC. The contents of this material are general and are neither comprehensive nor inclusive. Neither SMC nor any of its affiliates, associates, representatives, directors or employees shall be responsible for any loss or damage that may arise to any person due to any action taken on the basis of this report. It does not constitute personal recommendations or take into account the particular investment objectives, financial situations or needs of an individual client or a corporate/s or any entity/s. All investments involve risk and past performance doesn't guarantee future results. The value of, and income from investments may vary because of the changes in the macro and micro factors given at a certain period of time. The person should use his/her own judgment while taking investment decisions. Please note that we and our affiliates, officers, directors, and employees, including persons involved in the preparation or issuance if this material;(a) from time to time, may have long or short positions in, and buy or sell the commodities thereof, mentioned here in or (b) be engaged in any other transaction involving such commodities and earn brokerage or other compensation or act as a market maker in the commodities discussed herein (c) may have any other potential conflict of interest with respect to any recommendation and related information and opinions. All disputes shall be subject to the exclusive jurisdiction of Delhi High court. 10