Site Characterization Report
|
|
|
- Lindsey Hart
- 5 years ago
- Views:
Transcription

1 Prepared for: Prepared by: Consolidated Edison Co of NY, Inc New York, NY Chelmsford, MA March 15, 2012 Site Characterization Report York Avenue Former Gas Holder Station Manhattan, New York Site #V00544

2 Prepared for: Consolidated Edison Co of NY, Inc New York, NY Prepared by: Chelmsford, MA March 15, 2012 Site Characterization Report York Avenue Former Gas Holder Station Manhattan, New York Site #V00544 Prepared By: Anna Sullivan, Senior Geologist Reviewed By: Peter S. Cox, P.G., Project Manager
3 i Contents 1.0 Introduction Purpose of Work Scope of Work Report Organization Site Description and History Site Description Adjoining Property Description Background Geology Background Hydrogeology Site History History of Operations Gas Holder Layout, Key Site Features, and Operations Other Site Uses Site Ownership Previous Investigations Investigation Activities Underground Utility Clearance Community Air Monitoring Surface Soil Sampling Subsurface Soil Sampling Soil Boring Installations Monitoring Well Installation Monitoring Well Development Groundwater Sampling Depth to Groundwater Measurements Groundwater Sample Collection Hydraulic Conductivity Testing Soil Gas Sampling Site Survey Site Restoration Investigation Residual Management Field Investigation Results
4 ii 4.1 Site Geology Fill Unit Sand Unit Gravel and Sand Unit Mixed Coarse-grained Unit Bedrock Site Hydrogeology Hydraulic Conductivity Testing Results Source Area Investigation Observations Gas Holders Other Potential Sources Analytical Results Analytical Program Chemical Analyses Quality Control Surface Soil Results Surface Soil VOC Results Surface Soil SVOC Results Surface Soil PCB Results Surface Soil Metals Results Surface Soil Cyanide Results Subsurface Soil Subsurface Soil VOC Results Subsurface Soil SVOC Results Subsurface Soil PCB Results Subsurface Soil Metals Results Subsurface Soil Cyanide Results Groundwater Results Groundwater VOC Results Groundwater SVOC Results Groundwater PCB Results Groundwater Metals Results Groundwater Cyanide Results Soil Gas Sampling Results Forensic Analysis Qualitative Human Health Exposure Assessment Site Setting On-site Area
5 iii Off-site Areas Exposure Assessment Conceptual Site Model Potential Human Receptors and Exposure Pathways Conclusions Summary and Conclusions Site Hydrogeology Site Hydrogeology Nature and Extent of Constituents of Interest Surface Soil Subsurface Soil Groundwater Soil Gas Human Health Risk Assessment Recommendations References List of Appendices Appendix A Soil Boring and Monitoring Well Logs Appendix B Groundwater Sampling Forms Appendix C Slug Test Data Appendix D NYSDEC Petroleum Storage Tank Information Appendix E Forensic Results Appendix F Analytical Result Summary Tables, Data Usability Summary Reports (DUSRs), and laboratory reports (CD)
6 iv List of Tables Table 3-1 Table 3-2 Table 3-3 Table 3-4 Table 5-1 Table 5-2 Table 5-3 Table 5-4 Table 5-5 Table 6-1 Table 6-2 Summary of Surface Soil Samples Collected, Sample Rationale, and Analyses Performed During the Site Characterization Study August 2004 Summary of Subsurface Soil Samples Collected, Sample Rationale, and Analyses Performed During the Site Characterization Study Summary of Monitoring Well Construction, Well Survey, and Water Level Gauging Results Summary of Groundwater Samples Collected, Sample Rationale, and Analyses Performed During the Site Characterization Study Summary of Analytical Results for Surface Soil Summary of Analytical Results for Subsurface Soil Summary of Field Parameters Recorded During Groundwater Sampling Summary of Analytical Results for Groundwater Summary of Soil Gas Analytical Results Summary of On-site Potential Human Health Receptors and Potentially Complete Exposure Pathways (to be provided in final report) Summary of Off-site Potential Human Health Receptors and Potentially Complete Exposure Pathways (to be provided in final report) List of Figures Figure 1-1 Figure 2-1 Figure 2-2 Site Location Map Current Site Layout Composite Historical Features
7 v Figure 3-1 Figure 4-1 Figure 4-2 Figure 4-3 Figure 4-4 Sample Location Map Geologic Cross Section Location Map Geologic Cross Section A-A Geologic Cross Section B-B Top of Bedrock Elevation Map Figure 4-5 Groundwater Elevation Contour Map October 2005 Figure 5-1 Figure 5-2 Figure 5-3 Figure 5-4 Figure 5-5 Figure 6-1 Surface Soil Analytical Results Subsurface Soil VOC, SVOC, and PCB Analytical Results Subsurface Soil Metal and Cyanide Analytical Results Groundwater VOC, SVOCs, and PCB Analytical Results Groundwater metal and Cyanide Analytical Results Conceptual Site Model
8 vi List of Acronyms ASP bgs BTEX COC COI DUSRs EDR ELAP GPR HASP HSA IDW IRM MGP MS MSD NAPL NAVD NTU NYCDEP NYSDEC NYSDOH ORP Analytical Service Protocols below ground surface benzene, tolune, ethylbenzene and xylene Constituents of concern Constituents of interest Data Usability Summary Report al Data Resources al Accreditation Program ground-penetrating radar Health and Safety Plan hollow stem auger investigation derived waste Interim Remedial Measures Manufactured Gas Plant matrix spikes matrix spikes duplicates nonaqueous phase liquid North American Vertical Datum nephelometric turbidity units New York State Department of al Protection New York State Department of al Conservation New York State Department of Health oxidation/reduction potential
9 vii PAHs PCBs PID PPE PSC PVC QA/QC QAPP RCRA RI SC SCOs SVOC USCS USEPA UST VOC polycyclic aromatic hydrocarbon polychlorinated biphenyl photo-ionization detector personal protective equipment Public Service Commission polyvinyl chloride Quality assurance/quality control Quality Assurance Project Plan Resource Conservation and Recovery Act Remedial Investigation Site Characterization Soil Cleanup Objectives semi-volatile organic compound Unified Soil Classification system United States al Protection Agency underground storage tank volatile organic compound
10 ES-1 Certification Page I, Peter S. Cox, certify that I am currently a Qualified al Professional as defined in 6 NYCRR Part 375 and that this Site Characterization Report was prepared in accordance with all applicable statues and regulations and in substantial conformance with the DER Technical Guidance for Site Investigation (DER-10) and that all activities were performed in full accordance with the DERapproved work plan and any DER-approved modifications. Signature Date
11 ES-2 Executive Summary This Site Characterization (SC) Report for the York Avenue former Gas Holder Station site (Site) located at York Avenue between East 61 st and East 63 rd Streets in New York, NY presents a detailed description of the Site and investigation results obtained to-date at the Site. This investigation was performed pursuant to a Voluntary Cleanup Agreement between Consolidated Edison of New York, Inc. (Con Edison) and the New York State Department of al Conservation (NYSDEC). The objective of the SC is to assess whether residual materials associated with the operation of the gas holder station are present in the environment at the Site, and if so, whether additional investigation to characterize these materials is necessary. The Site is divided between six different property owners. It was determined that the Site could be adequately characterized by investigation of four of these properties, plus the areas which can be accessed by work on city sidewalks. The rationale for investigation of each property, status of the work, and findings to-date for each of these locations is summarized below: Mount Vernon Hotel Museum (location of building used for offices for the gas holder station) Investigation completed. No residuals associated with gas operations were detected. Soil quality was consistent with typical urban soils, although one sampling location appeared to be slightly elevated over background concentrations. Rockefeller University (service building for gas holder operations) Boring was attempted, but not completed due to site conditions (basement of garage is below the water table, which precludes normal drilling procedures). Well or boring could not be drilled outside of the garage due to the high density of subsurface utility lines and the temporary traffic patterns associated with the FDR Drive reconstruction project. Monitoring well was installed east of the property in the right-of-way along FDR Drive. Investigation completed. Soil quality was consistent with typical urban soils although benzene and two polycyclic aromatic hydrocarbon (PAHs) were detected at concentrations above standards in groundwater at this location. Sutton Terrace Apartments (location of four former gas holders) Borings were attempted and partially completed at all locations. These investigation borings determined the following: Gas holder foundations contain coarse fill and groundwater. Hydrocarbons were found in this fill inside Gas Holder No. 3 at two locations: A one-foot zone of hydrocarbon material found at the base of the western edge of Gas Holder No. 3, and a pocket of impacted soil and wood found immediately beneath the floor of the parking garage at location MW-4. A forensic analysis could not identify either of these materials. A small zone of hydrocarbon impact was also found in a boring inside of Gas Holder No. 2. Groundwater within the gas holders shows slight to moderate impacts. Soil samples obtained from two locations did not show evidence of residuals related to gas operations York Avenue (location of Gas Holder No. 1) Investigation completed in southern quadrant where access was granted. Minimal impacts including limited PAH detections and exceedances of Soil Cleanup Objectives (SCOs) at two subsurface soil locations were noted
12 ES-3 during the SC. No visible impacts, nonaqueous phase liquid (NAPL), or widespread impacts exceeding SCOs were encountered. City Sidewalks Three wells were installed (1 background well and 2 wells immediately downgradient of both of the gas holder sites). Both wells installed downgradient of the gas holders showed low concentrations of compounds in soil or groundwater. One well was installed in the FDR Drive right-of-way east of four of the former holders and showed low concentrations of compounds in soil or groundwater. No risk to on-site or off-site receptors was identified from any of the Site conditions observed. No remedial measures or modifications to Site use are recommended at this time. Additional remedial investigation (RI) activities are recommended at the Sutton Terrace Apartments property to complete the characterization of the Site. The remaining properties do not require any further investigation activities.
13 Introduction This report presents the results for the Site Characterization (SC) that was performed during 2004, 2005, and 2011 at the former York Avenue gas holder station, located from East 61 st to East 63 rd Streets, between York and First Avenues, in the Borough of Manhattan, New York City, New York. The report has been prepared for Consolidated Edison Company of New York, Inc. (Con Edison) by. The SC was performed to assess environmental conditions at the Site in order to determine whether impacts related to the storage of manufactured gas were present in the subsurface. The Site location is illustrated in Figure 1-1. This report presents the Site history, the methodologies of the field investigation activities, the observations made during the field investigation, analytical results of environmental samples, Site conditions, a qualitative risk assessment, and recommendations for supplemental activities. The SC Report was prepared in accordance with the most recent and applicable guidelines of the New York State Department of al Conservation (NYSDEC) including DER-10 Technical Guidance for Site Investigation and Remediation (May 2010). 1.1 Purpose of Work The primary objective of the SC was to collect sufficient environmental data of suitable quality to assess: The presence or absence and nature of gas holder residuals which may be present at the Site, and the need for additional sampling to fully delineate any gas holder residuals identified; Whether constituents identified at the Site present a threat to human health and/or the environment; and The need for remediation or interim remedial measures (IRMs) to mitigate any impacts encountered, to prevent migration of gas holder residuals or their constituents, and/or to minimize or reduce potential exposure risks posed by existing site conditions related to the former gas holders. The focus of this SC was to investigate current environmental conditions at the Site to determine if they have been influenced by former gas holder operations. The sampling locations investigated during the SC were selected to target areas most likely to contain gas holder residues. Similarly, the analytical parameters specified in the NYSDEC-approved SC Work Plan (RETEC, 2004) were selected based on the types of materials or residues associated with production of the gas during the period of holder operations, namely, manufactured gas plants (MGPs) using both coal gas and carbureted water gas processes. 1.2 Scope of Work The scope of work for this SC, as defined in the Work Plan, included the following field tasks: Underground utility clearance and geophysical survey; Community air monitoring;
14 1-2 Surface soil sampling; Subsurface soil sampling; Soil gas sampling; Installing soil borings; Monitoring well installation; Groundwater sampling; Hydraulic conductivity testing; Site survey; Management of investigation-derived waste and, Site Restoration. All activities were performed in accordance with the Site-Specific Health and Safety Plan included in Appendix C of the SC Work Plan and amendments. 1.3 Report Organization The SC Report is organized into sections and appendices listed below. Section 2 provides a description of the York Avenue Site and surrounding properties and summary information regarding Site ownership and operational history. Section 3 provides a description of field investigation activities for the Site. Section 4 provides a discussion of the geologic and hydrogeologic findings for the Site, and field observations of environmental conditions encountered. Section 5 provides a discussion of chemical analyses performed, the quality control and quality assurance sample collection and evaluation, and the environmental sample analytical results. Section 6 provides a qualitative risk assessment and a discussion of the potential risks present at the Site as they relate to the current environmental conditions at the Site. Section 7 provides a summary of the investigation results. Section 8 outlines recommendations for additional activities. Section 9 provides a list of references cited in the SC Report. Tables and Figures for the SC Report are provided in their own respective sections following Section 9. Appendix A Soil boring and monitoring well logs Appendix B Groundwater sampling forms Appendix C Hydraulic conductivity testing data Appendix D Forms provided by the NYSDEC which describe the registered petroleum storage tanks on the Sutton Terrace and the York Avenue properties, and which provide information on petroleum spill events related to the storage tanks.
15 1-3 Appendix E Provides laboratory reports and information on forensic analysis of samples. Appendix F Analytical result summary tables, Data Usability Summary Reports (DUSRs), and laboratory reports (electronic copy).
16 Site Description and History This section provides a description of the York Avenue Site and surrounding properties, and summary information regarding Site ownership and the operational history of the former gas holder station. The information presented in the following sections was obtained primarily from the report titled MGP Research Report, York Avenue Station [Langan, 2002]. Information on subsurface conditions was provided by a small set of building foundation plans from 1949 for the construction of the Sutton Terrace Apartment complex. One figure provided the locations and logs for a set of geotechnical borings. Although this figure appears to be authoritative, it does not cite a reference or ground surface elevation for the boring logs. The floor elevation for Gas Holder No. 3 is cited on other construction drawings for Sutton Terrace, but the elevation for the floor of Gas Holder No. 2 must be inferred. Additional subsurface information was provided by two sets of geotechnical boring logs obtained from the field office for the FDR Drive reconstruction project. These borings were obtained east of the Site, but provide information on the depth of bedrock and type of soils and fill found along the East River. 2.1 Site Description The former York Avenue gas holder station is located on portions of three blocks in the Borough of Manhattan of New York City. The Site is comprised of three parcels of land, which cover a total land area of approximately 5.2 acres. None of the former gas holder station structures are present above the ground surface at the Site today. Figure 2-1 shows the current site layout. The eastern portion of Block 1456, bounded by East 61 st Street to the south, York Avenue to the east, East 62 nd Street to the north, and 1 st Avenue to the west, was the location of a single gas holder (see Figure 2-2). The eastern portion of Block 1457, bounded by East 62 nd Street to the south, York Avenue to the east, East 63 rd Street to the north, and 1 st Avenue to the west, was the location for a total of four gas holders over the history of the site. The third block (Block 1475), bounded by York Avenue to the west, East 62 nd Street to the south, FDR Drive to the east, and East 63 rd Street to the north, was the location for a support building for the gas holders and a gas company storage yard. The site is zoned for residential (zoning codes R8 and R10), commercial (C8-4), and manufacturing (M3-2) use. Most of the Site is currently covered by buildings with basements and by underground parking garages. With the exception of the grounds surrounding a small building which pre-dates the holder station, all of the soil and landscaped areas are constructed above underground structures. The parcels and structures which comprise the site today are as follows: Block 1456, Lots 1001 through East 61 st Street and 430 East 62 nd Street: Small surface parking area, multi-level underground parking garage, and 12-story condominium/ office building. The owners of the condominiums are listed in the title search for the Site (Langan, 2002). An inspection of the building from the street indicates that the building is used for commercial offices.
17 2-2 Block 1456, Lot East 61 st Street: A two-story building known as the Mount Vernon Hotel Museum, constructed in The Sanborn maps for the site do not indicate the presence of a basement beneath the building. During utility clearance at this property only a small basement utility room was found to be present, located under the western portion of the building. The grounds surrounding this building are elevated above the adjacent street level and the property immediately east. A large bedrock outcrop is found at the west side of the lot. Block 1456, Lot York Avenue: Six-story commercial building, consisting of a garage, commercial office and warehouse space. A placard on the outside wall of the building notes that a 10,000 gallon #2 fuel oil tank is located inside the building. The filler port for this tank is located in the adjacent sidewalk. The tank itself was observed to be located in a basement area under the northeast corner of the building and is reported to be closed in place. A sump containing standing water was also observed to be present in this basement. A representative of a business occupying the building (a cable TV company) stated that the tank had leaked in the past, and that an oil spill investigation had been performed and submitted to the New York City Department of al Protection (NYCDEP). Block 1456, Lot East 62 nd Street: A 19-story cooperative residential building, with basement and underground parking garage. Block 1457, Lot East 63 rd Street: The Sutton Terrace Apartment property, which consists of three 12-story residential buildings with ground-level courtyards and landscaped areas, a playground, and a four-level underground parking garage. The eastern Sutton Terrace building, which fronts York Avenue, houses various storefronts ( York Avenue). These include medical offices, and vacant spaces. Block 1475, Lot 5 York Avenue: A 26-story Rockefeller University housing tower and a separate partially underground three-level parking garage. An additional parcel was identified by Langan (2002) as part of the former gas holder Site, but was not included in the title search: Block 1456, Lot East 61 st Street/417 East 61 st Street: This is a two to three-story building which is associated with the Mount Vernon Hotel Museum; it is identified as the headquarters for the Colonial Dames of America, the owner of both properties. The Sanborn maps do not indicate the presence of a basement. Historical maps of the Site do not indicate that Lot 10 was ever associated with gas holder operations or part of the gas company property holdings, therefore further investigation of this property was not performed Adjoining Property Description The Site is located in a mixed residential and commercial use area. The neighboring properties include the following: To the north, residential buildings, with street-level commercial storefronts along York Avenue; To the west, restaurants, residential and commercial buildings; To the south, restaurants, residential and commercial buildings; and
18 2-3 To the east, a veterinary hospital, a gasoline station, a hotel, and FDR Drive Background Geology The Site is sloped from the northwest to southeast, towards the East River, with a change in elevation of approximately 35 feet, from a high of 43 feet above North American Vertical Datum 1 * (NAVD) at the bedrock outcrop at the Mount Vernon Hotel Museum, to a low of approximately 8 feet NAVD outside the Rockefeller University parking garage. Surface water runs off the site to the southeast via sheet flow. With the exception of the Mount Vernon Hotel Museum grounds, nearly the entire Site is covered by buildings or pavement, therefore most surface water is presumed to be captured by the storm drain system. Note that the courtyard for the Sutton Terrace Apartments is constructed above an underground parking garage, and that all of the precipitation is collected into a stormwater system. Soils at the Site are mapped as Pleistocene-Age glacial till, deposited as ground moraine. These materials consist of poorly sorted sand, silt, and clay with lesser amounts of gravel, cobbles, and boulders. The former shoreline of the East River runs through Block 1475, therefore reworked beach soils may be present in this area, with fill of undetermined origins present to the east. It is expected that much of the native soil at the Site has been removed during building construction, or buried beneath fill. Except for the soils on the grounds of the Mount Vernon Hotel Museum, it is likely that all of the soil found in plantings and landscaped areas has been imported. The bedrock at the Site is mapped as a schist of the Manhattan Formation that is Cambrian in age. Bedrock is exposed at the ground surface at the Site at the northwest side of the Mount Vernon Hotel Museum building. Bedrock is present at the basement level of the western Sutton Terrace building, and it was reported by the building manager that bedrock was removed to construct the playground area at the western side of the building. The depth of bedrock at the eastern side of the Site can be estimated from boring logs from previous construction projects. Boring logs which were compiled for the FDR Drive reconstruction project show that the Site is located over a bedrock trough. This trough is located between 59 th and 63 rd Streets, with its base from 60 th to 62 nd Streets. The top of bedrock in this trough is at approximately -90 feet NAVD below the FDR Drive. Bedrock shallows to the north to -30 feet NAVD at 63 rd Street, and to -20 feet NAVD at 59 th Street. Borings approximately 120 feet west of the FDR Drive immediately behind the Rockefeller University Garage and residence building show bedrock to be only feet below ground surface (bgs), indicating a steep bedrock surface dipping towards the East River. Boring logs indicate that the upper portion of the bedrock is weathered in-place, and capped by glacial drift. A thin sand unit is found above the glacial drift, with a thick fill layer extending to the ground surface. Brittle structures mapped in the rock beneath Manhattan have been mapped to have a predominant northeast-southwest orientation, with a secondary orthogonal northwest-southeast fracture (Isachsen and McKendree, 1977). These fractures are nearly vertical. The site is located approximately 600 feet west of the Cameron s Line thrust fault. 1 * Note that all elevations in this report are referenced to North American Vertical Datum of 1988 (NAVD). Historic documents reference Borough Datum for Manhattan, which is above NAVD.
19 Background Hydrogeology Prior to investigation activities, groundwater flow direction was assumed to mimic the surface topography that slopes from the northwest to southeast, with eventual discharge to the West Branch of the East River, approximately 400 feet east of the Site. The groundwater flow direction may be significantly modified by man-made structures, such as building foundations and utility lines and tunnels. The water table is found within the unconsolidated soils east of York Avenue and may be tidally influenced. Upgradient of the Site the water table may be found in bedrock or unconsolidated soils, depending on the local subsurface conditions. The transition of the water table from bedrock to unconsolidated soils occurs within the Site west of York Avenue. A well search of both Federal and New York State databases was completed to determine if water wells are present in the vicinity of the Site. No wells were identified within a radius of one mile of the Site. Groundwater at the Site is classified as Class GA fresh groundwater with best usage as a source of potable water supply. Note however, that groundwater along the East River may be saline, and that groundwater within Manhattan is not used as a potable water supply. 2.2 Site History This section provides a brief history of the ownership and operations conducted at the former gas holder Site, as reported in MGP Research Report, York Avenue Station [Langan, 2002]. The ownership history of the former gas holder Site was established using historical and current records from the earliest record of the Site, through the time of the gas holder operations, to the present time. The information and records reviewed included the Brown s Directory of American Gas Companies, Public Service Commission (PSC) Reports, Con Edison records, and historical maps History of Operations A comprehensive operational Site history was developed for the York Avenue gas holder station by Langan (2002) using Brown s Directory, PSC Reports, historical maps (Sanborn Maps and Atlas Maps), aerial photographs, and information provided by Con Edison. Figure 2-2 displays the historical Site layout of the former gas holder station structures and a brief description of their functions. The first gas holders constructed at the Site were erected on Block 1457 sometime between 1874 and 1879 by the Metropolitan Gas Light Company. A historical map dated 1879 shows two gas holders, located along the southeast side of the block along 62 nd Street. According to PSC records, a third gas holder was constructed on this block, to the west of the first gas holders, in This holder had a capacity of 3 million cubic feet, contained by three telescoping lifts. The holder foundation was constructed of brick, with the floor of the holder pit comprised of concrete over bedrock. The first Sanborn map of the property, dated 1892, shows what is presumed to be the two small gas holders along the southeast side of the block, along with the larger gas holder to the west. The Sanborn map also shows other small structures on the property. One of these structures is labeled as an office; the other structures are not identified. No gas company related operations were shown on Blocks 1456 or A portion of the future location of Gas Holder No. 1 was labeled as a stone yard, but quarrying operations were not indicated on the map. The northern portion of Block 1475 was identified as a coal yard. At this time Block 1475 ended at the East River. The gas holder property on Block 1457 was acquired by Consolidated Gas Company of New York in 1884, and transferred again in 1905 to the Standard Gas Light Company of the City of New York. In
20 , the portion of Lot 1456 which was subsequently used for construction of a gas holder was acquired by The Standard Gas Light Company of New York. The 1907 Sanborn map shows that the two small gas holders and the small structures on Block 1457 had been removed, and replaced by a single large holder covering the entire eastern end of the block (Gas Holder No. 2). A new (or possibly reconfigured) office is shown facing East 63 rd Street, set between the two holders. An unnamed structure containing three boilers is shown at the westernmost side of the gas company lot. The western holder (Gas Holder No. 3), presumed to be that shown on the 1892 Sanborn map, is described as being 190 feet high, with a capacity of 3 million cubic feet. The eastern holder is described as 220 feet high, with a capacity of 5 million cubic feet. On Block 1456, a single large holder is shown with the same dimensions and capacity as the eastern holder on Block PSC records from 1924 indicate that both of the foundations for the new holders were constructed of concrete on top of bedrock (this is contradicted by the 1949 geotechnical boring logs advanced through the foundation of Gas Holder No. 2). Block 1475 is shown on the 1907 Sanborn map to be owned by Consolidated Gas. The northern portion of the block, which was formerly a coal yard, is now identified as a storage yard, with three small buildings present, one of which is identified as a paint shop. The southwest corner of the block is the location of a building identified as a valve house. Three boilers are shown inside the building, with a smokestack located immediately to the east of the building. Gas company records indicate that the 3 million cubic foot holder on Block 1457 was dismantled in 1923 and rebuilt as a 5 million cubic foot holder (Gas Holder No. 3). The dismantled superstructure of the holder (the three lifts and the guide frame) was sold. A portion of Block 1457, consisting of what is now the Mount Vernon Hotel Museum, was sold by the gas company in 1924 to the Colonial Dames of America. An aerial photograph shows the Site configuration during the 1930s prior to the construction of the East River (now FDR) Drive. The photograph shows that piers extending into the East River were present at the ends of 61 st and 62 nd Streets, with multiple barges present. Block 1475 was expanded to the east during the 1930s for the construction of the East River (FDR) Drive. Based on historic maps it does not appear that the gas company property or structures were modified by this work, other than by the loss of the shorefront access and docks associated with the property. The source of the fill materials is unknown. A 1943 Con Edison facility map shows the three gas holders at the locations shown on the 1907 Sanborn map. Gas Holder No. 1 is identified as the structure located on Block 1456; Gas Holder No. 2 is the eastern holder on Block 1457; Gas Holder No. 3 is the western holder on Block Holder No. 3 is identified as retired ; however, later gas company records indicate that this holder was in use as late as The construction details of the three holders are described as follows: Gas Holders No. 1 and No. 2: Capacity: 5 million cubic feet Pit diameter: 190 feet, 10 inches (Holder No. 2 only) Steel tank, 41 feet deep Five lifts, with a height above the tank of 190 feet Bottom lift diameter: 188 feet
21 2-6 Top lift diameter: 177 feet, 6 inches Gas Holder No. 3: Capacity: 5 million cubic feet Pit diameter: 187 feet Brick pit, 44 feet, 4 inches deep Five lifts, with a height above the tank of 190 feet Bottom lift diameter: 184 feet Top lift diameter: 174 feet A small structure identified as a skimmer pump house is shown on the southeast side of the holder. Note that the word pit is not shown on Holder No. 1, though it is described as having a tank 41 feet deep, with the same diameter as the pit for Holder No. 2. On Block 1475, the building identified on the Sanborn map as a valve house is shown in greater detail in several building profiles. The building is shown to contain gas mains, an exhauster house, a former boiler house, blowers, engines, a calorimeter room and storage space. The former store yard and its associated buildings to the north are shown as not part of the gas company property at this date. The map also indicates that this block has been expanded to the east, and is now bordered by the East River (FDR) Drive. The gas holders at the Site operated until Documents from Con Edison s Real Estate Department indicate that the superstructures for the holders were removed by Con Edison, and the piping capped and abandoned in-place. For Gas Holder No. 1 (eastern portion of the block between 61 st and 62 nd Streets), the records indicate that the tank pit was backfilled to the ground surface in 1949; no mention is made of what the backfill material was. For Gas Holders No. 2 and 3 (Sutton Terrace property), a Con Edison letter which documents the transfer of the property noted that the gas holder pits were left unfilled, at the request of the purchaser, and that the brick foundation for Holder No. 3 (the western holder) was left in-place. This brick foundation is shown on a 1949 construction drawing for the Sutton Terrace apartment buildings. In 1949 the property on Block 1457 was sold to a private company (the New York Infirmary for Women and Children) which then sold the property for construction of the existing apartment complex. The property on Block 1456 was transferred to the Archbishopric of New York in 1949, which then subdivided the property and sold it to various private companies. None of the gas holders or related structures were shown on Blocks 1456 and 1457 on the 1951 Sanborn map. Block 1457 was shown as redeveloped into the Sutton Terrace Apartments; Block 1456 was shown as mostly vacant, with a new building on the southeast quadrant. The valve house on Block 1475 was shown as owned by Con Edison, but no details of the building can be seen on the map due to the quality of the reproduction provided by al Data Resources (EDR), the owner of the Sanborn Map Company. Further details on the history of development of these three blocks are provided in the Langan report Gas Holder Layout, Key Site Features, and Operations Based on the available historical information, it is likely that all five of these holders were conventional multi-lift holders, constructed with subsurface holder pits and employing water seals.
22 2-7 According to gas company records, all three of the large holders were constructed with their foundations on top of bedrock. These records do not indicate whether the base of the holder pits were excavated into the surrounding soil, quarried into bedrock, or both. Based on the information obtained during this SC, it appears that most of Gas Holder No. 3 was founded on bedrock. Gas Holder No. 2 does not appear to be founded on bedrock, but the lack of vertical elevation control for the Sutton Terrace geotechnical borings does allow the possibility that the northern side of the holder may be on bedrock. Gas Holder No. 1 was not founded on bedrock based on borings completed at York Avenue. Bedrock is below the depth of the holder pit foundation. The two gas holders constructed in the 1870s were located within the footprint of Gas Holder No. 2, therefore it is likely that any residual materials associated with those structures were removed during the later construction of the larger holder. No other structures on the gas company property on Blocks 1456 and 1457 were identified as being directly related to gas holder operations except for a skimmer pump house located between Gas Holder No. 2 and 3, shown on the 1943 Con Edison drawing. This skimmer may have been used to remove any accumulations of floating oil on top of the water seal for the gas holders. There are no other features shown for this structure to identify its purpose. A building and storage area were located across York Avenue from Block 1457 (on Block 1475). This building was identified simply as a valve house in the 1907 Sanborn map, and shown in more detail on the 1943 Con Edison site plan where it is labeled as the exhauster house. The building contained a boiler, gas mains and valves, blowers, and other support operations for the distribution gas holders. None of the features of this building indicate the potential for an accumulation of residuals Other Site Uses Following the end of gas storage at the Site in 1948 and subsequent removal of the gas holder superstructures the former gas holder station property was redeveloped. Key milestones in the site redevelopment include the following: The Sutton Terrace Apartment complex was constructed in 1949 through 1950, occupying the entire footprint of the former gas company property on Block A garage and office building was constructed at the southeast corner of Block 1456 ( York Avenue) in A garage and apartment building was constructed at the eastern corner of Block 1456 (440 E. 62 nd Street) in The condominium office building and underground garage at 430 E. 62 nd Street was constructed in The Rockefeller University residential tower and parking garage were constructed on Block 1475 in Since the end of gas holder operations, automobile storage and parking has occurred at all of the modern parcels which make up the former site, except for the Mount Vernon Hotel Museum. Fuel oil tanks are also known to be present at the central Sutton Terrace building, and in the commercial building at York Avenue. It is unknown whether fuel oil is also in use at 440 E. 62 nd Street or the Rockefeller University buildings.
23 Site Ownership The parcels which comprise the site and their owners are as follows: Block 1456, Lot East 61 st Street and East 430 East 62 nd Street: OTIC Professional Con (as provided by OASIS) Block 1456, Lot East 61 st Street: Colonial Dames of America Block 1456, Lot York Avenue: SKI Realty, Inc. (as provided by OASIS) Block 1456, Lot East 62 nd Street: Mariko Egawa Block 1457, Lot East 63 rd Street: Cornell University Block 1475, Lot 5 York Avenue: Rockefeller University An additional parcel was identified by Langan (2002) as part of the former gas holder Site, but was not included in the title search. Historical records do not indicate that this property was used for gas company operations: Block 1456, Lot East 61 st Street/417 East 61 st Street Colonial Dames America Additional information regarding the current and past owners of these properties can be found in the historical report for the site (Langan, 2002). 2.3 Previous Investigations No previous environmental investigations have been performed at the Site. As noted above, geotechnical boring records were found as part of the design drawings for the Sutton Terrace Apartments, and from the records for the FDR Drive reconstruction project. Copies of the Sutton Terrace boring logs are included in Appendix A of this report, and their locations are shown on Figure 3-1. Geotechnical investigations were also performed at York Avenue by RA Consultants and Goldberg-Zoino & Associates Geoal, Inc. (GZA) on behalf of Sloan Kettering in preparation for future construction. Where available and appropriate, the geotechnical boring data are incorporated in this SC Report. RA Consultant data and notes from providing oversight during the GZA field efforts are provided in Appendix A of this report.
24 Investigation Activities The SC investigation activities performed to-date were carried-out in five separate events. These mobilizations were performed as access agreements were obtained for various portions of the Site. The five investigation events included the following: Surface soil samples and one soil boring were performed on August 24, 2004 at the Mount Vernon Hotel Museum property. Surface and subsurface soil samples were collected and analyzed during this event. An attempt at a soil boring was performed in the Rockefeller University parking garage on November 29 and 30, Three groundwater monitoring wells were installed in the public sidewalks at the Site on January 31 through February 17, Groundwater samples were collected in March Soil borings and wells were installed in the portion of the Site occupied by the Sutton Terrace Apartment complex on June 27 through September 2, Soil, groundwater, and soil vapor samples were collected and analyzed during this event. Groundwater samples were also collected in October and November Soil borings were installed in the portion of the Site occupied by York Avenue and in the right-of-way along FDR Drive (completed as a monitoring well), east of the Rockefeller University housing between July and September, Soil, groundwater, sump, and soil vapor samples were collected and analyzed during this event. These activities were performed according to the SC work plan (RETEC, 2004). Tables 3-1 through 3-4 present a list of all of the surface soil, soil boring, and well activities performed todate. Details of work performed are described below. 3.1 Underground Utility Clearance Prior to the initiation of intrusive field work, RETEC (in 2004 and 2005) and (in 2011) contacted Dig Safely New York to arrange for the location and marking of all underground utilities in the vicinity of the soil borings and monitoring well locations. RETEC subcontracted with Enviroprobe Services, Inc. (Enviroprobe) of Westmont New Jersey and subcontracted with Advanced Geophysical Services (AGS) to locate utility lines on private property and to confirm the location of all lines in each work area. Enviroprobe/AGS used ground-penetrating radar (GPR), electromagnetic survey methods, and direct observations of lines (where visible in basements and access points) to scan each area where borings or wells were scheduled for completion. The utility clearance surveys were performed on multiple occasions: August 2004 at the Mount Vernon Hotel Museum; November 2004 inside and outside of the Rockefeller University parking garage; January 2005 at the sidewalk drilling locations for the monitoring wells; June 2005 inside the Sutton Terrace parking lot and basement locations; and July 2005 outside the Rockefeller University parking garage.
25 3-2 July and August 2011 within the commercial building at York Avenue and in the right-of-way along the FDR drive, east of the Rockefeller University housing. As an additional precaution, hand-excavation was performed to 5 feet bgs at each drilling location (see Section 3.4). Note that the results of the utility clearance activities and limitations to Site access resulted in several modifications to the proposed boring locations outlined in the SC Work Plan (RETEC, 2004): SB-9: This boring was moved south to a location on the lower tier of the Sutton Terrace parking garage to avoid a high-traffic area, and to place the boring at the deepest part of the garage. MW-3: This monitoring well was located south of its planned location to avoid blocking an active garage entrance. MW-6: This monitoring well was located slightly north of its planned location. Due to a high density of utilities, this was the only location available in this area. MW-7: High pressure natural gas lines were found to be located beneath the sidewalk and curb area where this monitoring well was to be installed. Other utilities were found beneath this portion of East 62nd Street, such that the closest available location south was too far away from the target property to be useful. Installation of a well within the Rockefeller University garage (such as at SB-6) was also ruled-out, as the floor of the garage was found to be below the water table. Therefore MW-7 was installed in the right-of-way along FDR Drive east of the Rockefeller University housing in Community Air Monitoring The community air monitoring was performed to provide real-time measurements of total volatile organic compounds (VOCs) and particulate (airborne dust) concentrations in air at the downwind perimeter of each designated work area when intrusive investigation activities were in progress. Additionally, site personnel monitored any odors produced during the intrusive activities and carbon monoxide was monitored in the work zone during the indoor portion of the work. The monitoring was designed to provide protection for the residences, businesses, and on-site workers not directly involved with the project, from potential releases of airborne contaminants resulting from the investigation activities. In addition, the monitoring results were used to document that work activities did not spread any encountered contamination off-site through the air. Total VOCs and particulates were monitored continuously with an organic vapor meter equipped with a photo-ionization detector (PID), and dust meter, respectively, located upwind and downwind of each work zone. During indoor work monitoring stations were setup between the work area and the closest receptor. The VOC and particulate levels at each location were recorded every 15 minutes. The PID and dust meter were equipped with data loggers capable of calculating a 15-minute running average of concentrations. Specific action levels for VOCs and particulates are provided in the SC Work Plan (RETEC, 2004). Action levels were reached during the drilling of soil boring SB-8 as the result of outside contractors washing their equipment with kerosene. Work was stopped in the area and fans were used to bring in fresh air prior to the resumption of drilling. No other action levels were reached or exceeded during the SC activities.
26 Surface Soil Sampling A very limited amount of surface soil is present at the Site, due to the large amount of cover by buildings. The only native soils exposed at the Site are found on the grounds of the Mount Vernon Hotel Museum. A total of three surface soil samples (SB-1, SS-2, and SS-3) were collected from the Mount Vernon Hotel Museum property on August 24, 2004 to assess the concentration of constituents of interest (COI). The sample designation, sample rationale, sample depth, and laboratory analyses completed for each surface soil sample are summarized on Table 3-1. The location of each sample is shown on Figure 3-1. All surface soil samples were collected from one-meter square grids. After removing vegetation from the grid, a disposable plastic trowel was used to collect aliquots of soil from the corners and center of the grid. Each aliquot was collected from 0-2 inches bgs. For semi-volatile organic compounds (SVOCs), metals, and polychlorinated biphenyls (PCBs) the aliquots were then combined in a stainless-steel mixing bowl and homogenized prior to placement in clean laboratory-supplied sample jars. For VOCs the aliquots were placed directly into a laboratorysupplied sample jar. All surface soil samples were packed in a cooler with ice, and sent by overnight courier under chainof-custody procedures to Severn Trent Laboratories, Inc. in Pittsburgh, Pennsylvania (STL-Pittsburgh) for the laboratory analyses listed on Table Subsurface Soil Sampling The subsurface soil samples were collected from soil borings or from the hand-dug utility clearance excavations. The selection of soil samples collected for laboratory analysis was based on the visual and olfactory observations and field screening results for total VOCs. Subsurface soil samples were collected and analyzed for the presence of COI and to evaluate their horizontal and vertical extent. The sample designation, sample rationale, sample depth, and laboratory analysis completed for each subsurface soil sample are provided on Table 3-2. The sample locations are shown on Figure 3-1. In general, soil samples were collected based on the following protocol: Overburden Soil Samples: One sample was collected from the most impacted interval based on field observations. A second sample was collected from below the impacted zone, if any, to provide a vertical delineation of the extent of impact at that location. When no impacts were encountered, one sample was collected from the one-foot interval immediately below the water table. Former Gas Holder Structures: Soil samples were collected from within former Gas Holders No. 1, No. 2 and No. 3. One soil sample was collected from the most impacted interval. When no impacts were detected or observed in soil within the remnant structures, one soil sample was collected from the one-foot interval immediately above, or at the base of, the structure. When NAPL was encountered, a representative sample was collected and analyzed for forensic analysis. Soil samples were packed in a cooler with ice, and sent by overnight courier under chain-ofcustody procedures to STL-Pittsburgh (2005 samples) or to Test America in Edison, NJ (2011 samples) for the analyses listed on Table 3-2.
27 Soil Boring Installations All 2005 SC soil borings and wells were installed by DrillTech, Inc. of Ossining, New York (the drilling division of Testwell Laboratories) under contract to RETEC. A total of 5 soil borings were advanced in the subsurface by Aztech Technologies, Inc. of NY (Aztech) using direct push and hollow stem auger methods between July and August 2011 under contract to. DrillTech and Aztech also performed hand-clearing at each boring location for utility clearance. The soil boring locations are shown on Figure 3-1; the locations are color-coded by year of installation. The goal of the drilling program was to investigate Site soils and historic structures for the presence of COI which may be related to the use of the Site as a gas holder station. The drilling methods used during each phase of the SC performed and the results to-date are described below. Mount Vernon Hotel Museum Property Soil boring SB-1 was advanced on August 24, 2004 using a drilling tripod equipped with a gasoline-powered cathead. This boring was advanced by driving a standard two-foot long split spoon sampler with a 130 pound hammer. All of this equipment was hand-carried to the work area, as the only access to this portion of the Site was via a pair of narrow stairways off of the sidewalk. Soil boring SB-1 was advanced from the base of hand clearing (4.5 feet bgs, where a cobble was encountered) to refusal at 7.7 feet bgs. A second attempt at this boring was made at a location 25 feet north. Refusal was reached at this location at 6.1 feet bgs. Pieces of schist were found in the tip of the sampling spoon at both locations, indicating that the borings had reached bedrock. Coring to confirm that in-place bedrock was present was not performed due to the limitations of the drilling equipment which could be used at this location. Rockefeller University Property On November 29 and 30, 2004 soil boring SB-6 was attempted at the lowest level of the underground parking garage. It was unknown, but suspected, that the floor of the garage might be below the water table. As there were no monitoring wells outside the garage which could be used to gauge the water table at that time, it was decided that a small-diameter pilot hole would be drilled through the floor of the garage first, prior to opening a larger hole for hand-clearance and drilling. A small-diameter hole was first drilled through the floor using a hammer drill. This hole was drilled to 11 inches deep, all within concrete. A three-inch diameter hole was then drilled in the floor using a thin-wall coring machine. This was drilled to six inches below the floor surface. This larger hole allowed the hand-drill to reach deeper, with the pilot hole extending ultimately to 22 inches below the slab surface, without reaching the limits of concrete. Based on the thickness of the concrete, it was decided to abandon further drilling attempts until more information could be obtained from the building manager regarding the construction of the garage and the depth of groundwater. Construction drawings which were reviewed indicated that the floor of the garage was designed to be only 1 foot thick, with a polyethylene film below it. However, a note on the construction drawings stated that the basement excavation flooded during construction; therefore, it is likely that the extra concrete encountered was placed as a design modification during construction. Additional information has been requested from Rockefeller
28 3-5 University regarding the construction of the garage, including the boring logs for the pre-design geotechnical soil borings but has not be received to date. Monitoring well MW-7 was placed downgradient of this location to establish groundwater conditions downgradient of this property. Sutton Terrace Basement The subsurface investigation of the Sutton Terrace complex was performed between June 27 and September 2, The site access agreement between Con Edison and Sutton Terrace specified that drilling would not be allowed after Labor Day. Due to difficult site access conditions, subsurface soil conditions, the limitations of the drilling equipment, and a limited time imposed by the site access agreement with the property owner, the entire scope of work specified by the Work Plan was not completed during this mobilization. The SC Work Plan specified that 7 soil borings and 2 monitoring wells were to be installed on the property, which was the location of four of the five gas holders which had been part of the gas holder station. All of the soil borings and wells (SB-7, SB-8, SB-9, SB-10, SB-11, SB-12, SB-13, MW-4 and MW-5) were located inside the underground parking garage and basements of two of the three apartment buildings. Physical access and the types of equipment which could be used at these locations was severely restricted: Overhead height restrictions at all locations precluded the use of truck-mounted drilling equipment or available track-mounted drill rigs. Access to the basement building locations was limited to equipment which would pass through conventional hallways and doors. Internal combustion engines could not be used at most locations due to limited or ineffective exhaust venting options. An attempt was made to use a truck-mounted gasoline-powered direct-push drill rig within the garage, but the building exhaust system could not effectively vent the work areas (the lowest levels of the garage). Electric-powered drilling equipment was therefore used at all locations, supplemented at SB-7 by the use of a gasoline-powered cathead which was vented to an adjacent basement window. Two electric drilling rigs were used to advance the soil borings at the garage and basement locations. The basement locations were advanced using a small rotary drill rig (Minuteman Drill Rig, manufactured by Foremost/Mobile Drilling Company, Inc.) which was bolted to the floor at each drilling location. The Minuteman rig was also used at other locations within the garage as necessary when other drilling equipment was unavailable or under repair. A larger, skid-mounted drill rig (outfitted with steel wheels for mobility within the garage) was also used to advance borings MW-4A, SB-8MW, and SB-10MW. The rig was not generally available during the investigation due to a drive shaft failure which eliminated this rig from service for much of the period of the investigation. Direct-push drilling was also attempted at all locations by the use of an electric jackhammer equipped with a standard 2-inch diameter split-spoon sampler. This drilling method was used when the Minuteman drill rig and the skid rig were not available or were under repair in order to utilize the time allotted under the site access agreement. Power for the electric drill rigs was provided by a small portable 220-volt single-phase generator, and by a larger trailer-mounted 660-volt three-phase generator which was positioned at a central location within the garage where effective venting to the garage system could be performed.
29 3-6 The concrete at borings SB-7, SB-8, SB-9, SB-10, SB-11, SB-12, SB-13, MW-4 and MW-5 was cut using an electric thin-wall coring machine. Following the completion of the utility mark-out, DrillTech used a thin wall coring machine to break through the concrete floor, followed by hand-digging to excavate the soil at each sampling location to a depth of five feet bgs to physically confirm the absence of any utilities. At locations where solid concrete or brick was encountered (SB-7, MW-4 and SB-13) DrillTech was allowed to use an electric jackhammer to break up the obstructions, following a review of the site conditions and approval by Con Edison Construction Management of an amendment to the Health and Safety Plan (HASP). Soil boring SB-7 was advanced using a combination of rotary and percussion drilling techniques. The boring was first cleared for utilities by hand excavation methods. The boring was then advanced by manually hammering a 2 foot split spoon with a 140 pound hammer. The boring was then drilled by 4 1/4 inch hollow stem augers (HSAs) advanced using the Minuteman drill rig until refusal. The HSAs did not advance to the desired depth and were replaced with casing. The casing was advanced by spinning with the Minuteman drill rig. Discrete split spoon samples were taken in 2 foot intervals ahead of the casing. A gas powered cathead was used to lift the 140 pound hammer. Exhaust from the cathead was diverted outside by attaching an exhaust line fitted with a blower motor to the cathead s exhaust. This was accompanied by rigorous air monitoring in the basement area. Soil boring SB-13 was advanced using the thin-wall coring machine. Concrete was encountered from the floor of the basement room to 0.6 feet below floor surface, and again from 2.8 to 6 feet below floor surface. The boring was abandoned at 6 feet below the floor surface as the boring could not be advanced further through the concrete. Sutton Terrace Garage Following hand clearing, soil borings MW-5, SB-11, SB-12 and SB-9 were advanced using an electrical jackhammer attached to a 2 foot split spoon. The spoon was decontaminated between samples following procedures specified in the SCS Work Plans. Soil borings SB-8 and SB-10 were performed using a combination of hand-clearing, jackhammer split spoon advancement, the Minuteman drill rig which spun casing and drove split spoons, and an electrical skid rig which spun casing, drove split spoons, and advanced a rollerbit through brick or stone fill where it caused refusal of the sampling spoon. Coring was also attempted where refusal was met, but the core barrel was unable to be advanced due to the nature of the fill. The borings were advanced with a jackhammer and fitted with a 2 foot split spoon until spoon refusal was met. The Minuteman rig was used to spin 3 inch casing and advance 2 foot split spoons until a bearing failure eliminated this rig from service. The Minuteman rig was replaced with the electrical skid rig. Soil boring MW-4 was installed with an electrical Minuteman using spun casing and coring. Casing was spun to 5 feet below grade where it met refusal in large boulders. A 2 5/8 inch core barrel was advanced to 6.75 feet below grade were it met refusal. The boring was then abandoned and re-attempted at MW-4A.
30 3-7 Soil borings MW-5, SB-11, SB-12 and SB-9 were advanced using an electrical jackhammer attached to a 2 foot split spoon. The spoon was advanced until refusal. This method was used while both the Minuteman and electric skid rig were unavailable due to mechanical failures. The split-spoon samplers were decontaminated between samples following the procedure outlined in SCS Work Plan. Soil was collected continuously from five feet bgs to the final depth of each boring. The upper five feet was logged and sampled during the hand-excavated utility clearance test pits. Soil samples were described and classified using the Unified Soil Classification system (USCS) and the modified Burmeister classification system. In addition, soil samples were screened in the field for VOC head space concentrations. Soil from each split-spoon was placed into plastic storage bags. The soil was allowed to warm, and the inlet probe to the PID was used to pierce the bag and measure total VOC concentration in the bag headspace. The soil descriptions and total VOCs measurements are recorded on the boring logs provided in Appendix A. Note that boring SB-8 and SB-10 were converted into 1-inch diameter monitoring wells and relabeled SB-8MW and SB-10MW, respectively. The original location of MW-4 was abandoned due to refusal. The second location attempted, MW-4A, was also abandoned due to refusal on large boulders. MW-5 was abandoned as insufficient time was available to complete this boring prior to the expiration of the access agreement York Avenue Commercial Building Garage Four soil borings (SB-2 through SB-5) were advanced beneath the Commercial Building Garage by Aztech using direct push drilling and geoprobe sampling methods between July 26 and August 4, Following hand clearing activities, continuous soil samples were collected from 5 ft bgs to depth at each location using a 4-5 ft disposable plastic liner at 4-5 ft intervals. Soils were screened using a PID and were logged by an on-site geologist. The depth of the soil borings ranged from 12 to 29.2 ft bgs. A minimum of one to two soil samples were collected from each boring location for laboratory analysis. Sample collection rationale, and analyses are summarized in Table 3-2. Soil borings in which monitoring wells were not installed, were filled with sand and grouted. Once each boring was complete, all drilling spoils were placed into 55-gallon drums for disposal as described in Section 3.11 of this report. All subsurface drilling equipment was washed with Alconox and water after completing each boring to avoid cross-contamination between boring locations. 3.5 Monitoring Well Installation Monitoring wells were installed in soil borings MW-1, MW-3, MW-6, SB8-MW, SB-10MW, and MW-7. The locations of the wells are shown on Figure 3-1, and the details of the well construction are shown on the boring logs attached in Appendix A. The well locations were selected to provide groundwater flow and quality information for areas hydraulically upgradient, crossgradient, within, and downgradient of potential gas holder source areas. Due to shallow drilling refusal, proposed wells MW-4 and MW-5 were replaced with wells SB-8MW and SB-10MW. All monitoring wells were installed by DrillTech under the direction of RETEC field supervisors or Aztech under the direction of field supervisors.
31 3-8 Sidewalk Monitoring Well Installations Four monitoring wells, one upgradient well and three wells downgradient of gas operation areas, were specified in the Work Plan. The wells were sited for installation on public sidewalks to facilitate obtaining access for drilling, and to allow for the use of truck-mounted drilling equipment. Monitoring wells MW-3 and MW-6 were installed downgradient of the two blocks where the gas holders were located. MW-1 was installed upgradient of the holders. MW-7 was proposed to be installed adjacent to the former service building for the gas holders, adjacent to the Rockefeller University garage. However, a high density of gas lines along the south side of the garage, and of communications cables along the west side, precluded advancing the boring at this location. An attempt was made to relocate the boring and well to the east, outside the building or to the south of the building, but construction activities associated with the FDR Drive work precluded use of this road. Therefore, MW-7 was installed within the right-of-way adjacent to the FDR Drive and east of the Rockefeller University Housing during the 2011 field event. Following the mark-out of underground utility lines, hand clearing to a depth of five feet was performed as described for the soil boring work. Hand clearing at MW-1 found that bedrock was present at 3 feet bgs, therefore hand clearing was terminated at that depth. Monitoring well MW-1 was drilled by a truck mounted drill rig by coring with a NX core barrel. The boring was then reamed out with a roller bit and fit with a 2 inch monitoring well. Soil samples were not collected from this boring due to lack of overburden soil. Monitoring wells MW-3 and MW-6 were installed by advancing 4 ¼ inch ID hollow stem augers to desired depth or refusal. When auger refusal was met, the boring was reamed with a roller bit through the obstruction, and augering was then attempted again. MW-3 was drilled to refusal on weathered bedrock at 47.8 feet bgs. The lower portion of this boring was grouted-up, and a water table well installed. MW-6 could not be advanced to bedrock due to the presence of dense gravel at 23 to 26 feet bgs. The boring was halted at this depth, and backfilled with bentonite to 18 feet bgs, and a water table well installed. Monitoring well MW-7 was drilled in 2011 by Aztech using 4 ¼ inch hollow stem augers and sampled with a geoprobe to the total depth of 25 ft bgs to delineate the vertical extent of the slight sheen and faint tar odors noted from 15 to 25 ft bgs. Based on the interpreted depth of groundwater, the well was screened 9 to 19 ft bgs. The boring was backfilled with bentonite from 19 to 25 ft bgs. Monitoring wells MW-1, MW-3 and MW-6 were constructed using 0.02-inch slotted polyvinyl chloride (PVC) well screens and risers. Monitoring well MW-7 was constructed using 0.01-inch slotted PVC well screen and riser. MW-3 and MW-6 were constructed with a 2-foot sump at the base of the screened sections for the capture of any NAPL which may enter the wells. A sump was not installed in MW-1 as it was an upgradient well and installed completely in bedrock. A locking expandable well cap was installed at the top of each well riser. All four wells were finished by installation of flush-mounted curb boxes set in concrete. Additional concrete was also used to patch the area around each well which was removed for hand-clearing. Sutton Terrace Well Installations Monitoring wells SB8-MW and SB-10-MW were installed by DrillTech by first hand-digging to five feet, then drilling a soil boring using 4¼-inch ID hollow stem augers and 3-inch casing.
32 3-9 Con Edison, RETEC, and NYSDEC agreed that in the absence of observations of free or residual NAPL in the overburden or on the bedrock surface, the installation of sumps into the bedrock would not be warranted. SB-8MW and SB-10MW were constructed of ten and eight feet of one-inch ID, threaded, inch slot PVC well screen, respectively. PVC riser was placed from the top of the well screen to the ground surface. The annular space between the borehole and the wells were backfilled with filter sand to one to two feet above the well screen, followed by one to two feet of bentonite chips above the filter sand, and grout to the surface. Note at a large volume of sand was needed for wells SB-8MW and SB-10MW in order to fill the voids in the coarse fill surrounding the well screens. The surface was completed with a flush-mounted road box in a concrete pad. An expandable plug and lock were placed on the top of the PVC riser to seal and lock the well from surface run-off and tampering Monitoring Well Development Monitoring wells were developed following their installation to remove fine sediments (clays and silts) from within the well, well screen, the sand pack, and the aquifer to promote good hydraulic communication between the well and the formation. Monitoring wells were developed in accordance to the procedures specified in the SC Work Plan (RETEC, 2004). A surge-and-pump method was used to complete the development of MW-1, MW-3, MW-6, MW-7, SB-8MW and SB-10MW to actively surge and agitate the water column by forcing water back and forth through the screen. The water and fine sediments suspended as a result of surging were removed by pumping. Surging and pumping was continued until the well was observed to have clear, low turbidity discharge (less than 50 nephelometric turbidity units [NTU]), and ph, temperature and specific conductivity had stabilized. Due to the small diameter of wells SB-8MW and SB10MW, the wells were developed with a peristaltic pump. Well MW-1 was pumped dry, allowed to recharge, and pumped dry again. Monitoring well MW-7 was developed until turbidity readings reached 95 NTU and 7.7 well volumes were removed. Well development equipment was decontaminated after use in accordance with field procedures. Well development water was contained in 55-gallon drums for off-site disposal (see Section 3.11 for investigation derived waste (IDW) details). 3.6 Groundwater Sampling Depth to Groundwater Measurements Prior to collecting groundwater samples in October 2005, the depths to top of groundwater and well bottom and the thickness of NAPL (if present) were measured in each well. Synoptic water level measurements were collected on November 8, 2011 from monitoring wells MW-1, MW-3, MW-6, and MW-7. Access to monitoring wells SB-8MW and SB-10MW was not available on November 8, Depths were measured to the nearest 0.01-foot using an electronic oil/water interface probe. The probe was thoroughly washed with Alconox, and water to prevent crosscontamination between wells Groundwater Sample Collection Three rounds of groundwater samples were collected. Samples were collected via low flow methods except for monitoring well MW-1 which was sampled via bailer due to a slow rate of recharge which precluded low-flow purging and sampling. The first round of groundwater sampling consisted of sampling monitoring wells MW-1, MW-3 and MW-6 in March The second round of sampling included MW-1, MW-3, MW-6, SB-8MW and SB-10MW in September and October The third round of groundwater sampling consisted of sampling monitoring well MW-7 (September 7, 2011), obtaining a groundwater grab sample from SB-5 (August 5,
33 ), and collecting a sample from the sump in the basement of the commercial building at York Avenue (August 17, 2011). With the exception of monitoring well MW-1, the monitoring wells were purged prior to sampling using sampling procedures and protocol described in United States al Protection Agency s (USEPA s) current editions of the Practical Guide for Ground-Water Sampling and RCRA Ground-Water Monitoring Enforcement Guidance. In brief, these procedures specify purging at a rate of 80 to 300 milliliters per minute using new Teflon-lined polyethylene tubing, and monitoring water quality parameters until stabilization, followed by sample collection. Purging was performed with a peristaltic pump. During purging, water quality criteria, including temperature, specific conductance, ph, dissolved oxygen, oxidation/reduction potential (ORP), and turbidity were measured and recorded every five minutes. With the exception of turbidity, these parameters were measured with Horiba U-22 multi-parameter water quality meter attached to a flow-through cell connected to the peristaltic pump discharge tubing. Turbidity was measured with a Lamott 2020 turbidimeter. Groundwater samples were collected after the water quality parameters stabilized or the well ran dry. The data obtained during purging and sampling were recorded on the groundwater sampling forms, which are included in Appendix B. Due to the low hydraulic conductivity of the rock at well MW-1, a grab sample was collected from the well at the start of the purging procedures described above. The well was then purged dry. The well did not recharge prior to the end of the day, therefore only this initial sample was submitted to the laboratory for analysis, and not all analyses could be performed. A second sample would have been collected if sufficient water had collected in the well by the end of the day to fill the required sample containers. Purge parameters are not available for MW-1 and the sample was analyzed for the same parameters as the other samples except for metals and available cyanide. On August 5, 2011 a groundwater grab sample was collected from SB-5 within the footprint of former Gas Holder No. 1. The sample was collected between 20 and 29 ft bgs by pumping through a temporary PVC riser and screen using a peristaltic pump. On August 17, 2011, a sump sample was collected from the basement of York Avenue. The sample was collected by bailer. The 2005 groundwater samples were packed in a cooler with ice, and sent by overnight courier under proper chain-of-custody procedures to STL-Pittsburgh and the 2011 groundwater samples were sent to Test America in Edison, NJ for the analyses listed on Table Hydraulic Conductivity Testing In-situ hydraulic conductivity testing was performed in monitoring wells MW-3 and MW-6 using the volume displacement or slug method. Hydraulic conductivity testing was not performed in monitoring well SB-8MW or SB-10MW because the slug test equipment could not fit down the 1- inch ID well. A slug test was not performed in monitoring well MW-1 because it is a bedrock well. The objective of the slug tests was to assess the horizontal hydraulic conductivity (K) of the water table aquifer underlying the Site. Prior to the start of each slug test, the static water level was measured in each well to the nearest 0.01-foot. Then an In-Situ Mini-Troll pressure transducer, equipped with a data logger, was placed in the well to 6 inches above the bottom of the well, and the water level allowed to stabilize to the measured static elevation. The first test performed was
34 3-11 a falling head test. A 3/4-inch diameter by 5-foot long steel slug (capped at the ends) was quickly and smoothly lowered into the well such that the top of the slug was several inches below the static water table elevation. If less than 5 feet of water column was present in the well, the bottom of the slug was lowered to the top of the Mini-Troll. The water level was recorded by the Mini-Troll until groundwater returned to the static elevation. The second test performed was a rising head test. The test was performed by swiftly removing the slug from the well, and again recording the water level until groundwater levels returned to within 10% of the static elevation. Following the completion of each test, the slug test data recorded by the data logger was downloaded onto a computer. The data were analyzed using the Bower and Rice method of analysis for unconfined aquifers using the AQTESOLV modeling program (HydroSolve, 1998). AQTESOLV is an interactive model for aquifer analysis that is widely used for the application of the Bower and Rice method of analysis. The rising head test was used as the primary measure of the hydraulic conductivity in the water table at the location of each well tested. Falling head tests are typically not as accurate as rising head tests for unconfined water table wells, such as the ones present at the Site. The falling head tests were only used for comparison to the rising head tests. The data and output from the AQTESOLV program for monitoring well MW-3 are included as Appendix C. The field results for MW-6 are not included as the data were found to be not usable. 3.8 Soil Gas Sampling Two soil gas samples were obtained from the Sutton Terrace Apartment complex. Sample SB-13 was obtained on July 7, 2005, prior to the start of the soil boring at this location. Sample SB-7 was obtained on July 20, 2005 from the basement room following completion of the soil boring at this location. Note that sample SB-7 was obtained from a location where the floor of the building was not underlain by a void space. The locations of these sampling points are shown on Figure 3-1. One soil vapor sample (SV-1) was collected below the slab at the York Avenue property, as shown on Figure 3-1. This sample was collected after the third party and SC borings were drilled and grouted and equilibrium conditions were re-established. During the 2005 SC, temporary sub-slab soil gas sampling points were installed by drilling a ¾- inch diameter hole through the concrete slab with a rotary hammer. Polyethylene tubing was placed through the hole and advanced into the underlying void space. The top of the hole was then sealed with hydrated bentonite to prevent indoor air from mixing with the soil gas. During the 2011 SC, a sampling implant was installed to a depth just below the concrete slab by coring a six inch hole through the surface slab and overburden, and placing Teflon tubing and aluminum tip in the hole. Filter sand was placed in the annular space, and an air-tight seal was created by filling the space between the tubing and the concrete with hydrated bentonite. The tubing used for sampling was attached to a sampling canister with Swagelok fittings. A helium-filled shroud was placed around the insertion point to confirm the integrity of the seal. One to three volumes of air was then purged with a SKG portable air pump at a rate less than 0.2 liters per minute. During sampling activities, no helium was detected indicating that no leaks were found in the seal for this location. Once the seal was checked, the sample was collected in an individually certified, 6-liter Summa canister fitted with an eight-hour regulator. Following sample collection, the concrete coring hole was sealed and patched to match the existing grade. No ambient air samples were collected at a location upwind of the area at the time of sampling. No indoor air samples were collected during the SC activities.
35 3-12 The sub-slab soil gas samples were analyzed for VOCs by EPA Method TO-15, with a special list of compounds added to aid in indicating potential manufactured gas or other sources. 3.9 Site Survey The 2005 SC monitoring well, soil boring, and surface soil sampling locations and ground surface elevations were surveyed by Chazen Engineering & Land Surveying Co., P.C. (Chazen). Chazen also surveyed the location and elevation of all Site features. The horizontal coordinates were tied into the North American Datum of 1983 (NAD83 New York State Plane 3101) and the elevations were tied into the North American Vertical Datum of 1988 (NAVD88). The purpose of the survey was to create a base map that accurately shows the locations of all investigation sample locations and key physical features of the Site (e.g., building corners, fences, sidewalks, curbs, driveways, and utilities) that were within the property boundary of the former gasholders and in the nearby offsite area. The 2011 SC investigation locations were surveyed by C.T. Male Associates, Inc. of NY (September 2011) using the same coordinate system. All Site figures presented in this document were developed using the survey results Site Restoration Following the completion of subsurface sampling all drilling locations were restored to presampling conditions. Drilling at the Mount Vernon Hotel Museum was performed in areas covered by bark mulch, therefore, site restoration consisted of redistributing the mulch to recover the work area. Sidewalk drilling locations were restored by patching the concrete slabs at MW-1 and MW-3, and by replacement of slabs cut during drilling at MW-6. Concrete floor slabs within the Sutton Terrace garage were repaired by trimming the holes in the floor to form rectangular openings, installation of reinforcing bolts into the openings, and patching with concrete. MW-7 was completed with a flush-mounted curb box in concrete within the paved right-of-way of the FDR Drive. All 2011 SC borings and two of the GZA borings at York Avenue were grouted to the floor surfaces Investigation Residual Management All drill cuttings, decontamination water, concrete, monitoring well purge water, soiled towels, plastic, and used personal protective equipment (PPE) generated during the 2005 SC field activities were placed in 55-gallon drums segregated by media, and transported off Site by Clean Venture/Cyclechem or Clean Earth of North Jersey, Inc.Drums were collected at the conclusion of each day of work. Clean Earth or Cyclechem clearly labeled the drums with the media, the date, source, and contact information. Proper manifest protocols were followed. Representative samples of soil and water drums were collected and analyzed along with the environmental samples for waste characterization and for the creation of waste profiles for each work area. All 2011 IDW generated was placed in drums and properly labeled. One water sample and one soil sample were collected during the investigation and analyzed for Resource Conservation and Recovery Act (RCRA) Hazardous Characteristics testing to determine if materials exhibiting hazardous characteristics may be present at the Site and to support waste disposal profiling purposes. All 2011 IDW was transported off site by Clean Earth of North Jersey, Inc. to a Con Edison-approved permitted disposal facility.
36 Field Investigation Results This section presents a description of the Site conditions observed during the field investigations to date. 4.1 Site Geology Information concerning the Site stratigraphy was obtained from the soil collected from the investigation soil borings and hand excavations, and from geotechnical construction borings for the Sutton Terrace and York Avenue buildings. This information was used to generate cross sections of the Site stratigraphy. The cross section locations are shown on Figure 4-1, and the cross sections are provided on Figure 4-2 (A-A ) and Figure 4-3 (B-B ). A bedrock surface elevation contour map is provided as Figure 4-4. This figure is based on the SC field investigation, the Sutton Terrace geotechnical borings, boring logs from the FDR Drive corridor, and geotechnical borings from York Avenue. The Site geology consists of three unconsolidated soil units varying widely in thickness and distribution across the Site overlying the bedrock surface. The bedrock surface ranges from at or just below the ground surface at the western side of the Site, to 60 feet bgs beneath Gas Holder No. 2 to approximately 42 feet bgs at the eastern side of the Site along the west side of York Avenue near E 61 st Street. At some locations the native soils have been completely removed and replaced with fill material. The following is a description of each soil unit and the bedrock. Based on the measurements of the bedrock elevations at the Site made during the SC, and boring logs obtained from the field office for the FDR Drive reconstruction project, it appears that the Site is located over a bedrock trough. This trough is centered between East 63 rd and East 62 nd Street in the Site vicinity Fill Unit Fill is present across nearly the entire Site except for the grounds of the Mount Vernon Hotel Museum. At the Sutton Terrace property, boring SB-7 found brick and sand fill from the bottom of the apartment building to the base of the foundation of former Gas Holder No. 3. Other borings advanced within this gas holder found sand, brick, and stone fill. Gas Holder No. 2 was found to be filled predominantly with sand, with minor amounts of silt, gravel, brick, and stone. Borings advanced between these two holders encountered similar materials to the maximum depth penetrated (12 feet below the lowest level of the garage). The depth of fill along York Avenue was found to range from 11 feet bgs at MW-3 to 5 feet bgs at MW-6. It is anticipated that a thick zone of fill is present on the east side of York Avenue as a result of historic shoreline filling and construction activities. However, the boring log for MW-7 along the west side of FDR drive indicates fill is only 5 feet thick underlain by sand, which could possibly represent historic fill used to build more land area adjacent to the East River Sand Unit Beneath the fill unit and the foundations for Gas Holders No. 1, 2 and 3 is a sand unit, consisting of brown and gray, medium to fine sand with little to trace amounts of gravel. This unit was found to
37 4-2 extend to bedrock beneath the central portion of the Sutton Terrace property, from beneath Gas Holder No. 3, to an elevation of -37 NAVD88 (approximately 60 feet bgs) beneath Gas Holder No. 2. This unit was found to be present at shallower depths along York Avenue, extending from 5 to 23 feet bgs at MW-6. A similar unit was also observed at MW-3, but at a greater depth (25-42 feet bgs) Gravel and Sand Unit A unit consisting of gravel with varying amounts of sand was found under the eastern portion of the Sutton Terrace property. This unit appears to be coarsest at MW-6 along York Avenue, with finer-grained materials near its base beneath the center of Gas Holder No Mixed Coarse-grained Unit The gravel unit was found to be underlain by a mixed unit consisting of sand, gravel, and boulders. This unit was observed to be 4 to 6 feet thick in the Sutton Terrace geotechnical borings, and to be deposited directly on the bedrock. This unit was only observed along the eastern portion of Gas Holder No Bedrock Bedrock was observed to be present from the ground surface at the west side of the Mount Vernon Hotel Museum property, to a depth of 47.5 feet bgs at MW-3 along the west side of York Avenue. Boring logs from the FDR Drive reconstruction project show bedrock to be as deep as -95 feet NAVD (approximately 85 feet bgs) along the edge of the East River. As shown on Figures 4-2, 4-3, and 4-4, the bedrock surface dips steeply to the east. 4.2 Site Hydrogeology Six monitoring wells were installed to obtain information regarding the Site hydrogeology. Groundwater was encountered beneath the Site in the overburden at depths ranging from 6.2 to 15.7 feet bgs in October 2005 and 9.22 to 16.9 ft bgs in November Table 3-3 summarizes groundwater elevations measured in each well on October 8, 2005 and November 8, Figure 4-5 provides an overburden groundwater elevation contour map for October The map shows that the groundwater flow direction is generally from the west to east towards the East River, in accordance with the presumed groundwater flow direction based on local topography. Note that Figure 4-5 assumes that the water at SB-8MW and SB-10MW is in hydraulic communication with groundwater outside of the former gas holder foundations. The November 8, 2011 overburden groundwater elevations were not contoured since only three data points were available based on limited access to the monitoring wells. Depth to groundwater in the bedrock at monitoring well MW-1 was measured to be approximately 16.4 ft below the top of casing on October 8, 2005 and ft below the top of casing on November 8, Hydraulic Conductivity Testing Results Hydraulic conductivity is a measure of the ability water to flow through the matrix that comprises an aquifer. Based on the rising head test data, the geometric mean for the horizontal hydraulic conductivity (K) value for well MW-3, which is screened in a coarse lithologic unit (loose medium sand with little to trace amounts of fine sand) was 2.58 x 10⁻⁴ feet per second (or 22 feet per day). This value is consistent with the soil type observed in the soil boring. The data for the falling head test are not as reliable, but the calculated permeability of 1.79 x 10⁻⁴ feet per second (or 15 feet per day) is consistent with the results of the rising head test. The data from MW-6 were determined not usable.
38 Source Area Investigation Observations The remainder of this section discusses the observations and findings during the field investigation at structures or other areas of interest associated with the former gas holder station Gas Holders A total of 15 soil borings were advanced in or adjacent to the footprints of all five former gas holders at the Site. The field observations related to these structures are summarized below: No field indications of impact to soil or groundwater downgradient of the gas holder properties were observed in the borings for MW-3 and MW-6 at any depth. A heavy hydrocarbon material was observed in the bottom foot of boring SB-7 (27-28 feet bgs). No indications of this material were observed in the fill above the base of this boring except for slight hydrocarbon odors and elevated soil PID measurements at and below the water table (below 24 feet bgs). Boring SB-08MW was believed to have reached the same depth as SB-7, but did not show similar impacts. Both borings are believed to have been advanced inside of Gas Holder No. 3. No field indications of impact to soil or groundwater within or downgradient of Gas Holder No.1 were observed in SC borings SB-2, SB-3, SB-4, and SB-5. Several geotechnical borings were drilled by RA Consultants and GZA at the locations illustrated on Figure 3-1. No field indications to soil or groundwater were noted in the field logs or notes for these borings. Varying degrees of hydrocarbon impact were observed in soil and water at isolated locations, including: MW-4A strong hydrocarbon odors and staining associated with soil and wood encountered in the hand-clearing excavation. A similar material was encountered in a narrow zone in SB-10MW at 3 feet bgs. MW-5, MW-8MW, SB-9, SB-10MW, SB-11, and SB-12 Slight hydrocarbon odors and elevated soil headspace PID measurements were observed at these locations, typically at or below the water table. Small blebs of hydrocarbon-like material were also observed in the water encountered at SB-12. A slight sheen was observed between 10 and 15 ft bgs and a faint tar like odor was noted between 10 and 20 ft bgs in the boring drilled for MW-7, downgradient of the former Site along FDR Drive. Forensic analysis was performed on soil samples from SB-7 and MW-4A, and on a sample of wood from MW-4A, however the results of this analysis was inconclusive Other Potential Sources During the SC activities, several potential sources of Site contamination were observed or identified from historical sources: The fill used in Gas Holders No. 2 and 3 was placed by the developer of the Sutton Terrace Apartment complex after the site was decommissioned by Con Edison. The origin of this fill is unknown.
39 4-4 The Sutton Terrace parking garage has been in operation since approximately Given the historical use for car parking, the potential exists for impact to soil or groundwater from any discharge of automotive fuel or oil which may leak through the lower floors of the garage or from any leaks in the stormwater collection system. Three 15,000 gallon fuel oil tanks are located in the basement of the central Sutton Terrace building, at the northwest side near 63 rd Street. The NYSDEC records indicate that a No. 6 fuel oil release due to an overfill occurred on December 26, The spill report, located in Appendix D, states that this release was remediated. Petroleum impacts to soil or groundwater may be present from upgradient sources associated with current buildings, or former buildings which were demolished at the northwest side of the Sutton Terrace property. A 10,000 gallon No. 2 fuel oil underground storage tank (UST) is located at York Ave. NYSDEC records indicate that the tank and surrounding soils were investigated and that low levels of SVOCs were detected in the shallow samples and were believed to be a result of the fill material at the Site and not from the UST. No VOCs or SVOCs were detected in the groundwater sample collected. Low level soil impacts include PAHs which are typical at former MGPs. NYSDEC closed the spill report associated with this tank and recommended no further investigation. A memo summarizing the spill reports is included in Appendix D. Automobiles are parked on the Site so the potential exists for impact to soil or groundwater from any discharge of automotive fuel or oil which may leak through the lower floors of the garage or from any leaks in the stormwater collection system. A gasoline station is present to the east across York Avenue.
40 Analytical Results This section presents and describes the analytical results for the soil, groundwater, and soil vapor samples collected during the SC. The laboratory analytical reports are presented in Appendix F. Included in this section is a comparison of the data to applicable NYSDEC guidance values or standards. The discussions are presented by environmental media in the following sections. 5.1 Analytical Program Chemical Analyses The soil and water samples collected during the 2005 SC were analyzed by STL-Pittsburgh and the soil and groundwater samples collected during the 2011 SC were analyzed by Test America according to the following methods: Target Compound List Volatile Organic Compounds by USEPA SW-846 Method 8260B; Target Compound List Semi-volatile Organic Compounds (SVOCs) by USEPA SW-846 Method 8260C; Target Analyte List Metals by USEPA SW-846 Method 6010B and 7471A; Total Cyanide by USEPA SW-846 Method 9012A; Available Cyanide by USEPA MCAWW 1677; and Polychlorinated biphenyls by USEPA SW-846 Method Two subsurface soil samples and one wood sample were also submitted to Meta al, Inc. of Watertown, Massachusetts for forensic analysis. The results reported by Meta and by STL- Pittsburgh for these samples were also reviewed by Dr. Steven Hawthorne (Hawthorne Consulting, Grand Forks, North Dakota) Quality Control To meet the data quality objectives for the SC, which are defined in the Section 3 of the Quality Assurance Project Plan (QAPP) found in the project Work Plan [RETEC, 2004], NYSDEC Analytical Service Protocols (ASP) were used and all results were reported in Category B deliverables. These analyses were completed by STL-Pittsburgh and Test America in Edison, NJ. STL-Pittsburgh and Test America are current participants in the New York State Department of Health (NYSDOH) al Accreditation Program (ELAP) and have current CLP certification for all analyte categories. Quality assurance / quality control (QA/QC) samples collected in the field consisted of field duplicates, matrix spikes (MS), matrix spike duplicates (MSD), and trip blanks. Sample SB- 08MW-DUP is a duplicate of groundwater sample SB-8MW. Due to poor split-spoon recoveries, insufficient soil was available to submit a field duplicate for soil. QA/QC analytical results are included on the analytical summary tables and the analytical reports.
41 5-2 The data packages were reviewed by a RETEC/ chemist, who prepared DUSRs. The reports are included with the analytical reports in Appendix F. As part of the data review process, the analytical results were qualified, as appropriate, in accordance with the data review protocols. The data summary tables included in this report reflect the findings of the DUSRs. 5.2 Surface Soil Results The surface soil samples collected and analyses completed during the SC are summarized in Table 3-1. VOCs, SVOCs, metals, total and available cyanide, and PCBs analytical results for surface soil are summarized on Table 5-1. Table 5-1 includes only analytes that were detected in at least one sample. Full surface soil analytical results are provided in Table F-1 in Appendix F. As described below, the surface soil analytical results are compared to the NYSDEC Part Restricted Use Residential and Commercial Soil Cleanup Objectives (SCOs) as referenced in the Technical Guidance for Site Investigation and Remediation, DER-10 (May, 2010). A summary of the surface soil analytical results that exceed these SCOs is illustrated on Figure Surface Soil VOC Results No benzene, toluene, ethylbenzene, and xylene (BTEX) compounds were detected in the surface soil samples. VOCs were not at detectable levels in the three surface soil samples Surface Soil SVOC Results A total of 17 PAHs were found in one or more surface soil samples. A total of 24 SVOCs were detected in surface soil samples. Of the SVOCs, 20 were PAHs. One surface soil sample, SS- 03, contained individual PAH compounds in exceedance of their SCOs. Concentrations of total PAHs ranged from 2.52 mg/kg (SS-02) to mg/kg (SS-03). In addition to the PAHs, five other SVOCs were also detected in the surface soil samples. Three of these compounds were phthalates, which are commonly associated with the plastic and rubber materials used in sampling and analysis of soils. The other two compounds were detected below their quantitation limits Surface Soil PCB Results A single PCB compound, Aroclor 1260, was detected in all three of the surface soil samples. Concentrations of Aroclor 1260 ranged from mg/kg at SS-02 to mg/kg at SS-03. None of the concentrations of PCBs were above the SCO for total PCBs in surface soil of 1.0 mg/kg Surface Soil Metals Results As shown on Table 5-1, a total of 23 metals were detected in surface soil samples. Four of these were detected at concentrations that exceeded their respective SCOs cited in Part Restricted Residential and Commercial use categories. The four metals included arsenic, cadmium, lead, and mercury Surface Soil Cyanide Results Total cyanide was detected in one of the three surface soil samples. The concentration of total cyanide was 1.0 mg/kg at SS-03 which is below the Part Restricted Residential and Commercial SCOs of 27 mg/kg. Available cyanide was detected in two of the three samples.
42 5-3 Available cyanide concentrations were 0.13 mg/kg at SB-1 and 0.12 mg/kg at SS-03. Part does not currently list a SCO for available cyanide; however, these concentrations of available cyanide are well below typical risk-based screening levels. 5.3 Subsurface Soil A list of all the subsurface soil samples collected during the SC, and the analyses completed, is provided on Table 3-2. VOCs, SVOCs, metals, total and available cyanide, and PCBs results for subsurface soil are summarized on Table 5-2. Table 5-2 includes only analytes that were detected in at least one sample. Full subsurface soil analytical results are provided in Table F-2 in Appendix F. The evaluation of the subsurface soil results is based on a comparison to the Restricted Residential and Commercial Use SCOs listed in Part A summary of the VOC, SVOC, and PCB subsurface soil analytical results that exceed the NYSDEC Part Restricted Residential and Commercial SCOs is illustrated on Figure 5-2. A summary of the metal and cyanide soil analytical results that exceed the same SCOs is illustrated on Figure Subsurface Soil VOC Results One or more of the BTEX compounds were detected in seven of the 20 subsurface soil samples collected during the SC (Table 5-2). Concentrations of total BTEX compounds ranged from below the detection limits to 49.2 mg/kg at SB-11( ). The detections of BTEX occurred in the overburden at MW-4A, SB-4, and SB-7, and in the saturated zone at SB-11, SB-12, and MW-3. The only exceedance of the Part Restricted Residential and Commercial SCOs was benzene which exceeded the residential SCO in sample SB-11( ) at a concentration of 5.9 mg/kg. Other VOCs detected in subsurface soil samples collected at the York Avenue Holder Site sample locations consisted of acetone, 2-butanone, chloroethane, cyclohexane, isopropylbenzene, methyl tertiary butyl ether, methylcyclohexane, and methylene chloride. These compounds are not typically associated with manufactured gas residuals and some are common laboratory contaminants. MTBE, a gasoline additive, was only detected in the ft bgs sample collected at MW-7. None of these compounds were detected above the Restricted Residential or Commercial SCOs Subsurface Soil SVOC Results One or more of the PAH compounds were detected in 18 of the 20 subsurface soil samples analyzed during the SC (Table 5-2). Total PAH concentrations ranged from below the detection limit to mg/kg at SB-11( ). Eight of the 18 soil samples in which PAHs were detected contained PAH concentrations above the Part Restricted Residential and/or Commercial SCOs. Other SVOCs detected in subsurface soil consist of acetophenone, 1,1 -biphenyl, bis(2-ethylhexyl) phthalate, butyl benzyl phthalate, carbazole, dibenzofuran, isophorone, and phenol. The phthalate compounds are not associated with manufactured gas residuals and are typically found during investigations associated with plastic sampling equipment or nitrile gloves. Carbazole was detected at SB-2 (5-7), SB-3 (11-13), SB-5 ( ), MW-7 (15-20), SB-8MW (5-7), SB-7 (2-2.6), SB-11 ( ), and SB-12 (5-7) in association with other PAHs. Part does not cite a recommended soil cleanup objective for carbazole. Isophorone was detected in one sample (SB-5[ ]) and phenol was detected in one sample (SB-2[5-7]). None of these SVOC compounds exceeded the Restricted Residential or Commercial SCOs.
43 Subsurface Soil PCB Results The results of subsurface soil PCB results are presented on Table 5-2. Note that due to poor soil sample recoveries and limited soil volumes PCB analysis was not performed at all sampling locations. PCBs were reported as below the detection limits in all but one of the 16 subsurface soil samples which were analyzed. Aroclor 1260 was detected at an estimated concentration of 0.33 mg/kg in the sample collected from SB-3(11-13) which is below the Restricted Residential and Commercial SCOs of 1 mg/kg for total PCBs Subsurface Soil Metals Results As shown in Table 5-2, all 23 metals were detected in subsurface soil samples. Six of these were detected at concentrations that exceeded their respective Part Restricted Residential and/or Commercial SCOs. The six metals included arsenic, barium, cadmium, copper, lead, and, mercury. Six of the 18 subsurface soil samples contained one or more of these six metals at concentrations exceeding one or both of the SCOs. Samples collected from MW-4A(2), SB-7(22-30), and SB8(5-7) each contained one metal at a concentration exceeding one or both of the SCOs. Two samples, collected from SB-7(2-2.6) and SB-11( ) contained three metals at concentrations exceeding one or both of the SCOs. Only one sample contained as many as five metals at concentrations exceeding one or both of the SCOs Subsurface Soil Cyanide Results Cyanide (either total or available) was detected in nine of the 20 subsurface soil samples analyzed, with the detections at three of the locations reported as estimated values below the method quantitation limit. Concentrations of total cyanide ranged from below the detection limit to 69.6 mg/kg at MW-4A. Available cyanide was detected in five of the 20 the subsurface soil samples at concentrations ranging from mg/kg at SB-7 (2-2.6) to 0.54 mg/kg at MW-4A. At one location, SB-7 (2-2.6), available cyanide concentrations were detected while total cyanide appeared to be absent. The paradox is the result of the analytical method detection limit for total cyanide (0.54 mg/kg) being an order of magnitude higher than the analytical detection limit for available cyanide (0.054 mg/kg). Part lists a SCO for total cyanide for both Restricted Residential and Commercial of 27 mg/kg. Only two samples contained a concentration of cyanide exceeding the SCO; MW-4A at 69.6 mg/kg and SB-3 at 36.9 mg/kg. Part does not currently list a SCO for available cyanide. 5.4 Groundwater Results Table 3-4 provides a list of the groundwater samples collected and the analyses performed during the SC. The groundwater purging field parameters and results are provided on Table 5-3. Note that the groundwater sample from monitoring well MW-1 was collected without purging due to an extremely slow recovery rate, which is related to poor hydraulic conductivity of the bedrock aquifer at this location. The results of testing for VOCs, SVOCs, metals, and total and available cyanide in groundwater are summarized on Table 5-4. Table 5-4 includes only analytes that were detected in at least one sample. Full groundwater analytical results are provided in Table F-3 in Appendix F. The following sections discuss the groundwater analytical results based on a comparison to either guidance values or standards listed in NYSDEC Division of Water Technical and Operational Guidance Series (TOGS) (1.1.1) 6 NYCRR [NYSDEC, 1998]. A summary of the groundwater VOC, SVOC, and PCB analytical results that exceed the standards or guidance criteria is illustrated on Figure 5-4. A summary of the groundwater metal and cyanide analytical results that exceed these values is illustrated on Figure 5-5.
44 Groundwater VOC Results Detections of VOC compounds above the guidance or standard values were limited to the BTEX compounds, 1,1,2-trichloroethane, 2-butanone, acetone, bromodichloromethane, carbon disulfide, chloroform, isopropylbenzene, methyl tertiary butyl ether (MTBE), methylene chloride, styrene, and tetrachloroethene. Benzene was detected above the standard values in each monitoring well except for MW-1. Benzene was not detected in the sample collected from the sump in the basement of York Avenue. SB-8MW is the only well with concentrations of ethylbenzene, toluene, and xylenes greater than the standard values. Isopropylbenzene was detected above the standard value in the groundwater samples collected from SB-8MW. 2-butanone was detected above the standard value in MW-6 in the second round of sampling. Chloroform was detected above the standard value at monitoring well MW-1 and MW-6 in the first round, but not in the second round of sampling. 1,1,2-trichloroethane was detected above the standard value in the sample collected during the first round from SB-8MW. These compounds are not considered to be related to gas operations. The detections of methylene chloride were identified as laboratory contaminants. Other VOCs detected in groundwater at one or more wells consisted of low concentrations (well below the standard or guidance values) of acetone, bromodichloromethane, methyl acetate, and tetrachloroethene.. None of these compounds are associated with gas operations. MTBE, an additive in gasoline, was detected at MW-1, MW-3, MW-7, and SB-10MW. The concentration of MTBE detected in the sample collected from MW-1 exceeded the standard Groundwater SVOC Results PAHs were detected in samples from MW-3, MW-6, MW-7, and SB-8MW. The total PAHs reported for MW-3 and MW-6 were estimated values for 2-methylnaphthale and naphthalene during the March 3, 2005 sampling event. No PAHs were detected in these wells in samples from the November 1, 2005 sampling event. PAHs detected in the groundwater sample collected from MW-7 in September 2011 included estimated concentrations of benzo(a)anthracene, benzo(a)pyrene, and benzo(b)flouranthene; the concentrations of all but benzo(a)pyrene exceeded the standard. Total PAHs in SB-8MW were measured to be 289 and 345 ug/l in the September and October 2005 sampling events, respectively. The total PAH concentration was predominantly due to the presence of naphthalene, reported at 240 and 340 ug/l in these two sampling events. Naphthalene, benzo(a)antrhacene, and benzo(b)fluoranthene were the only PAH compounds to exceed the NYSDEC groundwater guidance or standard value. Fourteen other SVOC compounds were detected in the groundwater samples. Of these 14, only phenol and a phthalate compound exceeded the groundwater standard or guidance values. Phenol was detected in MW-3 during both sampling events at concentrations of 14 and 100 ug/l, and in SB- 8MW at a concentration below the method quantitation limit in one sampling event and at an estimated concentration of 5.4 ug/l in the second sampling event. An estimated value 6.1 ug/l of bis(2-ethylhexyl)phthalate at SB-10MW slightly exceeded the groundwater standard value of 5 ug/l Groundwater PCB Results PCBs were not detected in any of the groundwater samples obtained from the Site during this investigation to date.
45 Groundwater Metals Results All but one of the 23 metals analyzed for in groundwater were detected in one or more samples. Cadmium was the only metal which was not detected during any of the sampling events. Several other metals (antimony, arsenic, beryllium, selenium, and thallium) were limited to only one to three detections in the water samples obtained to-date. Eleven of the metals exceeded the NYSDEC groundwater standard or guidance values in one or more samples. These metals include antimony, beryllium, chromium, copper, iron, lead, magnesium, manganese, sodium, thallium, and zinc Groundwater Cyanide Results Total cyanide concentrations were detected in four of the six wells (MW-6, MW-7, SB-8MW, and SB-10MW) and in the groundwater grab sample collected from SB-5. Concentrations were greatest at SB-8MW (902 to 1,050 ug/l). The concentration downgradient at SB-10MW was measured as 127 ug/l. Further downgradient at MW-6, an estimated concentration of 7 ug/l was measured during the March 3, 2005 sampling event. Further downgradient at MW-7, an estimated concentration of 6.3 ug/l was measured during the September 7, 2011 sampling event. Only the samples from SB-8MW exceed the NYSDEC groundwater standard of 200 ug/l. Available cyanide was detected at MW-6, SB-8MW, and in the groundwater grab sample from SB-5. At SB-8MW concentrations ranged from 6 to 9 ug/l. At MW-6 an estimated concentration of 1.7 ug/l was detected. In the groundwater grab sample collected from SB-5, a concentration of 0.05 ug/l was detected. No standard for available cyanide has been established. 5.5 Soil Gas Sampling Results The sub-slab soil gas samples were analyzed for VOCs by EPA Method TO-15, with specific compounds added to aid in determining whether MGP residuals are likely to be a contributing source. The results of the analyses are presented in Table 5-5. Each of the samples contained low levels of VOCs. Eleven constituents were detected in sample SB-13 at levels ranging from 0.9 to 78 ug/m 3. Similar results were obtained in sample SB-7, i.e. 15 constituents detected at levels ranging from 0.8 to 11 ug/m 3. A greater number of constituents (35) were detected in sample SV-1 at concentrations of 0.5 to 51 ug/m 3. Although NYSDEC/NYSDOH have not developed standards for the evaluation of soil gas results, they have published a set of background indoor air values (NYSDOH, 2006) that can provide some benefit as screening criteria, i.e. constituents having soil gas concentration that are less than the indoor air background values may not warrant further evaluation since some degree of attenuation (soil to indoor air) is likely. The application of the indoor air background values as screening criteria provides for the following observations: Soil-gas sample SB-7 - The concentrations of two VOCs (chloroform and tetrachloroethene) were greater than the NYSDOH indoor air background values Soil-gas sample SB-13 - The concentrations of two VOCs (chloroform and tetrachloroethene) were greater than the indoor air background values. Soil-gas sample SV-1 - The concentrations of six VOCs (1,2,4 and 1,3,5 trimethylbenzene, styrene, chloroform, tetrachloroethene and trichloroethylene) were greater than the indoor air background values.
46 5-7 As indicated, the list of constituents that could warrant further consideration is dominated by chlorinated compounds that are not traditionally associated with MGP residuals, and constituents specifically associated with gas manufacturing, (thiophene, indane and indene) were not present at detectable levels in collected samples. Of the compounds detected, only chloroform and tetrachloroethene exhibited soil gas levels that are sufficiently elevated, i.e. an order of magnitude greater than the screening criteria, to potentially exceed background levels in indoor air. Note that the USEPA s Draft Vapor Intrusion Guidance (EPA, 2002) provides for an assumed 90% attenuation of constituent concentrations in shallow soil vapor when evaluating potential indoor air risk. Based on these results, it appears that the VOCs present in the soil gas beneath the Site buildings are not likely to be related to MGP residuals, and are not likely to pose a significant indoor air risk. 5.6 Forensic Analysis Three samples obtained during the SC were submitted for forensic analysis: SB-7 (22-30) - A soil sample obtained from the bottom of the boring which contained a dark NAPL. The soil consisted of brick fill. MW-4 ( ) - A soil sample obtained from the hand-dug utility clearance excavation for MW-4. This soil contained a dark gray hydrocarbon material which exhibited a strong hydrocarbon odor. MW-4 ( ) - A wood sample also found in the hand-excavation for MW-4. The wood appeared to be saturated by a hydrocarbon-like material. These samples were submitted to Meta al, Inc. of Watertown, Massachusetts (Meta) for forensic analysis by gas chromatography with a flame ionization detector (GC/FID). Meta was unable to identify a likely source on the chromatograms from the analysis of these samples. The two samples obtained at MW-4 were found to be similar, and dominated by naphthalene and light aromatic compounds. The sample from SB-7 was found to contain a high molecular weight material, with no significant volatile aromatic hydrocarbons present. It was interpreted to most likely represent an asphaltine based material. PAHs were noted to make up a very low fraction of this material. These chromatograms were found not to be suitable for additional review by a third-party forensic laboratory due to the lack of additional sample for testing and the type of analysis which was performed. It was recommended that any additional forensic analysis consider the use of gas chromatography/mass spectrometer (GC/MS) methods to provide additional information on the potential sources of the hydrocarbons.
47 Qualitative Human Health Exposure Assessment This section integrates the data and information gathered during the SC and provides a qualitative assessment of potential risks that could be associated with the environmental conditions encountered at the Site. This assessment was performed by identifying potential migration routes for the constituents of concern (COC), receptors, and associated exposure pathways. A review was then performed of the significance of each element. The assessment presented below includes a review of the Site setting and identifies and defines areas of interest according to current land uses. The exposure considerations listed above are discussed as they relate to each land use area and are summarized in Tables 6-1 and 6-2. The evaluation follows guidelines specified in the NYSDEC DER-10 Technical Guidance for Site Investigation and Remediation [NYSDEC, 2010]. 6.1 Site Setting The former gas holder Site is located in what is today a mixed commercial and residential area. The former gas holder and support building areas are currently covered by apartment buildings, an office condominium complex, a commercial building, street-level office space and underground parking garages. Similar property uses are found adjacent to the Site. The Site is intersected and bordered by public streets and sidewalks. Underground public utility lines are found beneath all of the streets and sidewalks within and adjacent to the Site. The Site and the surrounding area are serviced by municipal water supplies. Groundwater at and in the vicinity of the Site is currently not used for any purpose and is not expected to be used in the future. No surface water is present at the Site; however, the East River is located approximately 400 feet east and down gradient of the former gas holder parcels. Precipitation that falls at the Site is collected primarily in storm drains and sewers associated with the Site buildings and roads. A small amount of infiltration takes place in the grassy and landscaped area found on the Mount Vernon Hotel Museum property. The SC focused on two general areas including the former gas holder areas, and the off-site areas adjacent to, and/or hydraulically down gradient of the gas holder locations. The potential for receptors to be exposed is discussed in the following sections On-site Area The On-site Area is comprised of the three blocks on which gas holders and support equipment were operated. None of the three blocks are currently owned or operated by Con Edison. The northern gas holder block where gas holders 2 and 3 were present is beneath the Sutton Terrace Apartment complex. The southern gas holder block where gas holder 1 was present is currently covered by an apartment building, an office building, a warehouse/garage, and a small museum. The eastern block where the former valve/exhauster shop and paint shop were located is occupied by a garage and a university residence building.
48 Off-site Areas The assessment of potential exposure to residents and workers in off-site areas is discussed using the following designations: City of New York Streets This includes the city streets which border the gas holder and support building blocks, and include: York Avenue, between 61 st and 63 rd Streets; 62 nd Street, from the western end of the Sutton Terrace property to FDR Drive; 61 st and 63 rd Streets, along the margins of the former gas holder station blocks. The East River Area - The riparian habitat areas adjacent to the shore of the East River. 6.2 Exposure Assessment Exposure is the process by which humans come into contact with chemicals in their environment. Humans can be exposed to chemicals in a variety of environmental media including surface soil, subsurface soil, groundwater, and air. Exposure to these media can occur through several routes including ingestion, dermal contact, and inhalation. The exposure assessment identifies pathways by which humans are potentially exposed to COC. The assessment includes the following: Development of a conceptual site model; Discussion of potential release mechanisms; and Identification of potential human receptors and receptor-specific exposure pathways. Note that not all areas of the Site have been fully investigated at this time. However, all of these areas have been viewed during pre-investigation reconnaissance; therefore they are included in this assessment Conceptual Site Model Figure 6-1 presents the conceptual model for the study area. Included on the figure is information regarding the affected source media, identified release mechanisms/potential migration pathways and the potential exposure routes. Note that the exposure routes are considered potential unless there is either no access to residual material (no pathway), or a documented/high likelihood for exposure (complete pathway) Potential Human Receptors and Exposure Pathways This section discusses the identified potential receptors and the potential that the receptor may be exposed to Site-related residuals. On-site Area Receptors An assessment of potential exposure pathways for receptors in the On-site Area is presented in Table 6-1. The analysis includes an identification of each potential receptor group, a listing of each potential exposure media and potential pathway, and a rationale for inclusion or exclusion of each potential receptor. Potential receptor groups and potential exposure pathways that may exist for the Site are discussed below.
49 6-3 Site Residents and Visitors Residents and their visitors include those residing in the Sutton Terrace Apartments, the Park Sutton Apartments, and the Rockefeller University residence hall. None of these properties have exposed native surface soils, therefore, there are no exposures for direct contact to impacted soils or groundwater. The presence of constituents in soil gas indicates that the indoor air pathway is potentially complete. However, the observed constituent concentrations are relatively low, and the foundations of the buildings will likely provide a sufficient barrier to prevent a significant indoor air risk to residents and visitors. On-Site Indoor/Outdoor Maintenance Workers, Commercial Workers, Office Workers, and Museum Staff and Patrons Workers/patrons at the Mount Vernon Hotel Museum, the office buildings and storefront commercial spaces, and the apartment buildings would have the same potential exposure pathways as those for residents. However, maintenance workers at the Museum may also come into contact with surface soils and associated entrained particulate matter which have shown minimal impacts, although contact with subsurface soil is not likely with the exception of construction/utility workers (below). Soil gas migration to outside air is possible in unpaved/developed areas; however, the dilution with ambient air would likely eliminate the potential for any risk. Parking Garage Workers and Customers Workers/customers in the parking garages would not have the potential for direct contact with impacted soil or groundwater. Although the indoor air pathway is potentially complete due to the presence of constituents in soil gas, it is likely that the levels are attenuated by the structure walls/floor. Additionally, the concentrations of constituents in soil gas vapors are likely lower than those in the emissions from the vehicles present in the garages, and the effects of the contribution from soil gas vapors would likely not be measurable. On-site Subsurface Utility and Construction Workers Subsurface utility and construction workers may potentially be exposed to COC if subsurface excavation work is needed to repair or replace underground utility lines or if underground construction is performed on the Sutton Terrace Apartment portion of the Site. These workers may be exposed to soils, groundwater or NAPL in limited areas of the site via incidental ingestion, dermal contact, and inhalation of volatiles or particulates. Only properly trained field personnel should complete the subsurface utility work in this area using methods specified in a site-specific HASP until the areas have been cleared of impacted materials. Off-site Receptors An exposure pathway analysis for potential receptors in each of the off-site areas of interest is presented in Table 6-2. Potential receptor groups and potential exposure pathways for this area are discussed below.
50 6-4 Off-Site Subsurface Utility and Construction Workers Although impacted subsurface soil and NAPL have not been noted at offsite locations, the city streets and commercial and residential properties which border and/or run through the Site have the potential to be impacted by off-site migration of residuals in groundwater. It should be noted that hydrocarbon sources within the city streets also have the potential to impact the site parcels. Subsurface utility and construction workers may potentially be exposed to COC if subsurface excavation work is needed to repair or replace underground utility lines around the Site, or if underground construction is performed. These workers may be exposed to soils or groundwater via incidental ingestion, dermal contact, and inhalation of volatiles or particulates. Offsite Residents, Indoor Workers, Outdoor Maintenance Workers, Visitors, Pedestrians The Site is bordered by both commercial and residential properties. Soils are covered by buildings, pavement, or modern landscaping limiting potential exposure. There is some evidence of minor impacts in groundwater in off-site areas, although it does not appear to enter the basements of off-site structures. The analytical results for the sump sample collected from York Avenue on-site did not contain concentrations of VOCs exceeding criteria. Based on the evaluation of vapor intrusion risk for on-site receptors (above), the potential for a complete vapor intrusion pathway for MGP constituents in off-site areas is considered to be low. The East River Area Groundwater from the Site has the potential to discharge to the East River, but samples collected from monitoring wells installed along York Avenue and FDR Drive indicated only low levels of potential MGP constituents. Therefore, the potential contribution to river sediments and associated surface water is believed to be low. Additionally, access to the river in areas downgradient of the site is limited by the proximity of FDR Drive Conclusions Based on the Site investigation performed to date, it appears that the greatest potential for human health risk from MGP residuals would be related to subsurface utility/construction work on the Sutton Terrace Apartment portion of the Site and potentially in adjacent municipal rights of way. Excavations into subsurface soil may bring workers into contact with impacted soil, groundwater and isolated pockets of NAPL. Although such work would occur infrequently, work in areas where impacted soils are present should be conducted under site-specific health and safety and site management plans.
51 Summary and Conclusions This section summarizes the findings of the SC of the former York Avenue Gas Holder site, located in Manhattan, New York. 7.1 Site Geology The soils at the site consist of three units above the bedrock: A fill unit is found across the entire Site with the exception of at the Mount Vernon Museum property and where modern structures have been constructed directly on bedrock; Sand unit; and Gravel and sand unit. Bedrock at the Site is found from the ground surface to a maximum observed depth of 60feet bgs. The bedrock dips steeply to the east towards the East River. The upper surface of the bedrock is weathered in-place at some locations. 7.2 Site Hydrogeology There are no surface water bodies at the Site. The East River is located approximately 400 feet east of the former gas holder parcels. Precipitation at the Site drains into the stormwater sewer system or infiltrates to the subsurface in small landscaped areas. The water table was encountered in the overburden at depths ranging from 6.17 to 16.8 feet bgs. Groundwater flow in the overburden soils is from west to east towards the East River. Groundwater was encountered at depths of and in the bedrock at MW Nature and Extent of Constituents of Interest Four media of concern were investigated at the site: surface soil, subsurface soil, groundwater, and soil gas. A summary of the conclusions related to each media is presented below Surface Soil Native, in-place surface soil is only found at the grounds of the Mount Vernon Hotel Museum property. The surface soil at the Sutton Terrace Apartment complex is imported material which was placed on the roof of the underground parking garage. No other exposed soil is present except in small plantings for trees or shrubs. VOCs were not detected in the surface soil samples. PAHs were detected at concentrations above the Part Restricted Residential and/or Commercial SCOs in one surface soil sample (SS-3). Four metals, arsenic, cadmium, lead, and mercury, were detected at concentrations exceeding Restricted Residential SCOs. Only two metals, arsenic and lead exceeded the Restricted Commercial SCOs at one location (SS-3). The nature, concentrations, and distribution of the PAHs and metals are typical of surface soil and fill in urban environments and do not pose an immediate or long-term risk to human health or the environment. VOCs and PAHs are not considered to be of concern in surface soil at the Site.
52 7-2 Total and/or available cyanide were detected at low concentrations in two of the three surface soil samples. The total cyanide concentration detected was below the Part Restricted Residential and Commercial SCOs. PCBs were not detected at concentrations exceeding the SCOs in the surface soil samples. Cyanide and PCBs are not considered to be of concern in surface soil at the Site Subsurface Soil The subsurface soil at the Mount Vernon Museum property is interpreted to be native material or older fill, and representative of the ground surface and grade from the late 1700s. The subsurface soil which was encountered within the footprint of the gas holders at the Sutton Terrace property was found to be entirely made up of fill, much of which contained anthropogenic materials such as brick, timbers, and stone varying in size from gravel to large blocks. Based on the property records, all of the material inside the holders was emplaced during construction of the Sutton Terrace complex after the property had been decommissioned as a gas holder Site and sold by Con Edison. The subsurface soil which was encountered within the footprint of Gas Holder No.1 at York Avenue consisted of fill above the holder foundation. Visual indications of impact were noted in the soil or fill at the base of the boring at SB-7, and in the hand-dug utility clearance excavation at MW-4A. Blebs of hydrocarbon-like material were also observed in the groundwater in boring SB-12. A slight sheen was noted during drilling activities in downgradient monitoring well MW-7 between 10 and 15 ft bgs. Benzene was the only VOC that was detected in subsurface soil at a concentration above the part Restricted Residential SCOs. Benzene was detected in the ft bgs sample collected from SB-11 between Gas Holders No. 2 and 3. Other VOCs including MTBE were detected at concentrations below the SCOs indicating more modern sources of VOCs in addition to the former holders. PAH concentrations were detected in subsurface soil at concentrations above the Part Restricted Residential and/or Commercial SCOs at MW-4A(2), MW-7 (15-20), SB-3(11-13), SB-5( ), SB-7(2-2.6) and (22-30), SB-8(5-7), and SB-11( ). PAHs can be associated with former MGP holders but are also ubiquitous in urban areas from sources such as heating fuel oils, auto emissions, etc. Six metals were detected in subsurface soil samples at concentrations above the Part Residential and/or Commercial SCOs in six of the 18 samples. The six metals include arsenic, barium, cadmium, copper, lead, and mercury. Three samples contained one metal, two samples contained three metals and one sample contained five metals at concentrations exceeding the SCOs. The distribution of the metal concentrations exceeding the SCOs does not indicate that the former gas holder operations are the source of the metals. One PCB aroclor was detected in one of 16 subsurface soil samples. The PCB concentration detected was below the Part Restricted Residential and Commercial SCOs. Only two out of 20 subsurface soil samples contained total cyanide at concentrations exceeding the Part Restricted Residential and Commercial SCOs. Therefore, cyanide is not considered to be of concern in subsurface soil at the Site Groundwater Benzene was detected at concentrations above the NYSDEC groundwater standard in the groundwater grab sample at SB-5 and in each of the monitoring wells except for upgradient
53 bedrock well MW-1. MTBE was detected in wells MW-1, MW-3, MW-7, and SB-10MW suggesting that a source of VOCs may also be modern petroleum use. Only SB-8MW contained concentrations of all of the BTEX compounds exceeding the standards and guidance values. PAHs were detected above groundwater standards in SB-8MW, which contained naphthalene at a concentration of 240 ug/l and in MW-7 which contained benzo(a)anthracene and benzo(b)fluoranthene at estimated concentrations of 0.43 and 0.29 ug/l, respectively. The only other SVOC which exceeded groundwater standards was phenol, which was detected in both MW-3 and SB-8MW. (The detection of phthalate in SB- 10MW is attributed to sampling or laboratory contamination.) Total cyanide was detected at four of the six wells (MW-6, MW-7, SB-8MW, and SB-10MW), with only SB-8MW exceeding the groundwater standard of 200 ug/l. Total cyanide was also detected in the groundwater grab sample collected from SB-5 but was detected at a concentration below standards. Available cyanide was detected at low concentrations in groundwater samples collected from SB-5, MW-6 and SB-8MW. Eleven metals were detected at concentrations exceeding the NYSDEC groundwater standard or guidance values in one or more samples. These metals include antimony, beryllium, chromium, copper, iron, lead, magnesium, manganese, sodium, thallium,and zinc. These metals are common naturally-occurring in the types of soil that comprise the water table aquifer at the Site and are not considered to be uniquely related to gas storage operations. PCBs were not detected in any of the groundwater samples collected during the SC activities. Soil Gas Soil-gas sample SB-7 - The concentrations of two VOCs (chloroform and tetrachloroethene) were greater than the NYSDOH indoor air background values Soil-gas sample SB-13 - The concentrations of two VOCs (chloroform and tetrachloroethene) were greater than the indoor air background values. Soil-gas sample SV-1 - The concentrations of six VOCs (1,2,4 and 1,3,5 trimethylbenzene, styrene, chloroform, tetrachloroethene and trichloroethylene) were greater than the indoor air background values. The list of constituents that could warrant further consideration is dominated by chlorinated compounds that are not traditionally associated with MGP residuals, and constituents specifically associated with gas manufacturing, (thiophene, indane and indene) were not present at detectable levels in collected samples. Of the compounds detected, only chloroform and tetrachloroethene exhibited soil gas levels that are sufficiently elevated, i.e., an order of magnitude greater than the screening criteria, to potentially exceed background levels in indoor air. Based on these results, it appears that the VOCs present in the soil gas beneath the Site buildings are not likely to be related to MGP residuals, and are not likely to pose a significant indoor air risk. 7.4 Human Health Risk Assessment A qualitative risk assessment was completed to determine whether the quality of soil, soil vapor, and groundwater at the Site pose a potential threat to human health at or in the vicinity of the Site.
54 7-4 Based on the Site investigation performed to date, it appears that the greatest potential for human health risk from MGP residuals would be related to subsurface utility/construction work on the Sutton Terrace Apartment portion of the Site and potentially in adjacent municipal rights of way. Excavations into subsurface soil may bring workers into contact with impacted soil, groundwater and isolated pockets of NAPL. Although such work would occur infrequently, work in areas where impacted soils are present should be conducted under site-specific health and safety and Site management plans.
55 Recommendations Based on the findings of the SC as presented in this report, no additional investigation actions are required for the majority of the Site. Furthermore, no interim remedial actions are warranted at this time based on the results of the SC. It is recommended that additional investigation activities be performed in order to supplement the information obtained during the SC in the area of former gas holders No. 2 and 3 at the Sutton Terrace property. This work will be proposed under a RI Work Plan. The RI scope-of-work should be carried out to complete the assessment of the subsurface conditions at the Site and will include additional borings within and adjacent to former gas holders No. 2 and 3 on the Sutton Terrace Apartment property. Additional investigation is not proposed for the Rockefeller University Housing property or on the southern portion of the Site where Gas Holder No. 1 was situated based on the SC results.
56 References Hydrosolve, AQTESOLV. Aquifer Test Analysis Software. Isachsen, Y. I., and W. G. McKendree, Generalized Map of Recorded Joint Systems in New York. New York State Museum, Map and Chart Service Number 31F. Langan Engineering and al Services, MGP Research Report, York Avenue Station. NYSDEC, Revised TAGM 4046 Determination of Soil Cleanup Objectives and Cleanup Levels, memo from Michael J. O Toole, HWR , January. PSC Reports. The New York Public Service Commission Reports for the years 1907 to NYSDEC, Ambient Water Quality Standards and Guidance Values, Division of Water Technical and Operational Guidance Series (1.1.1), October. Isachsen, Y. I., and W. G. McKendree, Generalized Map of Recorded Joint Systems in New York. New York State Museum, Map and Chart Service Number 31F. NYSDEC, Draft DER-10, Technical Guidance for Site Investigation and Remediation. NewYork State Department of al Conservation, Division of al Remediation, December 25, OASIS Website for Property Owner Information. RETEC, February Site Characterization Study Work Plan, York Avenue Former Gas Holder Station Site, Manhattan, New York. Sanborn Fire Insurance Maps. Provided to Consolidated Edison by al Data Resources, Inc. for the years 1892, 1907, 1951, 1976, 1979, 1980, 1982, 1985, 1987, 1988, 1991, 1992, 1993, 1994, 1995, and USEPA, Risk Assessment Guidance for Superfund, Volume I. Human Health Evaluation Manual (Part A), Office of Emergency and Remedial Response: Washington, DC, EPA 540/1-89/002.
57 Tables
58 Table 3-1 Summary of Surface Soil Samples Collected, Sample Rationales, and Analyses Sampled During The Site Characterization - August 2004 York Avenue - Former Gas Holder Site Manhattan, New York Sample Designation Sample Rationale Depth Interval (feet bgs) Laboratory Analysis Completed SB-1 SS-2 SS-3 Assess surface soil conditions at a support building for the former gas holder site. Assess surface soil conditions at a support building for the former gas holder site. Assess surface soil conditions at a support building for the former gas holder site TCL VOCs, TCL SVOCs, TAL Metals, Total Cyanide, Available Cyanide, PCBs TCL VOCs, TCL SVOCs, TAL Metals, Total Cyanide, Available Cyanide, PCBs TCL VOCs, TCL SVOCs, TAL Metals, Total Cyanide, Available Cyanide, PCBs Notes: bgs - below ground surface TCL VOCs - Target Compound List volatile organic compounds TCL SVOCs - Target Compound List semi-volatile organic compounds TAL - Target Analyte List PCBs - polychorinated biphenyls Page 1 of 1
59 Table 3-2 Summary of Subsurface Soil Samples Collected, Sample Rationale, and Analyses Perfomred During Site Characterization York Avenue - Former Gas Holder Site Manhattan, New York Sample Designation Sample Rationale Depth Interval (feet bgs) Laboratory Analysis Completed MW-1 No soil samples taken due to bedrock being at 3 ft bgs NA None MW-3 (11-17) MW-3 (13-15) Assess soil conditions at the top of the water table down gradient of former Gas Holder No. 1 Assess soil conditions at the top of the water table down gradient of former Gas Holder No TCL VOCs, TCL SVOCs, TAL Metals, Total Cyanide, Available Cyanide, PCBs TCL VOCs MW-4A (2) Assess soil conditions in former Gas Holder No. 3 2 TCL VOCs, TCL SVOCs, TAL Metals, Total Cyanide, Available Cyanide, PCBs MW-5 (5-7) Assess soil conditions in former Gas Holder No TCL VOCs, TCL SVOCs, TAL Metals, Total Cyanide, Available Cyanide, PCBs MW-6 (10-11) SB-1 ( ) SB-7 (2-2.6) Assess soil conditions at the top of the water table down gradient of former Gas Holder No. 2 Assess soil conditions above bedrock west of former Gas Holder No. 1 Assess soil conditions below concrete and void space at this boring location TCL VOCs, TCL SVOCs, TAL Metals, Total Cyanide, Available Cyanide, PCBs TCL VOCs, TCL SVOCs, TAL Metals, Total Cyanide, Available Cyanide, PCBs TCL VOCs, TCL SVOCs, TAL Metals, Total Cyanide, Available Cyanide, PCBs SB-7 (22-30) Assess soil conditions in former Gas Holder No TCL VOCs, TCL SVOCs, TAL Metals, Total Cyanide, Available Cyanide, PCBs SB-8 (5-7) Assess soil conditions in former Gas Holder No TCL VOCs, TCL SVOCs, TAL Metals, Total Cyanide, Available Cyanide, PCBs SB-9 (3-3.4) SB-11 ( ) Assess soil conditions between former Gas Holders No. 2 and No. 3 Assess soil conditions between former Gas Holders No. 2 and No TCL VOCs, TCL SVOCs, TAL Metals, Total Cyanide, Available Cyanide, PCBs TCL VOCs, TCL SVOCs, TAL Metals, Total Cyanide, Available Cyanide, PCBs SB-12 ( ) Assess soil conditions in former Gas Holder No TCL VOCs, TCL SVOCs, TAL Metals, Total Cyanide, Available Cyanide, PCBs SB-12 (5-7) Assess soil conditions in former Gas Holder No TCL VOCs, TCL SVOCs, TAL Metals, Total Cyanide, Available Cyanide, PCBs SB-13 SB-2 (7-12) SB-3 (11-13) SB-4 ( ) SB-4 ( ) SB-5 ( ) SB-5 ( ) MW-7 (15-20) MW-7 (20-25) No soil samples taken due to presence of concrete. NA None Assess soil conditions in the center of Gas Holder No Assess soil conditions within and near the southern edge of Gas Holder No. 1 Assess soil conditions outside of and adjacent to Gas Holder No. 1 Assess soil conditions at the base of the boring (likely top of bedrock) outside of and adjacent to Gas Holder No. 1 Assess soil conditions within and near the easterd edge of Gas Holder No. 1 Assess soil conditions at the base of the boring (likely top of bedrock) within and near the eastern edge of Gas Holder No. 1 Assess soil conditions downgradient of Gas Holders No. 2 and No. 3. Assess soil conditions downgradient of Gas Holders No. 2 and No TCL VOCs, TCL SVOCs, TAL Metals, Total Cyanide, Available Cyanide, Amenable Cyanide, PCBs TCL VOCs, TCL SVOCs, TAL Metals, Total Cyanide, Available Cyanide, Amenable Cyanide, PCBs TCL VOCs, TCL SVOCs, TAL Metals, Total Cyanide, Available Cyanide, Amenable Cyanide, PCBs TCL VOCs, TCL SVOCs, TAL Metals, Total Cyanide, Available Cyanide, Amenable Cyanide, PCBs TCL VOCs, TCL SVOCs, TAL Metals, Total Cyanide, Available Cyanide, Amenable Cyanide, PCBs TCL VOCs, TCL SVOCs, TAL Metals, Total Cyanide, Available Cyanide, Amenable Cyanide, PCBs TCL VOCs, TCL SVOCs, Total Cyanide, PCBs TCL VOCs, TCL SVOCs, Total Cyanide, PCBs Notes: bgs - below ground surface TCL VOCs - Target Compound List volatile organic compounds TCLSVOCs - Target Compound List Semi-volatile organic compounds TAL - Target Analyte List PCBs - polychlorinated biphenyl's Page 1 of 1
60 Table 3-3 Summary of Monitoring Well Construction, Well Survey, and Water Level Gauging Results Site Characterization York Avenue - Former Gas Holder Site Manhattan, New York 8-Oct-05 8-Nov-11 Monitoring Screen Well Screen Groundsurface Top of PVC Groundwater Groundwater Well Date Interval Diameter Slot Size Elevation Riser Elevation Depth to Water NAPL Elevation Depth to Water NAPL Elevation ID Installed (feet bgs) (inch) (inch) (NAVD88) (NAVD88) (feet bgs) Presence (NAVD88) (feet bgs) Presence (NAVD88) MW-1 2/11/ ND ND MW-3 2/10/ ND ND 0.31 MW-6 2/17/ ND ND MW-7 8/20/ NI NI NI 9.22 ND 0.28 SB-8MW 9/14/ ND 3.53 NM ND NM SB-10MW 9/13/ ND 2.92 NM ND NM Notes: bgs - below ground surface NAVD88 - North American Vertical Datum of 1988 ND - Not Detected NI - Not Installed NM- Not Measured Page 1 of 1
61 Table 3-4 Summary of Groundwater Samples Collected, Sample Rationale, and Analyses Performed During the Site Characterization York Avenue - Former Gas Holder Station Manhattan, New York Sample Sample Designation Rationale Laboratory Analysis Completed MW-1 Assess background groundwater conditions TCL VOCs, TCL SVOCs, TAL Metals, Total Cyanide, Available Cyanide, PCBs MW-3 Assess groundwater conditions down gradient of Gas Holder No. 1 TCL VOCs, TCL SVOCs, TAL Metals, Total Cyanide, Available Cyanide, PCBs MW-6 Assess groundwater conditions down gradient of Gas Holder No. 2 TCL VOCs, TCL SVOCs, TAL Metals, Total Cyanide, Available Cyanide, PCBs MW-7 Assess groundwater conditions downgradient of Gas Holders No. 2 and 3 and downgradient of the valve-exhauster house. TCL VOCs, TCL SVOCs, TAL Metals, Total Cyanide, Available Cyanide, PCBs SB-8MW Assess groundwater conditions inside the foundation of Gas Holder No. 3 TCL VOCs, TCL SVOCs, TAL Metals, Total Cyanide, Available Cyanide, PCBs SB-10MW Assess groundwater between the foundations of Gas Holders No. 2 and No. 3 TCL VOCs, TCL SVOCs, TAL Metals, Total Cyanide, Available Cyanide, PCBs SB-5 Assess groundwater quality in the footprint of former Gas Holder No. 1 TCL VOCs, TCL SVOCs, TAL Metals, Total Cyanide, Available Cyanide, PCBs Sump Assess groundwater conditions in the sump in the basement of the building located at York Ave. Notes: bgs - below ground surface TCL VOCs - Target Compound List volatile organic compounds TCL SVOCs - Target Compound List semi-volatile organic compounds TCL VOCs, TCL SVOCs, TAL Metals, Total Cyanide, Available Cyanide, PCBs Page 1 of 1
62 Table 5-1 Surface Soil Analytical Results York Avenue Former Gas Holder Site Manhattan, NY Location ID SB-01 SS-02 SS-03 NYSDEC Part SCOs Sample Date 8/24/2004 8/24/2004 8/24/2004 CAS # Sample ID Restricted Use Restricted Use SB13( ) SS SS Depth Interval (feet bgs) Residential Commercial Volatile Organic Compounds (mg/kg) Total VOC NL NL ND ND ND PAH (mg/kg) 2-Methylnaphthalene NL NL J <0.43 U 0.13 J Acenaphthene J J 0.31 J Acenaphthylene J J 0.39 J Anthracene J J 1.1 J Benzo(a)anthracene J 0.21 J 3.9 Benzo(a)pyrene J 0.18 J 3.8 Benzo(b)fluoranthene J 0.14 J 2.5 Benzo(ghi)perylene J 0.12 J 1.3 J Benzo(k)fluoranthene J 0.15 J 3.2 Chrysene J 0.26 J 4.4 Dibenz(a,h)anthracene <0.94 U <0.43 U 0.31 J Fluoranthene Fluorene J <0.43 U 0.33 J Indeno(1,2,3-cd)pyrene J J 1.2 J Naphthalene J <0.43 U 0.19 J Phenanthrene J 6.5 Pyrene Total PAH NL NL SVOC (mg/kg) Butyl benzyl phthalate NL NL <0.94 U 0.13 J 0.34 J Carbazole NL NL 0.15 J J 0.48 J Dibenzofuran J <0.43 U 0.21 J Di-n-butyl phthalate NL NL <0.94 U J <2.2 U Total SVOC NL NL Metals (mg/kg) Aluminum NL NL 8460 J J 8490 J Antimony NL NL J 3.4 Arsenic Barium Beryllium J 1.0 J 1.1 J Cadmium Calcium NL NL Chromium Cobalt NL NL Copper Iron NL NL Lead Magnesium NL NL Manganese Mercury Nickel Potassium NL NL Selenium J 0.56 J 2.2 J Silver J 1.8 Sodium NL NL 328 J 154 J 596 J Thallium NL NL <1.4 U 0.61 J 1.3 J Vanadium NL NL 73.3 J 36.9 J 71.8 J Zinc Cyanide (mg/kg) Cyanide, Total <0.71 U <0.65 U 1 Available Cyanide AV NL NL 0.13 <0.052 U 0.12 PCB (mg/kg) Aroclor NL NL <0.047 U <0.043 U <0.055 U Aroclor NL NL <0.047 U <0.043 U <0.055 U Aroclor NL NL <0.047 U <0.043 U <0.055 U Aroclor NL NL <0.047 U <0.043 U <0.055 U Aroclor NL NL <0.047 U <0.043 U <0.055 U Aroclor NL NL <0.047 U <0.043 U <0.055 U Aroclor NL NL Total PCB Percent Solids Percent Solids PS NL NL Notes: U indicates Undetected J indicates estimated concentration NL indicates a SCO is not listed for the compound SCO - Soil Cleanup Objective Bolded values are detected compounds Bolded and Italicized values are nondetect levels that exceed the SCO Bolded and Yellow Shaded values exceed NYSDEC PART Restricted Use Residential SCOs Bolded and Orange Shaded values exceed NYSDEC PART Restricted Use Commercial SCOs ND indicates the compound was Not Detected mg/kg - miligrams per kilogram Page 1 of 2
63 Table 5-1 Surface Soil Analytical Results York Avenue Former Gas Holder Site Manhattan, NY Location ID NYSDEC Part SCOs Sample Date CAS # Sample ID Restricted Use Restricted Use Depth Interval (feet bgs) Residential Commercial Volatile Organic Compounds (mg/kg) Total VOC NL NL PAH (mg/kg) 2-Methylnaphthalene NL NL Acenaphthene Acenaphthylene Anthracene Benzo(a)anthracene Benzo(a)pyrene Benzo(b)fluoranthene Benzo(ghi)perylene Benzo(k)fluoranthene Chrysene Dibenz(a,h)anthracene Fluoranthene Fluorene Indeno(1,2,3-cd)pyrene Naphthalene Phenanthrene Pyrene Total PAH NL NL SVOC (mg/kg) Butyl benzyl phthalate NL NL Carbazole NL NL Dibenzofuran Di-n-butyl phthalate NL NL Total SVOC NL NL Metals (mg/kg) Aluminum NL NL Antimony NL NL Arsenic Barium Beryllium Cadmium Calcium NL NL Chromium Cobalt NL NL Copper Iron NL NL Lead Magnesium NL NL Manganese Mercury Nickel Potassium NL NL Selenium Silver Sodium NL NL Thallium NL NL Vanadium NL NL Zinc Cyanide (mg/kg) Cyanide, Total Available Cyanide AV NL NL PCB (mg/kg) Aroclor NL NL Aroclor NL NL Aroclor NL NL Aroclor NL NL Aroclor NL NL Aroclor NL NL Aroclor NL NL Total PCB 1 1 Percent Solids Percent Solids PS NL NL Notes: U indicates Undetected J indicates estimated concentration NL indicates a SCO is not listed for the compound SCO - Soil Cleanup Objective Bolded values are detected compounds Bolded and Italicized values are nondetect levels that exceed the SCO Samples Detects Non-Detects Exceedances DL Exceedances Summary Statistics SS SS SS SB13( ) SS SS SS SS SS SS SS SS SB13( ) SS SS SS SS SS SS SS SS SS SS SS SS SS SS SB13( ) SS SS SS SB13( ) SS SS SS SS SS SS SS SS SS SS SS SB13( ) SS SS SS SS SS SB13( ) SB13( ) SS SB13( ) SS SS SS SS SB13( ) SS SS SS SS SS SB13( ) SS SB13( ) SS SS SS SB13( ) SB13( ) SS SS SB13( ) SS SB13( ) SS SS SS SS SB13( ) SS SS SS SS SS SS SS SS SS SB13( ) SS SS SS SS SS SB13( ) SS SS SS SS SS SS SS Bolded and Yellow Shaded values exceed NYSDEC PART Restricted Use Residential SCOs Bolded and Orange Shaded values exceed NYSDEC PART Restricted Use Commercial SCOs ND indicates the compound was Not Detected mg/kg - miligrams per kilogram Max Detected Concentration ID for Max Concentration Min Detected Concentration ID for Min Concentration Average Detected Concentration Min DL for NonDetects Max DL for NonDetects Page 2 of 2
64 Table 5-2 Subsurface Soil Analytical Results York Avenue Former Gas Holder Site Manhattan, NY Location ID MW-03 MW-03 MW-04A MW-05 MW-06 MW-07 MW-07 SB-01 SB-02 SB-03 NYSDEC PART SCO Sample Date 2/2/2005 2/2/2005 6/27/2005 8/5/2005 2/14/2005 8/20/2011 8/20/2011 8/24/2004 7/29/2011 8/2/2011 CAS # Sample ID Restricted Restricted MW03(11-17) MW03(13-15) MW4A(2) MW05(5-7) MW06(10-11) SB-7 (15-20) SB-7 (20-25) SB13( ) SB-2 (7-12) SB-3 (11-13) Depth Interval (feet bgs) Residential Commercial BTEX (mg/kg) Benzene NA < U 0.24 J < U < U < U < U < U < U < U Ethylbenzene NA < U 1.4 < U < U < U < U < U < U < U Toluene NA J 7 < U < U < U < U < U < U < U Xylenes (total) NA <0.017 U 21 <0.018 U <0.02 U ND ND <0.016 U ND ND Total BTEX NL NL NA ND ND ND ND ND ND ND Volatile Organic Compounds (mg/kg) 2-Butanone NA < U <0.39 U < U < UJ J J < U R J Acetone NA <0.023 U <1.6 U J <0.026 UJ 0.1 J J <0.022 U J J Carbon disulfide NL NL NA < U <0.39 U < U < U < U < U < U < U < U Chloroethane NL NL NA < U <0.39 U < U < U < U < U < U < U < U Cyclohexane NL NL NA < U <0.39 U < U < U < U < U < U < U < U Isopropylbenzene NL NL NA < U <0.39 U < U < U < U < U < U < U < U Methyl tert-butyl ether NA < U <0.39 UJ < U < UJ < U < U < U < U Methylcyclohexane NL NL NA < U <0.39 U < U < U < U < U < U < U < U Methylene chloride NA < U <0.39 U < U < U < U < U < U Total VOC NL NL ND ND ND PAH (mg/kg) 2-Methylnaphthalene NL NL <0.37 U NA 54 <0.39 U <0.44 U <0.4 U <0.39 U <0.36 U <0.38 U 0.4 Acenaphthene <0.37 U NA <42 U <0.39 U <0.44 U 0.12 J <0.39 U <0.36 U <0.38 U 0.22 J Acenaphthylene <0.37 U NA <42 U <0.39 U <0.44 U <0.4 U <0.39 U <0.36 U <0.38 U 0.21 J Anthracene <0.37 U NA <42 U <0.39 U <0.44 U 0.38 J <0.39 U <0.36 U <0.38 U 0.54 Benzo(a)anthracene <0.37 U NA <42 U J J <0.36 U Benzo(a)pyrene <0.37 U NA <42 U <0.39 U <0.44 U <0.36 U Benzo(b)fluoranthene <0.37 U NA <42 U <0.39 U J <0.36 U Benzo(ghi)perylene <0.37 U NA <42 U <0.39 U J 0.88 <0.39 U <0.36 U J 1.6 Benzo(k)fluoranthene <0.37 U NA <42 U <0.39 U <0.44 U J <0.36 U J 1.3 Chrysene <0.37 U NA <42 U J J 1.4 <0.39 U <0.36 U J 3.2 Dibenz(a,h)anthracene <0.37 U NA <42 U <0.39 U <0.44 U 0.13 <0.039 U <0.36 U <0.038 U 0.5 Fluoranthene J NA <42 U <0.39 U <0.44 U J <0.36 U 0.17 J 3.4 Fluorene <0.37 U NA <42 U <0.39 U <0.44 U 0.15 J <0.39 U <0.36 U <0.38 U 0.16 J Indeno(1,2,3-cd)pyrene <0.37 U NA <42 U <0.39 U J J <0.36 U Naphthalene <0.37 U NA J <0.44 U <0.4 U <0.39 U <0.36 U <0.38 U 0.71 Phenanthrene J NA 1.3 J <0.39 U <0.44 U J <0.36 U 0.11 J 2.5 Pyrene J NA <42 U J J J <0.36 U 0.15 J 4.4 Total PAH NL NL NA ND SVOC (mg/kg) 1,1'-Biphenyl NL NL <0.37 U NA <42 U <0.39 U <0.44 U <0.4 U <0.39 U <0.36 U <0.38 U 0.1 J Acetophenone NL NL <0.37 U NA <42 U <0.39 U <0.44 U <0.4 U <0.39 U <0.36 U <0.38 U 0.23 J bis(2-ethylhexyl) phthalate NL NL 0.36 J NA <42 U <0.39 U <0.44 U <0.4 U <0.39 U 0.18 J <0.38 U 0.22 J Butyl benzyl phthalate NL NL <0.37 U NA <42 U J <0.44 U <0.4 U <0.39 U <0.36 U <0.38 U <0.38 U Carbazole NL NL <0.37 U NA <42 U <0.39 U <0.44 U 0.11 J <0.39 U <0.36 U <0.38 U 0.2 J Dibenzofuran <0.37 U NA <42 U <0.39 U <0.44 U J <0.39 U <0.36 U <0.38 U 0.19 J Isophorone NL NL <0.37 U NA <42 U <0.39 U <0.44 U <0.4 U <0.39 U <0.36 U <0.38 U <0.38 U Phenol <0.37 U NA <42 U <0.39 U <0.44 U <0.4 U <0.39 U <0.36 U <0.38 U J Total SVOC NL NL NA Metals (mg/kg) Aluminum NL NL NA J NA NA J Antimony NL NL <5.6 U NA 0.60 J <2.3 UJ <1.3 UJ NA NA 0.44 J <2.1 U 2.0 J Arsenic NA NA NA Barium J NA J NA NA Beryllium NA 0.40 J NA NA 0.90 J 0.29 J 0.30 J Cadmium <0.56 U NA 3.1 <0.58 U 0.12 J NA NA <0.54 U <1.1 U 12.8 Calcium NL NL 2130 NA J NA NA Chromium NA NA NA Cobalt NL NL 15.3 NA NA NA J 8.1 J Copper NA 31.7 J J NA NA Iron NL NL NA J J NA NA Lead NA 307 J J NA NA Magnesium NL NL 5330 NA J NA NA Manganese NA 200 J J NA NA Mercury NA <0.044 U NA NA <0.036 U Nickel NA J NA NA Potassium NL NL 5950 NA 5690 J J NA NA Selenium <0.56 U NA 0.49 J NA NA <0.54 U 1.1 J 1.8 J Silver <0.56 U NA 0.34 J <0.58 U <0.66 U NA NA J <2.1 U 2.0 J Sodium NL NL 240 J NA J 329 J NA NA 115 J 276 J 1370 Thallium NL NL 0.90 J NA <1.6 U 0.72 J- <1.3 U NA NA <1.1 U <2.1 U <2.3 U Vanadium NL NL 36.7 NA J NA NA 25.0 J Zinc NA 239 J J 61.9 J NA NA Cyanide (mg/kg) Cyanide, Total <0.56 U NA J <0.66 U <0.61 U <0.59 U <0.54 U <0.57 U 36.9 Available Cyanide AV NL NL <0.045 U NA <0.053 U NA NA <0.043 U <0.046 U J+ Cyanide, Amenable AMEN NL NL NA NA NA NA NA NA NA NA <0.50 U 12.4 PCB (mg/kg) Aroclor NL NL <0.037 U NA NA NA <0.044 U <0.082 U <0.08 U <0.036 U <0.076 U J Total PCB CALC-PCB 1 1 ND NA NA NA ND ND ND ND ND Percent Solids Percent Solids PS NL NL NA NA Notes: U indicates Undetected J indicates estimated concentration J- indicates Estimated Concentration, low bias suspected J+ indicates Estimated Concentration, high bias suspected R indicates rejected result NL indicates the compound is Not Listed ND indicates the compound was Not Detected NA indicates Not Available SCOs - Soil Cleanup Objectives Bolded values are detected compounds Bold and yellow shaded values exceed NYSDEC PART Restricted Residential Use SCOs Bold and orange shaded values exceed NYSDEC PART Restricted Commercial Use SCOs Bolded and Italicized values are nondetect levels that exceed the SCO VOCs - Volatile Organic Compounds mg/kg - miligrams per kilogram bgs - below ground surface * Sample for SB-01 was incorrectly labeled as SB-13. Page 1 of 3
65 Table 5-2 Subsurface Soil Analytical Results York Avenue Former Gas Holder Site Manhattan, NY Location ID NYSDEC PART SCO Sample Date CAS # Sample ID Restricted Restricted Depth Interval (feet bgs) Residential Commercial BTEX (mg/kg) Benzene Ethylbenzene Toluene Xylenes (total) Total BTEX NL NL Volatile Organic Compounds (mg/kg) 2-Butanone Acetone Carbon disulfide NL NL Chloroethane NL NL Cyclohexane NL NL Isopropylbenzene NL NL Methyl tert-butyl ether Methylcyclohexane NL NL Methylene chloride Total VOC NL NL PAH (mg/kg) 2-Methylnaphthalene NL NL Acenaphthene Acenaphthylene Anthracene Benzo(a)anthracene Benzo(a)pyrene Benzo(b)fluoranthene Benzo(ghi)perylene Benzo(k)fluoranthene Chrysene Dibenz(a,h)anthracene Fluoranthene Fluorene Indeno(1,2,3-cd)pyrene Naphthalene Phenanthrene Pyrene Total PAH NL NL SVOC (mg/kg) 1,1'-Biphenyl NL NL Acetophenone NL NL bis(2-ethylhexyl) phthalate NL NL Butyl benzyl phthalate NL NL Carbazole NL NL Dibenzofuran Isophorone NL NL Phenol Total SVOC NL NL Metals (mg/kg) Aluminum NL NL Antimony NL NL Arsenic Barium Beryllium Cadmium Calcium NL NL Chromium Cobalt NL NL Copper Iron NL NL Lead Magnesium NL NL Manganese Mercury Nickel Potassium NL NL Selenium Silver Sodium NL NL Thallium NL NL Vanadium NL NL Zinc Cyanide (mg/kg) Cyanide, Total Available Cyanide AV NL NL Cyanide, Amenable AMEN NL NL PCB (mg/kg) Aroclor NL NL Total PCB CALC-PCB 1 1 Percent Solids Percent Solids PS NL NL SB-04 SB-04 SB-05 SB-05 SB-07 SB-07 SB-08 SB-09 SB-11 SB-12 SB-12 8/4/2011 8/3/2011 8/4/2011 8/4/2011 6/27/2005 8/4/2005 8/4/2005 7/14/2005 8/8/2005 7/14/2005 8/5/2005 SB-4 ( ) SB-4 ( ) SB-5 ( ) SB-5 ( ) SB07(2-2.6) SB07(22-30) SB08(5-7) SB09(3-3.4) SB11( ) SB12( ) SB12(5-7) < U < U < U < U J < U < U < U J < U < U < U < U J < U < U < U J J < U < U < U < U < U < U J ND ND ND ND J <0.023 U <0.017 U <0.018 U J ND ND ND ND ND ND <0.012 U <0.011 U <0.011 U <0.01 U < U < U < U < U <1.3 U < U < U J J J J <0.024 U <0.03 U <0.023 U <0.024 U <5.1 U <0.025 U <0.023 U < U < U < U < U < U < U <1.3 U < U < U < U < U < U < U < U < U < U < U 1.7 J < U < U < U < U < U < U < U < U < U < U 1.5 < U < U < U < U < U < U < U < U < U < U 2.7 < U < U < U < U < U < U < U < U < U < U <1.3 U < U < U < U < U < U < U < U < U < U < U 5.6 < U < U < U < U < U < U 0.57 J < U < U ND ND ND <0.42 U <0.37 U J <0.39 U J <2.5 U J <0.4 U 8.7 J J J <0.42 U <0.37 U 0.19 J <0.39 U J <2.5 U 0.15 J 0.13 J 0.63 J J J <0.42 U <0.37 U <0.37 U <0.39 U 0.15 J <2.5 U J <0.4 U 0.51 J J 0.01 J <0.42 U <0.37 U J 0.3 J <2.5 U 0.27 J <0.4 U J J 0.13 <0.037 U J 0.61 J J J 0.1 J 0.14 <0.037 U J 0.49 J <0.4 U J 0.11 J 0.16 <0.037 U J 1.3 J J J 0.27 J 0.12 J <0.37 U 2.1 J J J 0.63 J <0.4 U J 0.15 J <0.037 U J 0.86 J 0.79 J <0.4 U J 0.16 J 0.13 J <0.37 U J J 0.73 J 0.14 J J 0.11 J J <0.037 U 0.37 <0.039 U 0.2 J <2.5 UJ <1.9 UJ <0.4 U 0.66 J <0.41 U 0.12 J 0.18 J <0.37 U J J 1.5 J <0.4 U 17 J 0.26 J 0.16 J <0.42 U <0.37 U 0.26 J <0.39 U J <2.5 U 0.84 J 0.18 J J 0.18 J 0.13 J <0.037 U 2.3 J J 0.79 J 0.79 J <0.4 U J 0.18 J <0.42 U <0.37 U 0.21 J <0.39 U J J 0.22 J 0.03 J J <0.37 U J J 1 J 0.23 J 18 J 0.15 J 0.31 J 0.22 J <0.37 U J 2.5 J 0.36 J 1.5 J 0.12 J 12 J 0.25 J 0.18 J ND <0.42 U <0.37 U <0.37 U <0.39 U <0.78 U <2.5 U <1.9 U <0.4 U 0.65 J <0.41 U 0.13 J <0.42 U <0.37 U <0.37 U <0.39 U <0.78 U <2.5 U <1.9 U <0.4 U <1 U <0.41 U <0.38 U <0.42 U <0.37 U <0.37 U <0.39 U 0.18 J <2.5 U <1.9 U <0.4 U <1 U <0.41 U J <0.42 U <0.37 U <0.37 U <0.39 U <0.78 U <2.5 U <1.9 U <0.4 U <1 U <0.41 U 0.01 J <0.42 U <0.37 U 0.39 <0.39 U 0.11 J <2.5 U J <0.4 U J J <0.42 U <0.37 U 0.17 J <0.39 U J <2.5 U J <0.4 U J J <0.42 U <0.37 U 0.27 J <0.39 U <0.78 U <2.5 U <1.9 U <0.4 U <1 U <0.41 U <0.38 U <0.42 U <0.37 U <0.37 U <0.39 U <0.78 U <2.5 U <1.9 U <0.4 U <1 U <0.41 U <0.38 U < <2.5 U <2.1 U <2.1 U <2.4 U 0.81 J <1.5 UJ <5.8 UJ <6.0 UJ <1.5 UJ <1.2 UJ <5.7 UJ 2.2 <1.1 U J 30.3 J <0.51 U <0.42 U 0.36 J 0.24 J 0.24 J 0.38 J J J <1.3 U <1.1 U <1.1 U <1.2 U J 0.15 J <0.60 U <0.76 U <0.62 U <0.57 U J J 4.2 J 8.3 J 6.5 J 5.2 J 4.8 J J J J J J 4.2 J 44.7 J 49.9 J 526 J+ 164 J J 190 J 341 J 274 J 168 J <0.033 U J J J J J J J 2950 <2.5 U <2.1 U <2.1 U <2.4 U <2.5 U <2.1 U <2.1 U 0.22 J J 0.13 J <0.60 U 0.40 J <0.62 U <0.57 U 96.1 J <1060 U <1070 U 137 J <593 U 403 J 381 J 65.6 J 298 J 206 J 142 J <2.5 U <2.1 U <2.1 U <2.4 U <1.2 U 1.2 J- 1.5 J- <1.2 U 1.5 J- <1.2 U 0.78 J J J J 33.4 J J 35.1 J <0.64 U <0.57 U <0.56 U <0.59 U <0.59 U J 1.3 <0.62 U 0.41 J U <0.045 U <0.045 U U <0.047 U <0.048 U 0.39 <0.049 U <0.046 U <0.50 U <0.50 U <0.50 U <0.50 U NA NA NA NA NA NA NA <0.085 U <0.076 U <0.075 U <0.079 U NA <0.05 U <0.038 U <0.04 U <0.05 U <0.041 U NA ND ND ND ND NA ND ND ND ND ND NA Notes: U indicates Undetected J indicates estimated concentration J- indicates Estimated Concentration, low bias suspected J+ indicates Estimated Concentration, high bias suspected R indicates rejected result NL indicates the compound is Not Listed ND indicates the compound was Not Detected NA indicates Not Available SCOs - Soil Cleanup Objectives Bolded values are detected compounds Bold and yellow shaded values exceed NYSDEC PART Restricted Residential Use SCOs Bold and orange shaded values exceed NYSDEC PART Restricted Commercial Use SCOs Bolded and Italicized values are nondetect levels that exceed the SCO VOCs - Volatile Organic Compounds mg/kg - miligrams per kilogram bgs - below ground surface * Sample for SB-01 was incorrectly labeled as SB-13. Page 2 of 3
66 Table 5-2 Subsurface Soil Analytical Results York Avenue Former Gas Holder Site Manhattan, NY Location ID NYSDEC PART SCO Sample Date CAS # Sample ID Restricted Restricted Depth Interval (feet bgs) Residential Commercial BTEX (mg/kg) Benzene Ethylbenzene Toluene Xylenes (total) Total BTEX NL NL Volatile Organic Compounds (mg/kg) 2-Butanone Acetone Carbon disulfide NL NL Chloroethane NL NL Cyclohexane NL NL Isopropylbenzene NL NL Methyl tert-butyl ether Methylcyclohexane NL NL Methylene chloride Total VOC NL NL PAH (mg/kg) 2-Methylnaphthalene NL NL Acenaphthene Acenaphthylene Anthracene Benzo(a)anthracene Benzo(a)pyrene Benzo(b)fluoranthene Benzo(ghi)perylene Benzo(k)fluoranthene Chrysene Dibenz(a,h)anthracene Fluoranthene Fluorene Indeno(1,2,3-cd)pyrene Naphthalene Phenanthrene Pyrene Total PAH NL NL SVOC (mg/kg) 1,1'-Biphenyl NL NL Acetophenone NL NL bis(2-ethylhexyl) phthalate NL NL Butyl benzyl phthalate NL NL Carbazole NL NL Dibenzofuran Isophorone NL NL Phenol Total SVOC NL NL Metals (mg/kg) Aluminum NL NL Antimony NL NL Arsenic Barium Beryllium Cadmium Calcium NL NL Chromium Cobalt NL NL Copper Iron NL NL Lead Magnesium NL NL Manganese Mercury Nickel Potassium NL NL Selenium Silver Sodium NL NL Thallium NL NL Vanadium NL NL Zinc Cyanide (mg/kg) Cyanide, Total Available Cyanide AV NL NL Cyanide, Amenable AMEN NL NL PCB (mg/kg) Aroclor NL NL Total PCB CALC-PCB 1 1 Percent Solids Percent Solids PS NL NL Samples Detects Non-Detects Exceedances DL Exceedances Max Detected Concentration Summary Statistics ID for Max Concentration Min Detected Concentration ID for Min Concentration Average Detected Concentration Min DL for NonDetects SB11( ) SB12(5-7) SB11( ) SB07(2-2.6) MW4A(2) SB-4 ( ) MW4A(2) SB12(5-7) SB11( ) SB-4 ( ) SB-7 (20-25) SB-3 (11-13) SB-7 (15-20) SB-2 (7-12) SB-4 ( ) SB-5 ( ) SB11( ) SB11( ) SB11( ) SB11( ) SB11( ) SB11( ) SB-7 (15-20) SB-7 (15-20) SB11( ) SB11( ) SB11( ) SB-5 ( ) SB11( ) SB13( ) MW4A(2) SB12( ) SB11( ) SB12( ) SB11( ) SB12( ) SB11( ) SB12( ) SB11( ) MW05(5-7) SB07(2-2.6) SB-7 (20-25) SB-3 (11-13) SB09(3-3.4) SB-5 ( ) MW06(10-11) SB11( ) SB-7 (20-25) SB11( ) MW05(5-7) SB-3 (11-13) SB-4 ( ) SB11( ) MW03(11-17) SB11( ) SB12( ) SB-5 ( ) SB-7 (20-25) SB11( ) SB09(3-3.4) SB11( ) MW03(11-17) SB11( ) MW05(5-7) SB11( ) SB13( ) SB11( ) SB-3 (11-13) SB-3 (11-13) 0.23 SB-3 (11-13) MW03(11-17) SB12(5-7) MW05(5-7) SB12(5-7) SB11( ) SB12( ) SB11( ) SB12( ) SB-5 ( ) 0.27 SB-5 ( ) SB-3 (11-13) SB-3 (11-13) SB11( ) SB13( ) SB08(5-7) SB-4 ( ) SB-3 (11-13) 0.44 SB13( ) SB11( ) SB-5 ( ) SB08(5-7) SB-4 ( ) SB13( ) SB07(2-2.6) MW4A(2) MW06(10-11) SB-3 (11-13) 633 SB-4 ( ) SB-3 (11-13) 8.3 SB-4 ( ) MW4A(2) SB-4 ( ) SB-3 (11-13) 9.1 SB-4 ( ) SB11( ) SB-4 ( ) SB07(2-2.6) SB-4 ( ) SB07(22-30) SB-4 ( ) SB11( ) SB-4 ( ) SB07(2-2.6) SB09(3-3.4) MW4A(2) SB-4 ( ) MW03(11-17) SB-4 ( ) SB11( ) MW4A(2) SB-3 (11-13) SB13( ) SB-3 (11-13) 65.6 SB09(3-3.4) SB11( ) MW05(5-7) MW03(11-17) SB-4 ( ) SB-3 (11-13) 21.6 SB-4 ( ) SB07(22-30) MW05(5-7) MW4A(2) SB-3 (11-13) SB-3 (11-13) 12.4 SB-3 (11-13) SB-3 (11-13) SB-3 (11-13) SB-3 (11-13) - SB13( ) SB13( ) MW4A(2) Max DL for NonDetects Notes: U indicates Undetected J indicates estimated concentration J- indicates Estimated Concentration, low bias suspected J+ indicates Estimated Concentration, high bias suspected R indicates rejected result NL indicates the compound is Not Listed ND indicates the compound was Not Detected NA indicates Not Available SCOs - Soil Cleanup Objectives Bolded values are detected compounds Bold and yellow shaded values exceed NYSDEC PART Restricted Residential Use SCOs Bold and orange shaded values exceed NYSDEC PART Restricted Commercial Use SCOs Bolded and Italicized values are nondetect levels that exceed the SCO VOCs - Volatile Organic Compounds mg/kg - miligrams per kilogram bgs - below ground surface * Sample for SB-01 was incorrectly labeled as SB-13. Page 3 of 3
67 Table 5-3 Summary of Field Parameters Recorded During Groundwater Sampling Site Characterization - Fall 2005 and 2011 York Avenue Former Gas Holder Site Manhattan, NY Specific Sample Date Temperature Conductance ph ORP DO Turbidity Designation Sampled O C ms/cm S.U. mv mg/l NTU MW-01 10/11/2005 Note MW-03 11/1/ MW-06 11/1/ MW-7 9/7/ SB-08MW 10/8/ , Note 2 Note SB-10MW 10/8/ Note 2 Note 2 Note 2 Note 2 50 Notes: mv - millivolt S.U. - Standard Unit ORP - Oxidation Reduction Potential NTU - Nephelometric Turbidity Unit mg/l - milligrams per liter ms/cm - microsemens per second Note 1 - Well had only enough water to sample (well went dry after purging and did not recharge). Note 2 - Parameter on water quality meter malfunctioned Page 1 of 1
68 Table 5-4 Groundwater Analytical Results York Avenue Former Gas Holder Site Manhattan, NY Location ID NYSDEC MW-01 MW-01 MW-03 MW-03 MW-06 MW-06 MW-07 SB-05 SB-08MW SB-08MW SB-08MW SB-10MW SUMP Sample Date Groundwater 3/3/ /11/2005 3/3/ /1/2005 3/3/ /1/2005 9/7/2011 8/5/2011 9/2/ /8/ /8/ /8/2005 8/17/2011 CAS # Sample ID Standard and Guidance MW MW MW MW MW MW MW SB-5-GW SB08-MW SB-08MW SB-08MW DUP SB-10MW SUMP( ) Lab Sample ID Values C5K C5C C5K C5I C5J C5J C5I C5J C5J C5J BTEX (ug/l) Benzene s <1.0 U <1.0 U J 2.2 J J 490 J 4.0 <1.0 U Ethylbenzene s <1.0 U <1.0 U <1.0 U <1.0 U 0.28 J <2.0 U <1.0 U <1.0 U <1.0 U <1.0 U Toluene s <1.0 U <1.0 U 0.65 J 0.49 J 2.7 <2.0 U 0.19 J 0.32 J J <1.0 U Xylenes (total) s <3.0 U <3.0 U <3.0 U <3.0 U 0.39 J <6.0 U ND ND <3.0 U ND Total BTEX CALC-BTEX NL ND ND ND Voltile Organic Compounds (ug/l) 1,1,2-Trichloroethane s <1.0 U <1.0 U <1.0 U <1.0 U <1.0 U <2.0 U <1.0 U <1.0 U 18 J <20 U <20 U <1.0 U <1.0 U 2-Butanone g <5.0 U <5.0 U J 63 <10 U 2.1 J <200 U <100 U <100 U <5.0 U <10 U Acetone g <5.0 U <5.0 U R 17 <200 U <100 U <100 U 5.1 R Bromodichloromethane g 0.69 J <1.0 U <1.0 U <1.0 U <1.0 U <2.0 U <1.0 U <1.0 UJ <40 U <20 U <20 U <1.0 U <1.0 U Carbon disulfide g <1.0 U <1.0 U 1.0 <1.0 U <1.0 U <2.0 U <1.0 U <1.0 U <40 U <20 U <20 U <1.0 U <1.0 U Chloroform s J 0.38 J <1.0 U 7.5 <2.0 U <1.0 U <1.0 UJ <40 U <20 U <20 U <1.0 U 0.21 J Isopropylbenzene s <1.0 U <1.0 U <1.0 U <1.0 U <1.0 U <2.0 U <1.0 U <1.0 U 9.3 J 9.0 J 9.2 J <1.0 U <1.0 U Methyl acetate NL <1.0 U <1.0 U <2.0 UJ R <2.0 U <40 U <20 U <20 U <1.0 U R Methyl tert-butyl ether g J 0.71 J <1.0 U <2.0 U 1.8 <1.0 U <40 U <20 U <20 U 0.59 J <1.0 U Methylene chloride s <1.0 U <1.0 U <1.0 U <1.0 U 0.67 J 12 J <1.0 U <1.0 UJ <40 U <20 U <20 U <1.0 U <1.0 U Styrene s <1.0 U <1.0 U <1.0 U <1.0 U <1.0 U <2.0 U <1.0 U <1.0 U <1.0 U <1.0 U Tetrachloroethene s <1.0 U 0.80 J <1.0 U <1.0 U <1.0 U <2.0 U <1.0 U <1.0 U <40 U <20 U <20 U <1.0 U 0.26 J Total VOC NL PAH (ug/l) Acenaphthene g <9.8 U <9.5 U <9.4 U <22 U <9.4 U <9.4 U <10 U <10 U 3.5 J <9.4 U <9.5 U <11 U <11 U Benzo(a)anthracene g <9.8 U <9.5 U <9.4 U <22 U <9.4 U <9.4 U 0.43 J <1.0 U <9.5 U <9.4 U <9.5 U <11 U <1.1 U Benzo(a)pyrene ND <9.8 U <9.5 U <9.4 U <22 U <9.4 U <9.4 U 0.29 J <1.0 U <9.5 U <9.4 U <9.5 U <11 U <1.1 U Benzo(b)fluoranthene g <9.8 U <9.5 U <9.4 U <22 U <9.4 U <9.4 U 0.29 J <1.0 U <9.5 U <9.4 U <9.5 U <11 U <1.1 U Fluoranthene g <9.8 U <9.5 U <9.4 U <22 U <9.4 U <9.4 U <10 U <10 U 0.35 J <9.4 U <9.5 U <11 U <11 U Fluorene g <9.8 U <9.5 U <9.4 U <22 U <9.4 U <9.4 U <10 U <10 U 2.0 J 1.8 J 1.8 J <11 U <11 U Naphthalene g <9.8 U <9.5 U 0.39 J <22 U 0.99 J <9.4 U <10 U <10 U J <9.5 UJ <11 U <11 U Phenanthrene g <9.8 U <9.5 U <9.4 U <22 U <9.4 U <9.4 U <10 U <10 U 2.6 J <9.4 U <9.5 U <11 U <11 U Pyrene g <9.8 U <9.5 U <9.4 U <22 U <9.4 U <9.4 U <10 U <10 U 0.29 J <9.4 U <9.5 U <11 U <11 U Total PAH NL ND ND 0.62 ND 1.4 ND 1.01 ND ND ND SVOC (ug/l) 1,1'-Biphenyl s <9.8 U <9.5 U <9.4 U <22 U <9.4 U <9.4 U <10 U <10 U 2.5 J <9.4 U <9.5 U <11 U <11 U 2-Methylnaphthalene NL <9.8 U <9.5 U 0.23 J <22 U 0.41 J <9.4 U <10 U <10 U <9.5 U <11 U <11 U 4-Methylphenol NL <9.8 U <9.5 U 4.4 J 12 J <9.4 U <9.4 U <10 U <10 U <9.5 U 2.3 J 1.8 J <11 U <11 U Benzaldehyde NL <9.8 U <9.5 U 3.4 J <22 U <9.4 U <9.4 U <10 UJ <10 UJ <9.5 U <9.4 U <9.5 U <11 U <11 U bis(2-ethylhexyl) phthalate s <9.8 U 3.2 J <9.4 U <22 U <9.4 U <9.4 U <10 U <10 U <9.5 U 4.4 J 2.6 J 6.1 J <11 U Butyl benzyl phthalate g <9.8 U <9.5 U 0.24 J <22 U <9.4 U <9.4 U <10 U <10 U 0.58 J <9.4 U <9.5 U <11 U <11 U Caprolactam NL <9.8 U 8.7 J <9.4 U 2.7 J J <10 UJ <10 U <9.5 U <9.4 U <9.5 U <11 U <11 U Carbazole NL <9.8 U <9.5 U <9.4 U <22 U <9.4 U <9.4 U <10 U <10 U 5.5 J 3.7 J <9.5 U <11 U <11 U Dibenzofuran NL <9.8 U <9.5 U <9.4 U <22 U <9.4 U <9.4 U <10 U <10 U 2.2 J <9.4 U <9.5 U <11 U <11 U Diethyl phthalate g <9.8 U <9.5 U <9.4 U <22 U <9.4 U <9.4 U <10 U <10 U 0.37 J <9.4 U <9.5 U <11 U <11 U Di-n-butyl phthalate g <9.8 U <9.5 U <9.4 U <22 U 0.68 J <9.4 U <10 U <10 U <9.5 U <9.4 U <9.5 U <11 U <11 U Hexachloroethane s <9.8 U <9.5 U <9.4 U <22 U <9.4 U <9.4 U 0.27 J <1.0 U <9.5 U <9.4 U <9.5 U <11 U <1.1 U Isophorone g <9.8 U <9.5 U 0.98 J <22 U <9.4 U <9.4 U <10 U <10 U <9.5 U <9.4 U <9.5 U <11 U <11 U Phenol s <9.8 U <9.5 U <9.4 U <9.4 U <10 U <10 U <9.5 U 5.4 J 4.5 J <11 U <11 U Total SVOC NL ND ND ND Metals (ug/l) Aluminum NL NA J J J J 42.3 J J Antimony s NA <10.0 U <10.0 U <10.0 U <10.0 U <10.0 U <2.5 U <2.5 U <10.0 U <10.0 U 3.5 J 3.9 J <2.5 U Arsenic s NA <10.0 U <10.0 U <10.0 U J <10.0 U <10.0 U <10.0 U <10.0 U <2.5 U Barium ,000 s NA J J J 113 J 113 J 159 J 243 Beryllium g NA <4.0 U <4.0 U <4.0 U 4.5 <4.0 U <1.0 U <1.0 U <4.0 U <4.0 U <4.0 U <4.0 U <1.0 U Calcium NL NA Chromium s NA 3.2 J J J <5.0 U <5.0 U 3.2 J <5.0 U Cobalt NL NA 0.88 J 4.5 J <50.0 U 59.8 <50.0 U <5.0 U J 0.91 J 0.96 J 2.1 J <5.0 U Copper s NA 18.8 J J J <25.0 U <25.0 U <25.0 U 20.4 Iron s NA J Lead s NA <3.0 U <3.0 U Magnesium ,000 s NA <5000 U Manganese s NA Mercury s NA <0.20 U 0.13 J <0.20 U 0.16 J <0.20 U <0.20 U <0.20 U <0.20 U <0.20 U Nickel s NA 4.6 J 27.5 J 17.4 J J J 2.1 J 2.1 J 20.6 J <5.0 U Potassium NL NA J J J J J Selenium s NA <5.0 U 3.1 J <5.0 UJ 3.9 J <5.0 UJ <2.5 U <2.5 U <5.0 U <5.0 U <5.0 U <5.0 U <2.5 U Silver s NA <5.0 U 0.33 J <5.0 U <5.0 U <5.0 U <5.0 U <5.0 U <5.0 U <5.0 U <5.0 U 0.43 J <5.0 U Sodium ,000 s NA Thallium g NA <10.0 U <10.0 U <10.0 U <10.0 U <10.0 U <1.0 U <1.0 U <10.0 U <10.0 U <10.0 U 4.8 J <1.0 U Vanadium NL NA 1.3 J 10.4 J 3.5 J J J 1.4 J 1.3 J 1.2 J <5.0 U Zinc ,000 g NA 2580 J <20.0 U <20.0 U <20.0 U Total Cyanide (ug/l) Cyanide, Total s <10.0 U <10.0 U <10.0 U <10.0 U 7.0 J <10.0 U 6.3 J 8.2 J J+ 902 J+ 127 J+ <10.0 U Available Cyanide (mg/l) Available Cyanide AV NL NA < U < U < U < U J < UJ J J- < UJ < U PCB (ug/l) Total PCB.09 ND ND ND ND ND ND ND ND ND ND ND ND ND Notes: U indicates Undetected Bold and Italicized values are non detected compounds above the NYSDEC Recommended Guidance or Standard Value J indicates Estimated Concentration Bolded values are detected compounds J- indicates Estimated Concentration, low bias suspected Bolded and Shaded values are detected compounds above the NYSDEC Recommended Guidance or Standard Value J+ indicates Estimated Concentration, high bias suspected Guidance or Standard Values - NYSDEC, Division of Water, TOGS (1.1.1) - 6 NYCRR (NYSDEC, 1998). R indicates value Rejected NL indicates the compound is Not Listed NA indicates the compound was Not Analyzed for Page 1 of 2
69 Location ID NYSDEC Sample Date Groundwater CAS # Sample ID Standard and Guidance Lab Sample ID Values BTEX (ug/l) Benzene s Ethylbenzene s Toluene s Xylenes (total) s Total BTEX CALC-BTEX NL Voltile Organic Compounds (ug/l) 1,1,2-Trichloroethane s 2-Butanone g Acetone g Bromodichloromethane g Carbon disulfide g Chloroform s Isopropylbenzene s Methyl acetate NL Methyl tert-butyl ether g Methylene chloride s Styrene s Tetrachloroethene s Total VOC NL PAH (ug/l) Acenaphthene g Benzo(a)anthracene g Benzo(a)pyrene ND Benzo(b)fluoranthene g Fluoranthene g Fluorene g Naphthalene g Phenanthrene g Pyrene g Total PAH NL SVOC (ug/l) 1,1'-Biphenyl s 2-Methylnaphthalene NL 4-Methylphenol NL Benzaldehyde NL bis(2-ethylhexyl) phthalate s Butyl benzyl phthalate g Caprolactam NL Carbazole NL Dibenzofuran NL Diethyl phthalate g Di-n-butyl phthalate g Hexachloroethane s Isophorone g Phenol s Total SVOC NL Metals (ug/l) Aluminum NL Antimony s Arsenic s Barium ,000 s Beryllium g Calcium NL Chromium s Cobalt NL Copper s Iron s Lead s Magnesium ,000 s Manganese s Mercury s Nickel s Potassium NL Selenium s Silver s Sodium ,000 s Thallium g Vanadium NL Zinc ,000 g Total Cyanide (ug/l) Cyanide, Total s Available Cyanide (mg/l) Available Cyanide AV NL PCB (ug/l) Total PCB.09 Notes: U indicates Undetected J indicates Estimated Concentration J- indicates Estimated Concentration, low bias suspected J+ indicates Estimated Concentration, high bias suspected R indicates value Rejected NL indicates the compound is Not Listed NA indicates the compound was Not Analyzed for Samples Detects Non-Detects Exceedances Table 5-4 Groundwater Analytical Results York Avenue Former Gas Holder Site Manhattan, NY DL Exceedances Max Detected Concentration ID for Max Concentration Summary Statistics SB08-MW MW SB08-MW MW SB08-MW MW SB08-MW MW SB08-MW MW SB08-MW SB08-MW MW MW MW SB-10MW MW MW MW MW MW SUMP( ) SB08-MW SB-08MW MW MW MW SB-10MW MW MW SB08-MW SB-08MW MW SUMP( ) SB08-MW SUMP( ) SB08-MW SB08-MW MW MW MW MW MW MW SB08-MW SB08-MW SB08-MW SB-08MW DUP SB-08MW MW SB08-MW SB08-MW SB08-MW SB08-MW SB-08MW SB-10MW SB08-MW SB08-MW SB-08MW MW MW SB-08MW DUP MW MW SB-10MW SB-08MW DUP SB08-MW MW MW MW SB08-MW SB-08MW SB08-MW SB08-MW SB08-MW SB08-MW MW MW MW MW MW MW MW SB-08MW DUP SB-08MW MW MW SB-08MW SB-10MW SB-08MW DUP MW SB-5-GW MW SB-08MW DUP MW MW MW MW MW SB08-MW MW MW MW SB08-MW MW SB-08MW MW SB08-MW MW SB-5-GW MW MW SB-5-GW MW MW SB-08MW DUP MW MW MW MW SB-10MW MW MW SB-10MW SB-10MW SB-10MW MW SB-10MW MW MW SB-08MW MW SB08-MW MW SB08-MW SB08-MW Bold and Italicized values are non detected compounds above the NYSDEC Recommended Guidance or Standard Value Bolded values are detected compounds Bolded and Shaded values are detected compounds above the NYSDEC Recommended Guidance or Standard Value Guidance or Standard Values - NYSDEC, Division of Water, TOGS (1.1.1) - 6 NYCRR (NYSDEC, 1998). Min Detected Concentration ID for Min Concentration Average Detected Concentration Min DL for NonDetects Max DL for NonDetects Page 2 of 2
70 Table 5-5 Summary of Soil Gas Analytical Results York Avenue Former Gas Holder Station Manhattan, NY All values in ug/m 3 Type of Sample Soil Gas Soil Gas Soil Gas NYSDOH Background Indoor Air Values 3 Sample Location CAS Number York Ave York Ave York Ave Sampling Date 7/7/2005 7/20/2005 8/17/ th Percentile 90th Percentile Compound Sample I SB-13 SB-7 SV-1 Possibly MGP Related or Other Sources 1 1,2,4-Trimethylbenzene U ,3,5-Trimethylbenzene U ,2,4-Trimethylpentane U 3.8 U 0.98 J NL NL 2,3-Dimethylpentane U 3.3 U 0.82 U Methylpentane U 2.8 U 1.8 NL NL 4-Ethyltoluene U 4.0 U 12 NL NL Benzene U 0.55 J Carbon disulfide NL NL Cyclohexane U 2.8 U 0.80 J Ethylbenzene U 0.70 U Heptane U 3.3 U 1.1 J Hexane U 2.8 U 1.4 J 6 18 Indane U 3.9 U 2.7 NL NL Indene U 3.8 U 1.9 U NL NL Isopentane (2-Methylbutane) U 2.4 U 12 NL NL Naphthalene U J NL NL Styrene U 0.68 U Thiophene U 2.8 U 0.69 U NL NL Toluene m/p-xylenes o-xylene U Not MGP Related 2 1,1,1-Trichloroethane U 0.88 U ,1,2,2-Tetrachloroethane U 1.1 U 1.4 U ,1,2-Trichloroethane U 0.88 U 1.1 U ,1-Dichloroethane U 0.65 U 0.81 U ,1-Dichloroethene U 0.64 U 0.79 U ,2,4-Trichlorobenzene U 6.0 UJ 7.4 U ,2-Dibromoethane (EDB) U 1.2 U 1.5 U ,2-Dichlorobenzene U 0.97 U 1.2 U ,2-Dichloroethane U 0.65 U 0.81 U ,2-Dichloropropane U 0.74 U 0.92 U ,3-Butadiene U 1.8 U 0.88 U NL NL 1,3-Dichlorobenzene U 0.97 U 1.2 U ,4-Dichlorobenzene U 0.97 U 1.2 U ,4-Dioxane U 2.9 U 1.8 U NL NL 2-Butanone U Hexanone UJ 3.3 U 0.33 J NL NL 4-Methyl-2-pentanone U 3.3 U 1.2 J Acetone J alpha-chlorotoluene (Benzyl chloride) U 0.83 U 2.1 U NL NL Bromodichloromethane U 5.4 U 0.53 J NL NL Bromoform U 8.3 U 2.1 U NL NL Bromomethane U 0.62 U 0.78 U Carbon tetrachloride U 1.0 U 0.45 J Chlorobenzene U 0.74 U 0.92 U Chloroethane U 0.42 U 0.16 J Chloroform Chloromethane J cis-1,2-dichloroethene U 0.64 U 0.79 U cis-1,3-dichloropropene U 0.73 U 0.91 U Dibromochloromethane U 6.8 U 1.7 U NL NL Ethanol J Trichlorofluoromethane (Freon 11) ,1,2-Trichloro-1,2,2-trifluoroethane (Freon 113) U J ,2-Dichlorotetrafluoroethane (Freon 114) U 1.1 U 1.4 U Dichlorodifluoromethane (Freon 12) Hexachlorobutadiene U 8.6 UJ 11 U Methyl tert-butyl ether U 2.9 U 3.6 U Methylene Chloride (Dichloromethane) U 0.56 U 1.9 J Propanol U 2.0 U 1.9 J NL NL Propylene U 1.4 U 0.86 U NL NL Tetrachloroethene Tetrahydrofuran U 2.4 U 2.4 J trans-1,2-dichloroethene U 3.2 U 0.79 U NA NA trans-1,3-dichloropropene U 0.73 U 0.91 U Trichloroethene U 0.86 U 0.65 J Vinyl chloride U 0.41 U 0.51 U Helium (%) N/A N/A 3.3 NL NL Notes: NL - Not Listed. No value listed for background concentrations of these compounds. N/A - Not Analyzed U - Not detected at the detection limit indicated. J - Estimated Concentration. Bold - Detected. 1 These compounds may be related to either MGP sources or non-mgp sources, or both. MGP sources include MGP tars and petroleum feedstocks used in MGP pro carbureted water gas process. Non-MGP sources include cleaning products, floor wax and polish, vehicle exhaust, construction materials, and cigarette smoke. 2 These compounds are not related to MGP sources and are present due to non-mgp sources, such as vehicle exhaust, heating and air conditioning systems, cleanin 3 New York State Department of Health, Study of Volatile Organic Chemicals, VOCs in Air of Fuel Heated Homes, Revised November 16, Indoor Air and Ambient samples exceeding NYSDOH Background 75th Percentile Indoor Air and Ambient samples exceeding NYSDOH Background 90th Percentile Page 1 of 1
71 Table 6-1 Exposure Pathway Analysis - Potential On-Site Receptors York Avenue Gas Holder Site Manhattan, NY Receptor Exposure Medium Exposure Pathway Pathway Not Considered Complete Pathway Considered Potentially Complete Pathway Considered Complete Rationale for Inclusion or Exclusion On-site Residents and Visitors Ingestion X On-site Surface Soil (0-2 inches) Dermal contact X Inhalation of Particulates X The surface of all residential properties is covered by buildings or pavement. Inhalation of Volatiles in Ambient Air X Ingestion X Residents and Visitors Dermal contact X On-site Subsurface Soil (>2 inches) Inhalation of Particulates X Inhalation of Volatiles in Ambient Air X Residents are not likely to come in contact with subsurface soil since the surfaces of the residential properties are covered by buildings or pavement. Inhalation of volatiles may be possible if soil gas intrustion occurs; however, the soil gas testing results indicate low levels of COCs that are not generally related to MGP residuals and not believed to provide a significant risk in indoor air. Inhalation of Volatiles in Indoor Air --- X --- Ingestion X Groundwater Dermal contact X Inhalation of Volatiles in Ambient Air X Inhalation of Volatiles in Indoor Air --- X --- Groundwater is not used at the site and residents are not likely to come in contact with subsurface media since the surfaces of the residential properties are covered by buildings or pavement. Inhalation of volatiles may be possible if soil gas intrustion occurs; however, the soil gas testing results indicate only low levels of COCs that are not generally related to MGP residuals and not believed to provide a significant risk in indoor air. Surface Water Ingestion X Dermal contact X Surface water is not present at the site. On-site Indoor/Outdoor Maintainence Workers, Commercial Workers, Office Workers, Museum Staff and Patrons Ingestion X Potentially native surface soil is only present on grounds of the Mount Vernon Hotel Museum. All other areas covered by buildings or Dermal Contact --- X --- pavement, or contain soil imported for landscaping. Potential contact is generally limited to maintenance workers. On-site Surface Soil Inhalation of Particulates (0-2 inches) --- X --- Inhalation of constituents is possible if work is performed in areas immediately above the soil surface. Inhalation of Volatiles in Ambient Air X VOCs are not present in surface soil and potential receptors are unlikely to contact subsurface soils during their activities. Indoor/Outdoor Maintainence Workers, Commercial Workers, Office Workers, Museum Staff Ingestion X Dermal Contact X Inhalation of Particulates X Inhalation of Volatiles in Ambient Air --- X --- Ingestion X Groundwater Dermal contact X Inhalation of Volatiles in Ambient Air --- X --- Ingestion Surface Water Dermal contact On-site Subsurface Utility Workers and Construction Workers Subsurface Utility and Construction Workers Parking Garage Workers and Patrons Parking Garage Workers and Patrons On-site Subsurface Soil (>2 inches) On-site Surface Soil (0-2 inches) On-site Subsurface Soil (>2 inches) Groundwater Surface Water On-site Surface Soil (0-2 inches) On-site Subsurface Soil (>2 inches) Groundwater Ingestion X Dermal contact X Inhalation of Particulates X Inhalation of Volatiles in Ambient Air X Ingestion X Dermal contact X Inhalation of Particulates X Inhalation of Volatiles in Ambient Air X Ingestion X Dermal contact X Inhalation of Volatiles in Ambient Air X Ingestion Dermal contact Ingestion X Dermal contact X Inhalation of Particulates X Inhalation of Volatiles in Ambient Air X Ingestion X Dermal contact X Inhalation of Particulates X Inhalation of Volatiles in Indoor Air --- X --- Ingestion X Dermal contact X Inhalation of Volatiles in Indoor Air --- X --- These workers are not likely to come in contact with subsurface media and groundwater is not used. Inhalation of volatiles may be possible if soil gas intrustion occurs; however, the soil gas testing results indicate low levels of COCs that are not generally related to MGP residuals and not believed to provide a significant risk in indoor air. No surface water present. Utility or Construction Workers who repair or maintain equipment at the site may be exposed to residuals in soil or groundwater, therefore the exposure pathway is considered complete. Surface water is not present at the site. These workers are not likely to come in contact with subsurface media and groundwater is not used. Inhalation of volatiles may be possible if soil gas intrustion occurs; however, the soil gas testing results indicate low levels of COCs that are not generally related to MGP residuals and not believed to provide a significant risk in indoor air. Surface Water Ingestion Dermal contact No surface water present. Page 1 of 1
72 Table 6-2 Exposure Pathway Analysis - Potential Off-Site Receptors York Avenue Gas Holder Site Manhattan, NY Receptor Exposure Medium Exposure Pathway Pathway Not Considered Complete Pathway Considered Potentially Complete Pathway Complete Rationale for Inclusion or Exclusion Off-site Residents, Indoor Workers, Outdoor Maintenance Workers, Visitors, Pedestrians Ingestion X Surface Soil (0- Dermal Contact X inches) Inhalation of Particulates X Inhalation of Volatiles in Ambient Air X Ingestion X Residents, Indoor Dermal Contact X Workers, Outdoor Subsurface Soil Inhalation of Particulates X Maintenance (>2 inches) Inhalation of Volatiles in Ambient Air X Workers, Site Visitors, and Inhalation of Volatiles in Indoor Air X Pedestrians Ingestion X Groundwater Dermal contact X Inhalation of Volatiles in Ambient Air X Inhalation of Volatiles in Indoor Air X Surface Water Ingestion X Dermal contact X Off-site Subsurface Utility and Construction Workers Ingestion X Surface Soil (0- Dermal contact X inches) Inhalation of Particulates X Inhalation of Volatiles in Ambient Air X Ingestion --- X --- Dermal contact --- X --- Subsurface Utility and Construction Workers Off-site Area - East River Commercial and Recreational Users Subsurface Soil (>2 inches) Groundwater Surface Water Sediment Surface Water Inhalation of Particulates --- X --- Inhalation of Volatiles in Ambient Air --- X --- Inhalation of Volatiles in Indoor Air --- X --- Ingestion --- X --- Dermal contact --- X --- Inhalation of Volatiles in Ambient Air --- X --- Inhalation of Volatiles in Indoor Air --- X --- Ingestion X Dermal contact X Ingestion X Dermal contact X Inhalation of Particulates X Inhalation of Volatiles in Ambient Air X Ingestion X Dermal contact X Surface soils are covered by buildings, pavement, and modern landscaping. Soils are covered by pavement and buildings, therefore no direct exposure is possible for this receptor group. Exposure to soil gas vapors via intrusion into indoor air is possible but unlikely as VOCs were not detected at concentrations exceeding SCOs in offsite soils, and the potential for risk at on-site locations, were impactswere observed, was determined to be low. Groundwater is not present at the surface nor does it appear to enter the basements of off-site structures. Exposure to soil gas vapors from groundwater is possible, only low levels of VOCs were noted in off-site groundwater and the potential for risk at on-site locations where greater levels of impact were observed, were determined to be low. These receptors would not be exposed to surface water (East River). No offsite impacts from the Site are anticipated in surface soils. Although testing results do not indicate elevated levels of MGP constituents in off-site areas, some potential to encounter impact exists in adjacent municipal right of ways. Testing results indicate low levels of several potential MGP constituents and a number of non-mgp constituents in grounwater in off-site areas. There is no indication of MGP impacts in surface water. No indications of migration of COCs from the Site to the river sediments. No indications of migration of COCs from the Site to surface water. Page 1 of 1
73 Figures
 CENTRAL PARK, N.Y. - N.J. 1966 PHOTOREVISED 1979 CONSOLIDATED EDISON COMPANY OF NEW YORK, INC.")
74 SITE LOCATION UNITED STATES GEOLOGIC SURVEY CENTRAL PARK QUADRANGLE NEW YORK - NEW JERSEY 7.5 MINUTE SERIES (TOPOGRAPHY) CENTRAL PARK, N.Y. - N.J PHOTOREVISED 1979 CONSOLIDATED EDISON COMPANY OF NEW YORK, INC. YORK AVENUE FORMER GAS HOLDER SITE SITE LOCATION MAP FIGURE1-1
75
76
77
78
79 FILL - SAND AND SILT FILL FILL FILL FILL SAND, LITTLE TO TRACE GRAVEL MICA SCHIST SAND GRAVEL, SOME SAND MICA SCHIST SAND, BOULDERS, GRAVEL LEGEND CONSOLIDATED EDISON COMPANY OF NEW YORK, INC. YORK AVENUE FORMER GAS HOLDER SITE CROSS SECTION A-A' FIGURE 4-2
80 LEGEND CONSOLIDATED EDISON COMPANY OF NEW YORK, INC. YORK AVENUE FORMER GAS HOLDER SITE GEOLOGICAL CROSS SECTION B-B' FIGURE 4-3
81
82


83


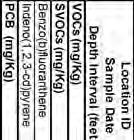


84
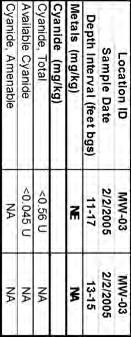


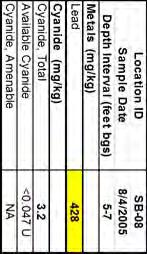


85


86


87
88
89 Appendix A Soil Boring and Monitoring Well Logs
90 SC Soil Boring and Monitoring Well Logs
91


92
93
94


95

96
97
98


99

100