FLINT HILLS SMOKE MODELING TOOL
|
|
|
- Dorthy Pierce
- 5 years ago
- Views:
Transcription
1 FLINT HILLS SMOKE MODELING TOOL 2013 Tallgrass Prairie & Oak Savanna Regional Fire Conference Jan 29, 2013 Tom Gross, Bureau of Air, KDHE
2 Flint Hills Tall Grass Prairie Over 6 million acres of tall grass prairie in eastern Kansas. 2 to 3 million acres are burned each spring. Burning improves cattle weight gain and helps prevent intrusion of invasive woody species. Tall grass prairie ecosystem evolved with fires every few years. Under certain weather patterns, smoke impacts downwind cities. Smoke has caused exceedances of the air quality standards for ozone and particulate matter in Kansas and beyond.

3 Kansas Flint Hills Tall Grass Ecosystem

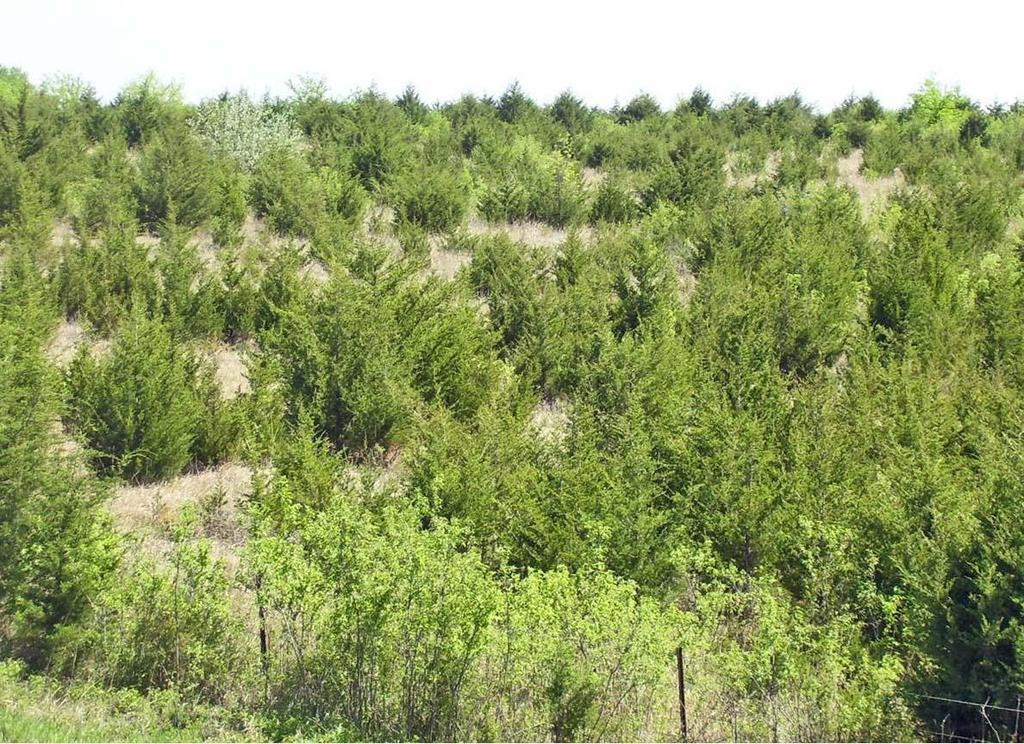
4 Fire Needed Here

5 million acres burned ,018 acres burned Map generated using MODIS data downloaded from NASA website at 5 ENVI and ArcGIS software used for image analysis

6 Safety Is a primary concern.but 6

7 April 11, 2010 Fire and Smoke Plumes 7 Our Vision Healthy Kansans living in safe and sustainable environments.
8 Smoke Management Plan Background 8 KDHE and EPA & KDHE met with ag reps from 2003 to present to work towards solutions. Exceedances occurred in 2003, 2009, 2010 & Commitment to develop Smoke Management Plan in Committee formed and multiple meetings held to create plan during Plan adopted by KDHE in December Outreach and education regarding plan began immediately for April 2011 burn season.
9 The Smoke Management Plan 9 Describes the Tall grass prairie ecosystem and the balance between air quality and the Flint Hills ag economy Is voluntary for prescribed burns of rangeland Includes restrictions on some types of burning in April Outreach activities by KSU, KDHE, KLA, KFB, EPA, and more Includes resources to help land managers and local fire officials make burn decisions A website with tools to predict smoke plume movement Lays groundwork to get monitoring data flagged

10 Forecasting Background Ozone is created from chemical reaction of nitrogen oxides and volatile organic compounds with sunlight. Particles are emitted directly by fires and created via chemical reactions. Movement of smoke can be predicted using weather forecasts and estimates of burning activity. Wind Many fires contributed to peak 8-hour average ozone (84 ppb) in Topeka on April 12, 2011.

11 KsFire.com Website Modeling Home Page

12 Burn Guidance Tools Sonoma Technologies Inc. and KDHE developed tools to provide land managers daily information on when to burn to reduce air quality impacts. Web site: Tools provide daily: Burn guidance by county for the next two days Forecast discussions Extended outlooks County-level burning scenarios

13 April 5, 2011 Model Guidance Maximum contribution based on cumulative impact from potential fires County designated red, yellow or green based on county s contribution Uses forecasted meteorology and expected emissions for large burns

14 Example Guidance Discussion Meteorologists provide additional information on possible smoke impacts and extended outlooks.
15 Example Guidance Individual Plumes Provides hourly plume movement and concentration to assess a burn. Users enter: County Fire size Fuel load Plume is brown Fire location is red Monitors are blue

16 Generating the Guidance STI created a system that runs BlueSky with HYSPLIT each day to predict smoke plume movement and dispersion Smoke plumes are derived from hypothetical burns For individual plumes, burn characteristics are provided by users For cumulative impact, burn characteristics are fixed Smoke emission estimates are generated from BlueSky Framework Weather inputs used by BlueSky are prepared from NCEP North American Model (NAM) 40 km forecast data Hypothetical fire locations The USDA Forest Service BlueSky Framework enables the use of state-of-thescience algorithms for simulating smoke impacts, air quality, and emissions from fires. HYSPLIT is the Hybrid Single-Particle Lagrangian Integrated Trajectory Model, developed by the National Oceanic and Atmospheric Administration s Air Resources Laboratory.

17 Generating the Guidance Hypothetical fires burn each day from 10 AM to 6 PM Concentrations are tracked for 48 hours For individual fires, hourly smoke plumes from each burn are mapped at 15 km resolution For cumulative impact 24-hr surface PM concentrations from all fires are summed by grid cell If contribution is large and downwind concentration is high in city of concern, then the county is colored red


18 Generating the Guidance Summary Meteorology NAM Weather Forecast Converter HYSPLIT-ready Meteorology Fuel Loading HYSPLIT Dispersion run within BlueSky Smoke Guidance Hypothetical Burns Burn Acreage Burn Location BlueSky Framework Emissions Model Fire Emissions Meteorologists Burn Timing

19 NOAA Fire and Smoke Plume Map - April 13, 2011

20 NOAA Visible Satellite Pass April 13, 2011
21 April 2011 Monitoring Results Current Ozone Standard = 75 ppb Date Location Pollutant Concentration April 6, 2011 Mine Creek Ozone 76 ppb April 6, 2011 Wichita - HD Ozone 79 ppb April 6, 2011 Wichita - Peck Ozone 82 ppb April 12, 2011 Konza Prairie Ozone 78 ppb* April 12, 2011 Topeka - KNI Ozone 84 ppb April 13, 2011 KC, Mo Ozone 76 ppb April 13, 2011 Konza Prairie Ozone 79 ppb* April 29, 2011 Peck Ozone 77 ppb *- CASTNET site that is not run by KDHE BOA
22 PPM Why are we concerned? 22 Annual 8 Hour Ozone 4th Highs All 2012 data have not been through QA/QC process NAAQS Standard PPM JFK/KCK Wichita Health Dept KNI/Topeka Cedar Bluff
23 What if the standards are not met? 23 State Implementation Plan (SIP) preparation New rules to reduce NOx and VOCs emissions Must be approved by EPA Federally enforceable Transportation plan conformity with SIP Curtails economic development Potential loss of federal highway funds if transportation plan does not conform with air quality plan Increased costs to consumers Citizens breathing polluted air
24 Exceptional Events Request 24 Flint Hills burning in April of 2011 caused exceedances at Wichita, Kansas City and Mine Creek monitors Monitors impacted for 4 days KDHE developed request to flag the data in 2012 Submitted request to EPA in November 2012 Received letter granting approval in December 2012 April 2011 days will not count in determining compliance with ozone air quality standard
25 Thanks to: 25 KSU Extension and Agronomy Sonoma Technology Kansas Livestock Association Kansas Farm Bureau The Nature Conservancy NRCS Kansas Forest Service EPA Many others
26 26
 296-1692 tgross@kdheks.")
27 Contact Information: Thomas Gross Bureau of Air 1000 SW Jackson, Suite 310 Topeka, Kansas (785) QUESTIONS?