Technical Assignment 2 Building and Plant Energy Analysis
|
|
|
- Tobias McLaughlin
- 5 years ago
- Views:
Transcription


1 Technical Assignment 2 Building and Plant Energy Analysis Des Places Residence Hall Duquesne University Pittsburgh, PA Peter Edwards Advisor: James Freihaut October 4, 2010
2 Table of Contents Executive Summary... 2 Mechanical Summary... 3 Design Load Estimation... 4 Infiltration... 7 Design Air Conditions... 7 Loads and Schedules... 7 Design vs. Computed Block Loads... 9 Annual Energy Consumption and Operating Costs Utility Costs Annual Energy Consumption Monthly Energy Consumption Annual and Monthly Energy Costs Pollution Estimation Appendix A Appendix B Appendix C... 21
3 Executive Summary For this report a building energy model was created for Des Places Residence Hall to better understand the future energy consumption and operating cost of the building. Trane Trace 700 was the program chosen for the energy model. Utility rates from Duquesne University were entered into the program to get a detailed economic report. This report includes the monthly and annual energy consumption and operating cost for the building, as well as a building emissions study. After all of the necessary inputs and information were entered into the model and an accurate simulation was run, the modeled energy loads were compared to the designed heating, cooling and airflow delivered by the current mechanical system. The designed mechanical system for the building has the potential to deliver far more heating and cooling than the loads calculated for the building by the Trace model. This large discrepancy between the designed and modeled loads can be explained by limitations on the mechanical engineer, in terms of what equipment could be used for Des Places. The primary heating and cooling systems use roughly the same amount of energy and combine to take up about 60% of the buildings total, with the lighting and supply fans taking up the majority of the remaining energy. According to the energy model, Des Places will consume 893,668 kwh of electricity and 1,397,382 kbtu of natural gas each year. When the energy consumption figures were converted to operating costs, the percentage for heating dropped significantly from 30% to 18%, while the cost of cooling rose from 30% to 35%. This is because the heating system uses natural gas as an energy source and the cooling system uses electricity. Gas is a cheaper resource than electricity in the Pittsburgh area, so therefore the cooling for the building costs much more to operate than the heating despite the fact that they both use roughly the same amount of energy. Overall the total annual operating cost for Des Places was calculated to be $95,663, which is equivalent to $0.73 a square foot. This cost is fairly inexpensive for a building the size of Des Places.
4 Mechanical Summary The mechanical system for Des Places is a relatively simple design that gives the occupants of the dormitory full control over the spaces they are occupying, while at the same time being energy efficient enough to earn a LEED certification. All of the fully conditioned rooms in Des Places are heated and cooled by four-pipe Whalen fan coil units. These units range in size from 300 CFM to 1200 CFM, depending on the size and loads of the room they serve. The fan coil unit schedule is given in the table below. Floors three through eleven have an almost identical room layout, which allows the fan coil units serving the rooms on these floors to line up vertically and use the same hot and chilled water piping risers. Because fan coil units are used to condition the entire building, only this system and its supporting equipment (such as the pumps, hot water supply and chilled water supply) were analyzed by the energy model. A one-hundred percent outdoor air energy recovery unit supplies all of the necessary outdoor air to the building in order to meet the ventilation requirements for each space as prescribed in ASHRAE Standard The ERU is located in the penthouse and is capable of delivering 20,600 CFM of outdoor air. This quantity far surpasses the total amount of outdoor air needed by all of the rooms in the building. The ERU is equipped with a dessicant wheel that rotates between the return air and outdoor air plenums, in order to pick up a portion of the sensible and latent heat from the return air before it is exhausted out of the building. The supply and exhaust fans in the energy recovery unit and the three supply fans that are used for the stairwell pressurization systems are equipped with a variable frequency drive, so that the fans can adjust to changing airflow demands and save energy throughout their operation. The chilled water and hot water supply are both piped into the building from a central chiller plant and a central steam plant on Duquesne s campus. The chilled and hot water is then circulated throughout the building by base-mounted Taco pumps, located in the basement mechanical room. There are two pumps for each system and all four are equipped with variable frequency drives. Fan Coil Unit Schedule Hot Water Coil Chilled Water Coil EAT Total Sensible Mark CFM Motor HP Max Amp EA DB EWT LWT Total MBH DB WB EWT LWT MBH MBH Make/Model FC-A Whalen/3022 FC-B Whalen/4022 FC-C Whalen/6022 FC-D Whalen/8022 FC-E Whalen/12022 Table 1: Fan coil unit schedule
5 Design Load Estimation Trane Trace 700 was used to model the energy consumption of Des Places Residence Hall. This program provides an in depth analysis of a buildings energy consumption, design loads and performance and is relatively user friendly. A combination of individual room and block loading was used to model this building. Block loading was done for floors three through eleven, because they have nearly identical room layouts. Individual rooms were created for floors one, two and twelve where the room layout is completely unique. By combining these two methods, an accurate energy model was produced without wasting time creating rooms that are identical for nine floors of the building. All of the information necessary to create this model was found in the drawings and specifications for Des Places. The rooms in Des Places were split up into seven major categories for the energy model, based on their occupancy type. The seven room types used in the model are listed in the table below, followed by floor plans that show what classification each room was given. The default category was used for spaces that are not fully conditioned, such as the mechanical and storage rooms. Energy Model Occupancy Types Color Occupancy Type Bedroom/Living Room Corridor TV Lounge Laundry Office Conference Room IDF Default Table 2: Color legend for energy model occupancy types


6 Figure 1: Occupancy types used on Floor 1 Figure 2: Occupancy types used on Floor 2


7 Figure 3: Occupancy types used on Floors 3-11 Figure 4: Occupancy types used on Floor 12
8 Infiltration Infiltration for Des Places was assumed to be 0.1 air changes per hour. This is achieved by tight construction with a positive pressure in the building, relative to the ambient pressure outside. This is an accurate assumption, because Des Places is a brand new building that utilizes high quality products and construction practices for the exterior envelope. Design Air Conditions Des Places Residence Hall is located within the city limits of Pittsburgh, PA so the outdoor design conditions for Pittsburgh were used for this energy model. Weather data for cities across the United States is given in the ASHRAE Fundamentals handbook. The ASHRAE design conditions for Pittsburgh are given in the table below. Outdoor Air Design Conditions Summer Conditions Winter Conditions Clearness Dry Bulb Wet Bulb Dry Bulb Number Ground Reflectance 86 F 71 F 5 F Table 3: Outdoor air design conditions used for Trace model The indoor design conditions for Des Places were obtained from the mechanical designer, CJL Engineering. These figures are shown in the table below. Indoor Design Conditions Cooling Dry Bulb Setpoint 75 F Cooling Dry Bulb Driftpoint 78 F Heating Dry Bulb Setpoint 72 F Heating Dry Bulb Driftpoint 64 F Relative Humidity 50% Table 4: Indoor air design conditions used for Trace model Loads and Schedules The internal loads for all of the rooms in the building are based on the type of space and its function. Lighting loads and miscellaneous loads were provided by CJL Engineering and the heat load from the occupants was based on the occupancy category of the room. The table below shows the various loads in each room type. Appendix C shows three samples of different load inputs in the Trace software.
9 Internal Loads by Occupancy Type Lighting Heat Gain (W/SF) Misc. Heat Gain People Sensible Load (BTU/hr) People Latent Load (BTU/hr) Bedroom/Living Room W/SF Conference Room W Corridor W 0 0 IDF W/SF 0 0 Laundry W Office W TV Lounge W Default W/SF 0 0 Table 5: Internal loads by occupancy type For the dormitory rooms in the building, a custom schedule was created to better characterize the use of the spaces. This schedule was adapted from the existing apartment lighting schedule found in Trace. The only rooms in the building that do not utilize this schedule to characterize their use are the offices. For these spaces, the typical office lighting schedule given in Trace was used. Both of these schedules are shown in the tables below. Des Places Dormitory Lighting Schedule Start Time End Time Percentage Midnight 6:00 AM 10 6:00 AM 7:00 AM 20 7:00 AM 9:00 AM 50 9:00 AM 7:00 PM 40 7:00 PM 10:00 PM 90 10:00 PM 11:00 PM 70 11:00 PM Midnight 30 Table 6: Des Places dormitory lighting schedule Typical Office Lighting Schedule Start Time End Time Percentage Midnight 6:00 AM 0 6:00 AM 7:00 AM 10 7:00 AM 8:00 AM 50 8:00 AM 5:00 PM 100 5:00 PM 6:00 PM 50 6:00 PM 7:00 PM 10 7:00 PM Midnight 0 Table 7: Typical office lighting schedule The occupancy of the rooms in Des Places was categorized in the same manner as the lighting. For the occupancy schedule of the majority of the building a custom schedule was created from the existing one in Trace, made for a typical apartment complex. An existing occupancy schedule was used for the office space. Both of these tables are given below.
10 Des Places Dormitory Occupancy Schedule Start Time End Time Percentage Midnight 7:00 AM 90 7:00 AM 9:00 AM 60 9:00 AM 5:00 AM 40 5:00 PM 6:00 PM 60 6:00 PM Midnight 90 Table 8: Des Places dormitory occupancy schedule Typical Office Occupancy Schedule Start Time End Time Percentage Midnight 7:00 AM 0 7:00 AM 8:00 AM 30 8:00 AM 5:00 PM 100 5:00 PM 6:00 PM 30 6:00 PM 7:00 PM 1 7:00 PM Midnight 0 Table 9: Typical office occupancy schedule Design vs. Computed Block Loads The entire building was modeled and simulated using Trane Trace 700. For this report the capabilities of the fan coil units and the energy recovery unit will be discussed and compared to the modeled heating and cooling loads and required airflows for the building, as calculated in Trace. Table 10 below summarizes the total cooling load, heating load and supply airflow for the entire building and compares it to the heating capability, cooling capability, and total supply airflow of all the fan coil units in the building. This table also compares the total ventilation airflow calculated in Trace to the maximum amount of outdoor air coming from the energy recovery unit. Table 11 uses a few sample rooms and blocks and makes the same comparisons as Table 10, using the calculations performed by Trace for those individual rooms or blocks. The total heating and cooling capability as well as the supply airflow for the FCUs was attained from the fan coil unit schedule in the mechanical drawings. The total outdoor airflow supplied to the building by ERU-1 was found in the energy recovery unit schedule. The outdoor airflow supplied to each room or block was found by adding up the total CFM coming out of all of the supply registers in that space. The airflow coming out of the supply diffusers is an accurate estimate of the total designed ventilation airflow, because all of the supply ductwork in the building connects to ERU-1 in the penthouse, which brings in 100% outdoor air. Comparisons by System Cooling Heating Supply Airflow Ventilation Airflow Design (MBh) Modeled (MBh) Design (MBh) Modeled (MBh) Design (CFM) Modeled (CFM) Design (CFM) Modeled (CFM) Fan Coil Units 2,421 1,452 3,624 1,200 92,100 51,266 20,600 17,667 Table 10: Design vs. modeled load comparison by system
11 Comparisons by Rooms and Blocks Cooling Heating Supply Airflow Ventilation Airflow Design Modeled Design Modeled Design Modeled Design Modeled (MBh) (MBh) (MBh) (MBh) (CFM) (CFM) (CFM) (CFM) 211A - Bedroom A B-1104B - Bedrooms Lounge Table 11: Design vs. modeled load comparison for sample rooms and blocks Table 10 shows that the designed heating and cooling capability of the fan coil units in Des Places far outweighs the total designed heating and cooling loads. This large discrepancy gives the appearance of either a poor energy model or some significant errors made during the design process. However there is a justification for the fan coil units being so oversized in comparison to the loads. According to Tony Valenza, a mechanical engineer for CJL Engineering who worked on the Des Places project, Duquesne University specifically required the use of Whalen fan coil units to heat and cool the building. The owner wanted fan coil units in each room, so that the students could have personalized control of the temperature in whatever space they were occupying. Furthermore they specifically required Whalen units, because they had used them in other buildings and found that they were very reliable. The smallest fan coil unit that Whalen makes has a heating coil capacity of 12 MBh and a cooling coil capacity of 8.1 MBh. The vast majority of rooms in Des Places had calculated loads that were far less than these values. This trend can clearly be seen in Table 11, with the individual bedroom and the block of similar bedrooms. Therefore most of the rooms in the building had FCUs that were oversized, and these all added up to make a building design load that was much larger than the modeled load. Another reason for the discrepancy between the design load and the modeled load for the building was the fact that the templates made for all of the rooms and blocks in the Trace model, used internal loads that described typical usage for that type of space. In the actual design of the building, the engineers were more cautious and designed for a worst case scenario so that the heating and cooling loads in each space would not exceed the capability of the fan coil unit. This resulted in the use of fan coil units that were slightly oversized even in the rooms that had heating and cooling loads that surpassed the capability of the smallest available Whalen FCU. This design strategy is seen in the comparison of designed and modeled loads for room 1202 in Table 11. The design and modeled supply airflow for the building differ greatly for the same reason as the heating and cooling loads. Most of the spaces have oversized FCUs because their required supply airflow is far less than 300 cfm, the amount produced by the smallest Whalen fan coil unit. This scenario was true for 227 out of a total of 264 FCUs used in Des Places. The required ventilation found by the Trace model was much closer to the total ventilation delivered in the actual design of Des Places, because the ventilation in the building relied on a
12 completely separate system. The energy recovery unit brings in 20,600 cfm of outdoor air into the building. This is only 14% more than the required amount of outdoor air found by the energy model. The designers were not limited in choosing an ERU like they were with the fan coil units, so they could choose a unit that closely matched the amount of outdoor air that they found in their energy model. Annual Energy Consumption and Operating Costs The annual energy consumption and operating costs for Des Places was calculated using the Trace model created for the building. Utility rates for chilled water, hot water and electricity were provided by CJL Engineering. The energy model created by the engineers that worked on Des Places could not be attained. Therefore their energy model could not be compared to the one created for this report. Utility Costs The utility costs for Des Places were given to CJL Engineering by the owner Duquesne University. The electric cost is the average rate that the university currently pays to Duquesne Light, the primary provider of electricity in the Pittsburgh area. The natural gas cost is also an average rate that Duquesne pays from their supplier. The costs for electricity and natural gas are given in Table 12. For the natural gas rate a therm is equal to 100,000 BTUs. Energy Type Electricity Natural Gas Utility Costs Cost ($/KWh) ($/therm) Table 12: Duquesne University utility costs The utility rates listed above were used to calculate the yearly and monthly operating costs of Des Places. They are assumed to be an accurate representation of what Duquesne University pays for energy. Annual Energy Consumption The annual energy consumption for the entire building is broken down into major categories in Table 13 below. These values were found in an energy consumption report calculated by the Trace model. The boilers that power the heating system use gas and the chillers that are used for
13 the cooling system were assumed to be electric. All of the major mechanical and electrical systems are powered by electricity except for the primary heating. Annual Energy Consumption Electrical Consumption (kwh) Gas Consumption (kbtu) Primary Heating 1,397,382 Heating Accessories 13,770 Primary Cooling 387,640 Cooling Accessories 3,854 Pumps 24,152 Supply Fans 201,090 Lighting 263,162 Table 13: Annual energy consumption by system All of the primary systems in Des Places that require some form of energy are shown in relationship to one another in Figure 5. The entities that were measured in kwh were converted to kbtu, so that all of the systems could be accurately compared. The figure below shows that the primary heating and cooling take up the majority of energy being used in the building. The lighting and supply fans used in the mechanical system take up most of the remaining energy, while the other entities use a negligible amount. This finding makes sense for Des Places for several reasons. The lighting should not take up that much of the total energy load, because a variety of efficient fixtures such as LED and High Output T5 lamps were used throughout the building. The fans should also not have a very high load, because there are very few that require more than 2 hp to operate, and the ones that do utilize VFDs so that they run more efficiently. The cooling and heating will use most of the energy in the building because the oversized fan coil units in the bedrooms and living rooms will not be running efficiently when they are not operating near full load.

14 Figure 5: Pie chart showing percentages of total energy use Monthly Energy Consumption The electricity, gas and water consumption is broken down by month in Table 14. The monthly electric and gas demand is also shown below. This data was found in the monthly energy consumption report given by the Trace model. The electricity consumption for Des Places remains fairly constant throughout the year, while the gas consumption is highest in the coldest months. This trend makes sense because the natural gas is only used for the hot water system that provides heating to the building. Another noticeable trend in the data is the water usage dramatically rising in the warmer months of May, June, July, August and September. This is most likely because of the increased demand for cooling during this period. The cooling system for Des Places uses chilled water as its working fluid, so more make-up water is needed when the cooling load is at its peak, thus raising the total water consumption of the entire building. Monthly Utility Consumption and Demands Jan Feb Mar April May June July Aug Sept Oct Nov Dec TOTAL Electric Consumption (kwh) 46,715 41,806 48,952 51,498 57,009 42,104 44,866 43,106 54,229 52,459 48,714 47, ,086 Electric Demand (kw) Gas Consumption (therms) 2,452 2,403 1,908 1, ,208 1,407 2,253 14,581 Gas Demand (therms/hr) Water Consumption (gal) 5,000 4,000 5,000 12,000 50,000 63,000 83,000 58,000 53,000 10,000 4,000 5, ,000 Table 14: Monthly utility consumption and demand
 20,000 10,000 0 Months Figure 6: Bar graph showing total monthly electrical consumption Figure 7: Bar graph")
15 Jan Feb Mar April May June July Aug Sept Oct Nov Dec kwh The monthly trends in electricity and gas consumption are more clearly illustrated by the bar graphs below in figure 6 and 7. 60,000 Monthly Electrical Consumption 50,000 40,000 30,000 Electric Consumption (kwh) 20,000 10,000 0 Months Figure 6: Bar graph showing total monthly electrical consumption Figure 7: Bar graph showing total monthly gas consumption
16 Annual and Monthly Energy Costs The energy costs shown in the table below were calculated using the rates given by Duquesne University, as listed in table 12. The figures in Table 15 show how the percentages of energy use change when the energy consumption is converted to an actual operating cost. Table 15 shows that natural gas is currently a cheaper resource than electricity in the Pittsburgh area. This is clearly seen in the comparison between primary heating and primary cooling. When the two energy totals are converted to the same units, they both end up consuming roughly the same amount of energy (each use approximately 30% of the buildings total). When the energy consumption is translated into an annual operating cost, the entity that uses natural gas (heating) drops significantly in percentage to 18.7%, while the system that uses electricity (cooling) increases to 35.3%. Annual Energy Cost Electrical Consumption (kwh) Gas Consumption (kbtu) Percentage of Total Energy Cost Percentage of Total Cost Primary Heating 1,397, % $ 17, % Heating Accessories 13, % $ 1, % Primary Cooling 387, % $ 33, % Cooling Accessories 3, % $ % Pumps 24, % $ 2, % Supply Fans 201, % $ 17, % Lighting 263, % $ 22, % TOTAL 893,668 1,397, % $ 95, % Table 15: Annual energy cost by system The total yearly operating cost for all of the significant mechanical and electrical systems in Des Places is $95,663. This building therefore requires $0.73 a square foot to operate annually. This is a very low figure in relation to other buildings of its size, which indicates that Des Places was designed with a strong emphasis on sustainability. Figure 8 gives a clear representation of how the total operating cost of the building is split up between the different systems. Primary cooling is by far the most expensive system, which makes it the most important to the owner in terms of energy costs. This system should be evaluated first and foremost if Duquesne tries to reduce the operating cost of the building in the future.
17 Figure 8: Pie chart showing percentages of total operating costs A monthly cost for the buildings gas and electricity consumption was calculated using the same method as the annual cost figures given in Table 15. The energy rates for gas and electricity were multiplied by the monthly consumption figures given in the Trace model. The graph below shows that the total cost for gas is always less than electricity, especially in the summer months when very little heating is needed for the building. The yearly trends for gas and electricity cost follow the same pattern as the monthly consumption values shown in figures 6 and 7. Figure 9: Bar graph showing monthly gas and electricity costs
18 Pollution Estimation Values for the emission calculations were taken from Table 10 and Table B-10 in the 2007 edition of Regional Grid Emission Factors. Both of these tables can be found in Appendix B. Table 10 provides emission factors for on-site combustion. This table was used to calculate the values in Table 16 below, that relate the amount of natural gas Des Places consumes to the amount of pollutants the building produces. For this table it was assumed that a stationary reciprocating engine was responsible for powering the boilers at Duquesne s central steam plant. This central plant provides the necessary steam to Des Places, where it is then converted into hot water on site. Because Des Places uses a unique method of producing hot water, these combustion emission calculations are only a rough estimate. In reality the emission values would be higher, because of the transmission losses associated with a central plant. Combustion Emission Factors For a Gas Fired Boiler Pollutant lb/1000 ft ft 3 of gas/year lb of Pollutant/year CO 2e ,746 CO ,128 CH ,222 N 2 O NO X ,190 SO X CO ,339 VOC Lead 5 * Mercury 2.6 * PM Table 16: Combustion emission factors for a gas fired boiler Table 17 shows the emissions associated with the electrical consumption of Des Places. The concentrations for each compound vary by state and are associated with the amount of pollutants that a power plant releases into the air in order to produce enough electricity for a given building. The pollutant values for electricity are much higher because the building consumes more electricity than natural gas and because delivering electricity from a power plant is much less efficient than burning gas to power a boiler.
19 Combustion Emission Factors For Generated Electricity Pollutant lb/kwh kwh/year lb/year CO 2e , ,583 CO , ,047 CH ,086 1,564 N 2 O , NO X ,086 1,685 SO X ,086 5,142 CO , TNMOC , Lead 1.17 * , Mercury 2.70 * , PM , Solid Waste , ,077 Table 17: Combustion emission factors for generated electricity
20 Appendix A List of Tables and Figures Figures Figure 1: Occupancy types used on Floor 1 Figure 2: Occupancy types used on Floor 2 Figure 3: Occupancy types used on Floors 3-11 Figure 4: Occupancy types used on Floor 12 Figure 5: Pie charts showing percentages of total energy use Figure 6: Bar graph showing total monthly electrical consumption Figure 7: Bar graph showing total monthly gas consumption Figure 8: Pie chart showing percentages of total operating cost Figure 9: Bar graph showing monthly gas and electricity costs Tables Table 1: Fan coil unit schedule Table 2: Color legend for energy model occupancy types Table 3: Outdoor air design conditions used for Trace model Table 4: Indoor air design conditions used for Trace model Table 5: Internal loads by occupancy type Table 6: Des Places dormitory lighting schedule Table 7: Typical office lighting schedule Table 8: Des Places dormitory occupancy schedule Table 9: Typical office occupancy schedule Table 10: Design vs. modeled load comparison by system Table 11: Design vs. modeled load comparison for sample rooms and blocks Table 12: Duquesne University utility costs Table 13: Annual energy consumption by system Table 14: Monthly utility consumption and demand Table 15: Annual energy cost by system Table 16: Combustion emission factors for a gas fired boiler Table 17: Combustion emission factors for generated electricity


21 Appendix B Emission Factor Data

22 Appendix C Trane Trace 700 Inputs Sample Internal Load Templates
23
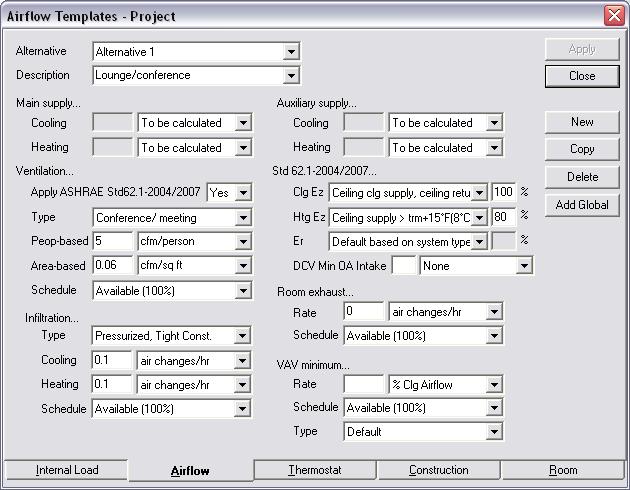
24 Sample Airflow Templates
25
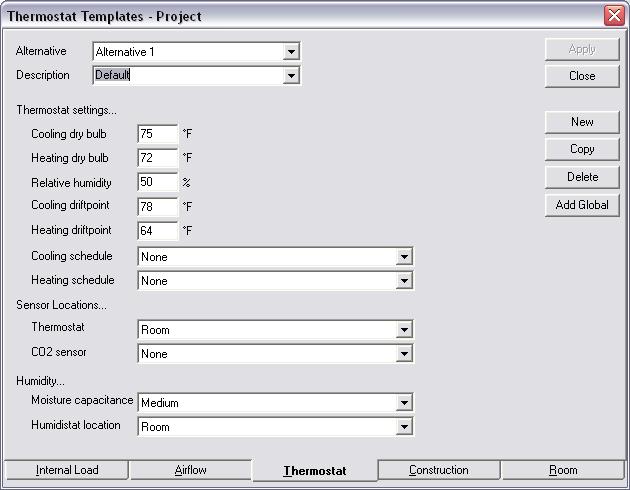
26 Thermostat Template

27 Sample Construction Templates


28 Bayseal Wall Assembly Fan Coil Units System Schematic