Disinfection Approaches and Applications
|
|
|
- Clifford Patterson
- 5 years ago
- Views:
Transcription


1 Disinfection Approaches and Applications Jay Maggi, P.E. October
2 Presentation Outline History of Disinfection Drivers and Considerations Disinfection Approaches Chlorine/Chloramination Ozone UV Disinfection Project Examples / Case Studies 2
3 History of Disinfection (Early Case Study) Discovering and preventing the problem John Snow in 1850 investigated a cholera outbreak in London, England He deduced that the source of the disease was contaminated well water
4 History of Disinfection (Early Case Study Continued) To prove his hypothesis, he removed the pump handle......no pump handle, no more well water......when the people began to obtain water from other sources, the epidemic stopped!
 So")
5 Public Water Supply Disinfection Practices: 100 Years and Counting Widespread chlorination of drinking water did not begin until the 20th century The first continuous chlorination of municipal drinking water began in 1902 (the town of Middlekerke, Belgium) Sodium hypochlorite was used in 1908 to provide the first continuous disinfection of municipal drinking water in the U.S. The first plant to use Ozone was in 1906 (Nice France) ACE It is a matter of common knowledge nowadays that the ultraviolet rays have a strong bactericidal power. 1930s filtration plus chlorine disinfection virtually eliminates waterborne illnesses in US
6 Primary and Secondary Disinfection Originally, no distinction was made between: the disinfectant initially used to kill organisms, and the residual disinfectant that was used to protect the distribution system Distinguishing between a primary and secondary disinfectant became important with the discovery of potentially carcinogenic byproducts


7 Recent Timeline for Key Disinfection Regulations Milwaukee Crypto Outbreak -IESWTR -Stage 1 DDBP LT1ESWTR Draft UVDGM LT2ESWTR Final UVDGM -LT2ESWTR Operational Compliance Dates -Stage 2 DDBP Round 2 Crypto Sampling Seattle Public Utilities New York City DEP
8 Surface Water Treatment Rule (SWTR), 1989 Reduce potential for pathogens in drinking water Applies to surface water and GWUDI public water systems Fixed treatment requirements for filtration and disinfection: 3 log removal/inactivation of Giardia (CT tables) 4 log removal/inactivation of viruses (CT tables) Turbidity 0.5 NTU for partial credit through filtration Residual disinfectant concentration throughout distribution system Filtration avoidance criteria for unfiltered systems

 LT2ESWTR, 2006 Focused on Cryptosporidium")
9 Enhanced Surface Water Treatment Rules IESWTR, log Cryptosporidium removal credit for filtered water turbidity of 0.3 NTU, monitor individual filters LT1ESWTR, 2002 Applies IESWTR to small systems (<10,000 population) LT2ESWTR, 2006 Focused on Cryptosporidium sampling, bin assignment, treatment to match risk


10 Overview of Key LT2ESWTR Requirements Disinfection Profiling And Benchmarking Ensure proposed changes in disinfection do not compromise current inactivation of pathogens Source Water Microbial Monitoring Monitor to determine Cryptosporidium and/or indicator levels Uncovered Finished Water Reservoirs Systems with uncovered reservoirs must either cover or treat to provide removal/inactivation of virus, Giardia, and Crypto Treatment Bins and the Microbial Toolbox Assignment to bins based on monitoring results. Implement treatment based on the requirements for each bin, choosing from a set of treatment options. Additional Monitoring Monitor again to confirm or revise bin classification
11 LT2ESWTR Requirements Depend on Source Water Cryptosporidium
12 Example Round 2 Sampling = Bin 2


13 Multiple Treatment Alternatives Available 2- Stage Lime Softening Enhanced Ozone Disinfection Combined Filter Effluent Individual Filter Effluent Watershed Protection UV Disinfection
14 LT2ESWTR Microbial Toolbox Watershed Control Program Pre-filtration Pre-sedimentation basin with coagulation Bank filtration 2-stage lime softening Alternative Source/ Intake Management Treatment Performance Combined filter performance Individual filter performance Demonstration of performance Inactivation UV Ozone Chlorine dioxide Additional Filtration 2 nd -stage filtration Membranes Bag and cartridge filters Options can be used singly or in combination Systems must meet specific criteria for credit Slow sand filters

15 Stage 1 D/DBP Rule MCLs for DBPs THMs / HAAs 80/60 µg/l based on running annual average Bromate 10 µg/l Chlorite 1 mg/l MRDLs for Disinfectants 4 mg/l for free and combined chlorine 0.8 mg/l for chlorine dioxide Profiling and benchmarking to ensure that current disinfection is not compromised

16 Stage 1 DBP Rule Enhanced Coagulation TOC Removal TOC 0 <60 mg/l >60 <120 mg/l >120 mg/l Alkalinity Alkalinity Alkalinity mg/l 35% 25% 15% mg/l 45% 35% 25% > 8.0 mg/l 50% 40% 30%
, different from Stage 1 running annual average (RAA) method for the system as a whole DBP Total Trihalomethanes Haloacetic Acids (5) Regulated Level (ppb)")
17 Overview of Stage 2 DBP Rule Requirements Compliance based on samples using compliance locations from the IDSE Location specific: location running annual average at each sample site (LRAA), different from Stage 1 running annual average (RAA) method for the system as a whole DBP Total Trihalomethanes Haloacetic Acids (5) Regulated Level (ppb) 80 60


18 New Treatment Challenges Non-Regulated Disinfection Byproducts Contaminants and Pathogens of Emerging Concern Raw Water Ammonia Taste & Odor Algal Toxins PFOS/PFOA Increased Public Awareness and Scrutiny Large Distribution System with Reduced Demands Greater Water Storage Requirements Nitrification Limited O&M Budgets
19 History of Free and Combined Chlorine 1900s-1940s, both commonly used and viewed as effective disinfectants Since 1943, free chlorine understood to be more effective Result: The use of chloramines declined 1943 mid 1970s 19
20 Free vs Combined Chlorine History Mid-70s: Free chlorine produces many more byproducts than chloramines Result: Increased chloramine use Free for primary disinfection, combined for distribution Based on a survey conducted in 2005, 29 percent of the investigated utilities in the United States were using chloramines as secondary disinfectants EPA: More than one in five Americans uses drinking water treated with chloramines 20
21 Chlorine Storage and Feed Compressed elemental gas Sodium hypochlorite solution, NaOCl On-site sodium hypochlorite generation Solid calcium hypochlorite, Ca(OCl) 2 21
22 Determining Disinfection Requirements CT VDH Waterworks Regulations, Section 12VAC Disinfection. 2. Residual and contact time. a. Waterworks with surface water sources shall provide a minimum residual (C) and contact time (T) as calculated in accordance with Appendix L. Appendix L contains information on CT calculations and methods, as well as information on contact tank baffling arrangements. b. Waterworks with groundwater sources shall provide a minimum 30 minute hydraulic detention period (based on design flow) for chlorine contact. 22
23 Determining Disinfection Requirements Required Inactivation Levels per Table L-1 for Conventional Treatment Giardia: 0.5 log inactivation Viruses: 2.0 log inactivation Free chlorine much more effective for virus inactivation Giardia governs Comply with CT values C = the residual concentration in mg/l T = the contact time in minutes The contact time to be used for calculating CT is T10, which is defined as the detention time at which 90 percent of the water passing through a unit is retained within that unit 23
24 Determining Disinfection Requirements Determining T10: Tracer study Minimum of four flow rates to span the range of operation, with one near average flow, two greater than average, and one less than average. Calculated When T10 values are calculated, the theoretical, hydraulic detention time in a particular unit is reduced by some fraction, the magnitude of which is dictated by the degree of short-circuiting that is possible within that unit. The T10/T ratios associated with each degree of baffling are summarized in Table L-8. 24
25 25
26 Example: Determining Log Inactivation with Free Chlorine Chlorine which is added just prior to the contact unit and the flow rate, ph, chlorine residual, and water temperature are assumed to be 1.5 MGD, 7.5, 1.0 mg/l, and 5 degrees C, respectively. The contact unit has a baffled inlet, intrabasin baffles, and a theoretical detention time of 90 minutes. T 10 /T = 0.5 (see Table L-8) T 10 = 0.5 X 90 minutes = 45 minutes CT calc = 1.0 mg/l x 45 minutes = 45 mg-min/l Required inactivation is 0.5 logs since this particular disinfection process follows a conventional water treatment plant. From Table L-3, 5 C At ph = 7.5, C = 1.0 mg/l and CT calc = 45 mg-min/l, interpolate the log inactivation. CT calc of 45 mg-min/l falls between CTs of 30 (0.5 log) and 60 (1.0 log) mgmin/l. The corresponding log inactivation would be as follows: [(45-30)/60-30) X ( )] = 0.75 logs 26
27 27 CT
28 Why Chloramines? Chloramines are much less effective than chlorine for disinfection: by more than a factor of 10 for Giardia and more than a factor of 100 for viruses However, chloramines: Are able to persist much longer than free chlorine Are better able to penetrate biofilms Work well with free chlorine or other primary disinfectants to provide a one-two punch Do not form significant amounts of THMs 28
29 Process Chemistry HOCl + NH3 HOCl + NH2Cl HOCl + NHCl2 NH2Cl (monochloramine) + H2O NHCl2 (dichloramine) + H2O NCl3 (trichloramine) + H2O
30 Process Chemistry Monochloramine Total Combined Chlorine (%) Nitrogen Trichloride Dichloramine ph

31 Typical Breakpoint Curve for ph
32 Operating with Chloramines Setting the correct CL:AM ratio Too Low (<3.5:1) will leave excess ammonia Too High (>5:1) can cause taste and odor problems Most utilities operate between 3.5:1 and 5:1 Operating at approximately 4.5:1 appears to be the optimal range for most utilities Avoid low ph Effective mixing is key!!! Chlorine first, then ammonia, each with good mixing Avoid pockets of high chlorine and low ammonium 32
33 Ozone Disinfection Relative oxidation power ozone chlorine dioxide free chlorine monochloramine Rapid decay need an additional disinfectant for residual maintenance in the distribution system
34 Disinfection Effectiveness Viruses Bacteria Giardia Crypto. Monochloramine x x x Free Chlorine x Chlorine Dioxide (x) Ozone
35 Ozone Disinfection Like chlorine, ozone disinfection is achieved by a combination of: disinfectant concentration contact time with the disinfectant CT concept tables available to relate CT value to various degrees of microbial kill, expressed in log units C/C o = 1/100 or 0.01 or 10-2 or 2-log or 99% removal
36 10 Giardia Crypto. Viruses CT (mg-min/l) Temperature ( O C) CT Values for 2.0-log Inactivation circa 1997
37 Finch CT (mg-min/l) Temperature ( O C) CT Values for 2.0-log Crypto.
38 80 CT (mg-min/l) EPA Regulations (adopted in 2006) Temperature ( O C) CT Values for 2.0-log Crypto. circa 2006 Long Term 2 ESWT Rule
39 Advantages of Ozone Relatively strong disinfecting power Potentially better flocculation and filtration performance Reduced formation of disinfection by-products reduction of THM precursors prior to chlorination for residual maintenance limited type of oxidation by-products Use in combination with a catalyst to enhance effectiveness (UV, hydrogen peroxide)
40 Advantages of Ozone Oxidation/volatilization of organics including taste and odor causative compounds partial oxidation of organics for subsequent removal by microbes Color reduction Algae control
41 Disadvantages of Ozone Rapid decomposition an additional chemical is needed for residual maintenance Generate ozone on-site as it cannot be stored Increased potential for bacterial regrowth in the distribution system control with biological filtration control with chlorine
42 Disinfection By-product Control Ozone related DBPs bromate minimal bromide in source water (< 30 ng/l) aldehydes formaldehydes biodegradable and managed in biologically active carbon filters
43 Theory of Ozone Generation Ozone production in an electrical field Oxygen molecules are split within an electric field Oxygen atoms combine with oxygen molecules Ozone molecule
44 Theory of Ozone Generation Ozone exists as a gas at temperatures and pressures typical of water treatment Must be generated on site using high voltage electric discharge through an oxygen-laden gas corona discharge heat generated by process (need to manage)
45 Ozone Design Considerations Feed gas type/source (e.g., on-site oxygen generation, LOX storage and supply contract) Feed gas preparation Ozone generator Ozone addition/contact Off-gas destruction (Disinfection by-product control) (Assimilable organic carbon control) Safety


46 UV Disinfection Lamp Technologies Low-Pressure, High Output (LPHO) Lower energy use Monochromatic 254nm Lamp Life: >12,000 hours Larger reactor, more lamps Medium Pressure (MP) Higher energy use Polychromatic light nm Lamp Life: 5,000-9,000 hours Smaller reactor, fewer lamps

 >>> target organisms (Crypto) Need to account for these differences to avoid")

47 Addressing Low Wavelength Issues for Medium Pressure UV Lamps WRF/EPA/AWWA Project 4376 (Linden et al., 2015) Wavelengths < 240 nm Inactivation of validation test organisms (MS2, T1UV, T7) >>> target organisms (Crypto) Need to account for these differences to avoid overstating UV reactor disinfection performance with respect to Cryptosporidium Look up tables developed with most conservative ASCF F(Log I, UVT, Validation Organism, Sleeve Type, Validation Water Source) Variable ASCF Equation F(Log I, UVT)
48 What is UV Advanced Oxidation? Definition: water treatment with the use of UV light (photolysis) in combination with hydroxyl radical (advanced oxidation) Hydrogen peroxide fed upstream UV light destroys photosensitive compounds UV light converts H 2 O 2 to OH. radical: Hydroxyl radical = very powerful oxidant Destroys contaminants other technologies transfer them to another phase
49 UV AOP is a combination of Oxidation and Photolysis Chemical Log Reduction per Unit of Power Draw TCE UV-Oxidation UV-Photolysis NDMA 1,4-Dioxane ppm H2O2 14 ppm H2O2 7 ppm H2O2 14 ppm H2O2 7 ppm H2O2 14 ppm H2O2 *Courtesy of Trojan Technologies, Inc.
50 UV AOP Removes T&O Compounds 1.00 FIGURE 2: Lake Skinner Water: UV AOP Performance for Geosmin Removal (March 1, 2005) log Crypto Dose y = x R 2 = Log Geosmin Removal y = x R 2 = UV AOP with Peroxide Dose of 11 mg/l UV AOP with Peroxide Dose of 6 mg/l UV Alone (No Peroxide Added) Collimated Beam UV Dose (mj/cm 2 )
51 Design Flexibility Example UV + UV AOP Operation Disinfection Only UV AOP Mode UV Off UV 100% Power UV 30%-50% Power UV 100% Power H 2 O 2 Pathogens Algal Toxins MIB, Geosmin Pathogens

52 UV Disinfection or UV AOP is also a critical treatment process for water reuse applications COAGULANT HYDROGEN PEROXIDE LIME CO2 CHLORINE SECONDARY EFFLUENT FROM EXISTING WWTP RECYCLED WATER TO USERS SLUDGE BACKWASH CONCENTRATE PRETREATMENT MEMBRANE FILTRATION REVERSE OSMOSIS UV ADVANCED OXIDATION STABILIZATION AND DISINFECTION
53 F.J. Horgan Water Treatment Plant Direct filtration plant in Toronto Raw water from Lake Ontario Expansion to meet increased demands Pre-ozonation to address more stringent treatment regulations and taste and odor events Treatment Objectives - Ozone System Year-round primary disinfection of 1.0-log Giardia inactivation and 3.0-log virus inactivation Seasonal taste and odor control to reduce geosmin
54 Horgan WTP Treatment Process O3 SBS Cl2 Lake Ontario Raw Water Pump Station Ozone Contact Tanks Flocculators Biologically Active Filters Cl2 Clearwell / Reservoir NH3 Treated Water Pump Station Coagulant F


55 Ozone System Equipment Typical Equipment

56 Ozone System Equipment Typical Equipment


57 Ozone System Equipment Typical Equipment
58 Ozone Gas Dissolution System Function: uniformly disperse ozone into the main process flow stream Fine Bubble Diffusion was selected Challenging gas flow range: o Maximum gas flowrate: 715 scfm (1 atm, 20 C) o Minimum gas flowrate: 33 scfm (1 atm, 20 C) o Turn down ratio: 22:1 Typical flow range of each diffuser: 0.3 to 1.5 scfm o Less than 0.3 scfm: uneven distribution flow among diffusers o Greater than 1.5 scfm: the headloss per diffuser becomes excessive; potential for coalescing fine bubbles and reducing transfer efficiency
59 Loop A Loop B Loop A Loop B Diffuser Arrangement At maximum ozone gas flowrate, all four loops in each tank are online Ozone Contact Tank Cell 1 Cell 2 Cell 3 At minimum ozone gas flowrate, one Loop A in each tank is online Water Water O3 N.O. N.O. N.O. N.O.
60 Dissolved Ozone Sampling System Typical configuration o Measure the dissolved ozone residuals o Provide dissolved ozone data to SCADA for calculation of CT o Monitor the quenching process AIT AIT AIT AIT AE AE AE AE Ozone Contact Tank
61 City of Appleton, WI Future Regulations Drive Decisions LT2ESWTR Desire for enhanced Crypto, Giardia, and Virus disinfection Review of available alternatives Ultrafiltration Ozonation Ultraviolet Light Technical Advisory Group Formation and Recommendation Ultraviolet light disinfection
 65 Ozone (T&O, Algae Toxins, Virus,")
62 Multi-Barrier Protection in Wisconsin Lake Michigan: Bin 1 Lake Winnebago: Bin 1 UV (3-log Crypto, Giardia) 65 Ozone (T&O, Algae Toxins, Virus, Giardia)
63 Appleton Water Quality Goals Exceed EPA Regulations Disinfection Combined Filter Effluent Turbidity Giardia Inactivation/Removal Virus Inactivation/Removal Cryptosporidium Inactivation/Removal Drinking Water Regulation Appleton Water Quality Goal <0.3 NTU <0.1 NTU 3 logs >5 logs 4 logs >5 logs 3 logs >6 logs DBPs TTHMs <80 µg/l <40 µg/l HAAs <60 µg/l <30 µg/l TOC Removal 30% 40% to 50% UV Free Cl2 UV
64 Regulatory Upgrade and Process Improvement Partial Process Flow Diagram UV TO WASTE - Polymer From Softening Membrane Waste Water Tank Bypass -Hypochlorite -Caustic Soda -Fluoride -Corrosion Inhibitor - Ammonia To Distribution System Sand & GAC Media Filtration Membrane Filtration Membrane/ UV Feed Pumps UV Disinfection Chlorine Contactors Finished Water Storage Tanks High Service Pumps Main Areas of Upgrades


65 UV Disinfection Retrofit in Membrane Feed Pump Room Retrofit in UF Feed Room Lower Capital Cost Fit Within Existing Plant Hydraulic Profile with Minimal Headloss UV to Waste Capabilities Before Capable of 3-log Crypto and Giardia Inactivation After


 CT Tank")
66 Chlorine Contact Tank Improvements Virus and Giardia Inactivation CT Volume Roughly Doubled Improved Hydraulics and Baffle Factor Two Points of Ammonia Addition (Free Chlorine CT Flexibility) CT Tank Baffles


67 Project Benefits Enhanced disinfection Additional reliability/redundancy More operational flexibility Improved water quality

68 City of Norfolk Department of Utilities Raw Water Source Reservoir System consisting of three lakes in Suffolk and additional lakes in Norfolk and Virginia Beach Fed from Various Sources Runoff to Drainage Area Lake Gaston Blackwater River Nottoway River Average TOC in Raw Water = 3-7 mg/l

 37 th Street")
69 City of Norfolk Department of Utilities City Operates Two Water Treatment Plants Moores Bridges (108 mgd) 37 th Street (34 mgd)


70 Project Drivers Tropical Storm Irene Flushed Natural Organic Material into Reservoirs in Fall of 2011 Raw Water TOC Levels and Finished Water DBP s Increased in 2012 Enhanced Coagulation Treated the Water and Regulatory Compliance Maintained but DBP Levels were Higher City Reviewed Finished Water DBP Goals and Lowered their THM Target Tropical Storm Irene Stage 2 DBP Rule
71 37 th Street Water Treatment Plant Process Before Upgrades Chlorine Ammonia Rapid Mix Floc/ Sed Filters Disinfection In Clearwells Pump/ Storage Storage FW Pumps DBP Control Strategy: Enhanced Coagulation with Ferric Sulfate at Depressed ph Chloramines in Distribution System Limitations to Chlorine CT Reductions: Chlorinated filters for manganese control Clearwells located below sed basins contamination risk required free chlorine residual
72 New Multiple Barrier Disinfection Approach Selected to Meet DBP and Disinfection Goals Chlorine Chlorine Ammonia Rapid Mix Floc/ Sed SW Storage Basin New SW Pumps New Filters Low Lift Pumps UV Storage FW Pumps Converted filtered water clearwell to settled water storage basin Moved chlorine feed point to just upstream of new filters UV sized for up to 3.5-log giardia inactivation with one reactor out of service Ammonia added immediately downstream of UV, shorter chlorine CT Maintain existing water storage volumes

73 37 th Street WTP Site Layout

74 37 th Street Plant - 3D View Finished Water Tank Filter Building Filter Backwash EQ Basin UV Building

 Reactor")
75 UV Disinfection Reactors by TrojanUV Long-Time Manufacturers of UV Disinfection Equipment Medium Pressure UV Design Reactors Validated in Accordance with EPA UVDGM Maximum Flow per Reactor = 25 mgd (17 mgd design) Reactor Size: 24-inch

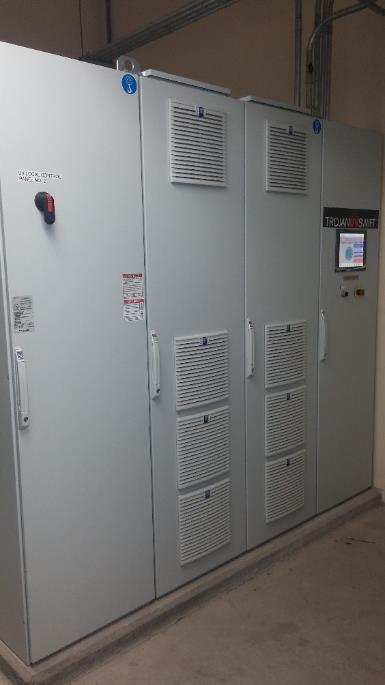
76 UV Installation

 Submit monthly report to")
77 UV Operations to Date 3-log Crypto/Giardia ~16 mj/cm2 Typical UVT ~93% Off Spec Water < 0.05% by vol/month Sleeve Fouling Increased wiper frequency to remove iron 1 wiper jam occurred at startup Perform Weekly UVT analyzer checks (1 unit) Initial fouling/humidity issues Perform monthly UV intensity sensor checks (18 sensors) Submit monthly report to VDH

78 Closing Thoughts Multi-barrier disinfection is the new normal Disinfection continues to evolve, but is still the cornerstone of public health protection Identify opportunities to optimize design and incorporate innovate, cost-effective approaches to achieve multiple benefits
79 Thank You Jay Maggi 29 Copyright October 2018 Jacobs worldwide