CITY OF ASHLAND EXECUTIVE SUMMARY WATER CONSERVATION AND REUSE STUDY FINAL. June 2011
|
|
|
- Quentin Cross
- 5 years ago
- Views:
Transcription
1 CITY OF ASHLAND EXECUTIVE SUMMARY WATER CONSERVATION AND REUSE STUDY FINAL June SOUTHWEST WASHINGTON STREET, SUITE 550 PORTLAND, OREGON (503) FAX (503) pw://carollo/documents/client/or/ashland/8406a00/deliverables/wcrs/executive Summary/Ashland_WCRS_ES.docx
2 CITY OF ASHLAND WATER CONSERVATION AND REUSE STUDY EXECUTIVE SUMMARY TABLE OF CONTENTS 1 INTRODUCTION GRANT REQUIREMENTS LEVEL OF SERVICE GOALS WATER NEEDS AND CONSERVATION EXISTING SUPPLIES Ashland Creek Supply Talent Irrigation District Water Supply Model ALTERNATIVE SUPPLIES Water Reuse TAP Pipeline Expanded Talent Irrigation District Supply New Ashland Creek Impoundment Potable Groundwater System Aquifer Storage and Recovery Intertie with City of Talent Water Treatment Plant Expansion Water Treatment Plant Flood Wall Emergency Water Treatment Plant New Water Treatment Plant Water Exchange Evaluation PLANNING LEVEL COST ESTIMATES WATER SUPPLY PACKAGES WATER SUPPLY DECISION CAROLLO ENGINEERS i June 2011 pw://carollo/documents/client/or/ashland/8406a00/deliverables/wcrs/executive Summary/Ashland_WCRS_ES.docx
3 CITY OF ASHLAND WATER CONSERVATION AND REUSE STUDY LIST OF ATTACHMENTS Attachment A - Request for Proposals Attachment B - TM 1 - Gap Analysis Attachment C - TM 2 - Water Needs Analysis Attachment D - TM 3 - Conservation Analysis Attachment E - TM 4 - Level of Service Goals Attachment F - TM 5 - Existing Supplies Attachment G - TM 6 - Climate Change Analysis Attachment H - TM 7 - Recycled Water Analysis Attachment I - TM 8 - Recycled Water System Piping Analysis Attachment J - TM 9 - Groundwater Evaluation Attachment K - TM 10 - Talent Irrigation District Analysis Attachment L - TM 11 - Reeder Reservoir Expansion Attachment M - TM 12 - Water Rights Attachment N - TM 13 - Alternative Supplies Attachment O - TM 14 - Right Water Right Use Analysis Attachment P - TM 15 - Environmental Analysis Attachment Q - Water Exchange Evaluation Attachment R Reeder Reservoir Water Quality Assessment LIST OF TABLES Table 1 Summary of Grant Requirements... 1 Table 2 Selected LOS Goals... 3 Table 3 Projected Maximum Day Demands with Varying Levels of Conservation... 4 Table 4 Summary of Supply Model Analysis... 5 Table 5 Estimated Capital and O&M Costs for Water Supply Alternatives Table 6 Summary Criteria Evaluation LIST OF FIGURES Figure 1 Project Maximum Day Demands Compared to Current WTP Capacity... 6 CAROLLO ENGINEERS ii June 2011 pw://carollo/documents/client/or/ashland/8406a00/deliverables/wcrs/executive Summary/Ashland_WCRS_ES.docx
4 CITY OF ASHLAND WATER CONSERVATION AND REUSE STUDY City of Ashland EXECUTIVE SUMMARY 1 INTRODUCTION The City of Ashland (City) recognizes the importance of securing water resources to support the long-term health, economic viability, and environmental sustainability of the community. The purpose of the Water Conservation and Reuse Study (WCRS) was to identify an appropriate longterm water supply strategy for the City. Specific objectives included: Evaluate the impacts of climate change on the City s Ashland Creek supply. Identify an appropriate conservation target for the City and take into account its impact on the City s water supply needs. Identify and evaluate future sources of supply, including expansion of the existing supplies through a new impoundment, expansion of the Talent Irrigation District (TID) supply, water reuse, groundwater, and the Talent Ashland Phoenix (TAP) Pipeline. Evaluate the alternative sources based on financial, environmental, and other factors. Select a long-term water supply strategy through an integrated public process that effectively engages stakeholders. 2 GRANT REQUIREMENTS The WCRS was funded in part by a grant from the Oregon Water Resources Department s (OWRD) Water Conservation, Reuse and Storage Grant Program. The original grant was amended based on a letter from the OWRD dated February 26, The final grant included the objectives listed in Table 1; these objectives are shown along with the specific attachments that address each objective. Table 1 Summary of Grant Requirements Grant Requirement Attached Information 1. Develop RFP and award contract Attachment A Request for Proposals 2. Review, analyze, validate, and identify gaps in Ashland s existing water master plans and water sources. 3. Identify the City s future water needs to the year Identify and fully describe all alternative water sources. Attachment B Gap Analysis Attachment F Existing Supplies Attachment C Water Needs Analysis Attachment D Conservation Analysis Attachment E Level of Service Goals Attachment N Alternative Supplies Attachment M Water Rights Attachment J Groundwater Evaluation Attachment L Reeder Reservoir Expansion CAROLLO ENGINEERS 1 June 2011 pw://carollo/documents/client/or/ashland/8406a00/deliverables/wcrs/executive Summary/Ashland_WCRS_ES.docx
5 CITY OF ASHLAND WATER CONSERVATION AND REUSE STUDY Table 1 Summary of Grant Requirements Grant Requirement 5. Identify options that explore the right water for the different water uses; potable, irrigation (sources and uses). 6. Identify benefits and challenge to using irrigation water. 7. Analyze environmental harm or impacts with the long term use of various irrigation water sources for City irrigation use. 8. Evaluate hydrological benefits and challenges and anticipate the effects of climate change with regard to water needs and water use. 9. Identify benefits and challenges to using recycled water. Attached Information Attachment K Talent Irrigation District Analysis Attachment K Talent Irrigation District Analysis Attachment P Environmental Analysis Attachment F Climate Change Analysis Attachment H Recycled Water Analysis Attachment I Recycled Water Piping 10. Identify options and cost estimates. Attachment N Alternative Supplies 11. Identify potential use of a water exchange to help meet wastewater treatment plant temperature limitations (TMDL). 12. Complete a consolidated engineering and financial feasibility study and cost benefit analysis of the preferred alternatives. Identify the link between conservation and enhanced conservation efforts and the preferred alternative. 13. Identify the specific community and public benefits accruing from the proposed alternative including estimated project costs, financing for the project, and projected financial returns from the project. Attachment Q Water Exchange Evaluation Attachment O Right Water Right Use Attachment O Right Water Right Use 3 LEVEL OF SERVICE GOALS As part of the WCRS, the City established an Ashland Water Advisory Council (AWAC). The AWAC process was funded wholly by the City, separate from the OWRD grant funding. The role of the AWAC was to serve as an advisory group to the Council and the City s water staff, providing a link with the community and involving impacted persons and interest groups with the WCRS and CWMP. One of the main responsibilities of the AWAC was to establish level of service (LOS) goals that would inform the water supply alternatives developed through the WCRS. The LOS goals established by the AWAC are summarized in Table 2. CAROLLO ENGINEERS 2 June 2011 pw://carollo/documents/client/or/ashland/8406a00/deliverables/wcrs/executive Summary/Ashland_WCRS_ES.docx
6 CITY OF ASHLAND WATER CONSERVATION AND REUSE STUDY Table 2 Goal Area Water System Capacity Selected LOS Goals Water System Reliability Water System Redundancy Regulatory Requirements Goal Have sufficient supply to meet projected demands that have been reduced based on 5 percent additional conservation. However, City will have a goal of achieving 15 percent conservation. Community will accept curtailments of 45 percent during a severe drought. Implement redundant supply project to restore fire protection and supply for indoor water use shortly after a treatment plant outage. Meet or exceed all current and anticipated regulatory requirements. 4 WATER NEEDS AND CONSERVATION Future water needs were assessed both with and without additional conservation. Water needs under curtailment conditions were also assessed to meet the AWAC s LOS goal for 45 percent curtailment during severe drought. The City s future water needs were initially projected through 2060 based on the current level of conservation and the following data: Average water use of 157 gallons per capita per day based on annual supply volumes and populations for years 2005 through Projected population of 30,326 people in 2060 based on the City s 1981 Comprehensive Plan. Peaking factor (ratio of demand on maximum day to annual average daily demand) of 2.06, based on 2005 through 2009 supply data. The projected average and maximum day demands for 2060 with no additional conservation are 4.76 mgd and 9.81 mgd, respectively. Potential conservation impacts were then projected based on an evaluation of the City s current conservation programs, assessment of indoor versus outdoor use and residential versus commercial use, and benchmarking against water use in other communities. Three potential conservation levels were explored: 5, 10, and 15 percent additional conservation. All conservation levels were applied assuming the 75 percent of the reductions by volume would be achieved in outdoor use and 25 percent in indoor use. The resulting average day and maximum day demands for the three conservation levels are summarized in Table 3. Potential new conservation programs were identified to support reaching the City s conservation goals. The AWAC s LOS goal for 45 percent curtailment during a severe drought was then applied, resulting in the projected monthly water use patterns for The curtailment goal was applied assuming a 45 percent reduction during the maximum month of usage. CAROLLO ENGINEERS 3 June 2011 pw://carollo/documents/client/or/ashland/8406a00/deliverables/wcrs/executive Summary/Ashland_WCRS_ES.docx
7 CITY OF ASHLAND WATER CONSERVATION AND REUSE STUDY Table 3 Year Projected Maximum Day Demands with Varying Levels of Conservation Projected Demands (million gallons per day) (3) 5 percent reduction 10 percent reduction 15 percent reduction ADD MDD ADD MDD ADD MDD Notes: (1) Assumes half of the targeted additional conservation level is achieved by (2) Assumes the targeted additional conservation level is achieved by (3) ADD average day demand; MDD maximum day demand. 5 EXISTING SUPPLIES Existing water supplies were evaluated for their ability to meet the projected 2060 water needs. The evaluation included the City s two sources of supply, consisting of the Ashland Creek supply (which is stored in Reeder Reservoir) and the Talent Irrigation District (TID). Descriptions of the two supplies and a summary of the evaluation of the adequacy of the existing raw water supplies and treatment facilities are provided herein. 5.1 Ashland Creek Supply Both the West and East Forks of Ashland Creek drain to Reeder Reservoir. Supply can be taken from the reservoir, or directly from diversions on the creeks. During the summer, the City mainly depends on the stored water in Reeder Reservoir; Ashland Creek flows are typically low and the City s use is limited based on the rights of senior water rights holders and environmental requirements. An analysis of climate change impacts on the Ashland Creek supply was completed by Dr. Alan Hamlet of the Climate Research Center at the University of Washington. The study used a Distributed Hydrologic Surface Vegetation Model (DHSVM) to project anticipated alterations to water resources in the City s watershed. A total of eight climate change scenarios for years 1920 through 2006 were investigated; the average of the eight scenarios was used for the evaluations. 5.2 Talent Irrigation District TID water is provided to Ashland via the Ashland Canal, the lower portion of which is operated by the City of Ashland. Water to the Ashland portion of the canal is metered by TID and regulated according to the City s water right of 769-acre feet per year (AFY), available during the irrigation season of April through October. This water is divided among three uses: losses (due to the unlined canal and operational overflows), irrigation users, and potable water (by being pumped to CAROLLO ENGINEERS 4 June 2011 pw://carollo/documents/client/or/ashland/8406a00/deliverables/wcrs/executive Summary/Ashland_WCRS_ES.docx
8 CITY OF ASHLAND WATER CONSERVATION AND REUSE STUDY the Ashland WTP). TID water is used for irrigation by a number of public and private properties, including Lithia Park; these uses are generally not metered. TID water can be conveyed to the Ashland WTP via the Terrace Street Pump Station to produce potable water. It was estimated that approximately 223 AFY is available for this use. A detailed climate change evaluation was not conducted on the TID supply. Based on evaluations conducted in previous projects, it was estimated that 50 percent of the TID supply would be available in the third year of a prolonged, severe drought. 5.3 Water Supply Model The objective of the water supply model was to compare the available supplies to the estimated demands and identify limitations of the existing supply system to meet future demands, especially under different drought conditions. Both Ashland Creek (Reeder Reservoir levels) and TID supplies were considered to generate available water for the City s use. The supplies were evaluated for three drought scenarios: Worst Drought ( ) without Climate Change; Worst Drought (1924) with Climate Change; and 1-in-10 year drought (1987) without Climate Change. The additional supply requirements in 2060 projected by the water supply model for the three scenarios are shown in Table 4. Table 4 Summary of Supply Model Analysis Additional Conservation Goal Additional Supply Capacity Needed in 2060 (AF) (1) No Climate Change 1924 With Climate Change 1987 No Climate Change 5 percent percent percent Notes: (1) MG millions of gallons; AF acre feet. Required water treatment capacity to meet projected peak day water needs was also assessed. The current capacity of the water treatment plant was assumed to be 7.5 million gallons per day (mgd), based on the experience of plant staff and historical plant performance. The projected capacity deficits at maximum day ranged from 0.5 mgd for 15 percent additional conservation to 2.3 mgd for no additional conservation. CAROLLO ENGINEERS 5 June 2011 pw://carollo/documents/client/or/ashland/8406a00/deliverables/wcrs/executive Summary/Ashland_WCRS_ES.docx
9 CITY OF ASHLAND WATER CONSERVATION AND REUSE STUDY Peak Day Demands (mgd) Current WTP Capacity No conservation 5% conservation 10% conservation 15% conservation Year Figure 1 Project Maximum Day Demands Compared to Current WTP Capacity 6 ALTERNATIVE SUPPLIES The WCRS considered eight water supply alternatives; some alternatives increase raw water supplies, some increase peak potable water availability, and some do both. The water supply alternatives being evaluated for this study vary greatly in the degree to which they have previously been investigated. Significant engineering has been completed on some alternatives, whereas other alternatives are being evaluated for the first time based on preliminary information. The costs and other information presented herein are based on the best information available at this time. All alternatives would require additional studies following completion of the WCRS to gather missing information and then to develop a design for the required facilities. Such further studies may reveal additional issues not identified to date that may significantly impact the cost, capacity, or feasibility of the water supply alternative. The specific alternatives are summarized herein. 6.1 Water Reuse The Ashland Wastewater Treatment Plant (WWTP) has the ability to produce up to 2.3 mgd of Class A Reclaimed Water. Class A recycled water can be used for irrigation of crops, including crops for human consumption, and can also be used to irrigate parks, playgrounds, residential landscapes, and other landscapes accessible to the public. The WCRS evaluated delivery of the reclaimed water from the WWTP to non-residential properties within the City. The properties currently get their water from one of three sources: the City s potable water system, senior Ashland Creek water rights, or TID water (either from the City s portion of the Ashland Canal or from their own TID water rights). Three different scenarios for purple pipe systems were developed, which CAROLLO ENGINEERS 6 June 2011 pw://carollo/documents/client/or/ashland/8406a00/deliverables/wcrs/executive Summary/Ashland_WCRS_ES.docx
10 CITY OF ASHLAND WATER CONSERVATION AND REUSE STUDY varied in the extent of the system and whether they assumed participation of properties with existing Ashland Creek water rights. The specific properties to be served (and their current irrigation water source) were identified for all scenarios. An additional scenario was later added consisting of delivering water only to the Imperatrice property (which is owned by the City) allowing the property s TID water rights to be used by the City. All scenarios included a new recycled water pump station to pump water from the WWTP to an equalization reservoir on the Imperatrice Property followed by a gravity piping system that would deliver water to the selected properties. The capacities of the recycled water scenarios ranged from 831 AF to 1,657 AF (not including the Imperatrice scenario). The scenarios offset peak potable water demands by only 0.1 to 0.6 mgd, as most of the offset demands are currently served by TID water. The recycled water system would not provide a redundant potable water supply. Key issues associated with this alternative include the requirement for the participation of individual landowners (some of whom would need to transfer their existing water rights to the City) and the potential need for the City to replace a portion of the recycled water removed from Bear Creek to provide environmental benefits. 6.2 TAP Pipeline The City participated with the cities of Talent and Phoenix, along with support from the Rogue Valley Council of Government and the Medford Water Commission, to reserve capacity and share in the cost of building the TAP Pipeline and Regional Booster Pump Station. The City of Ashland has a reserved capacity of 1.5 mgd in the existing portion of the TAP Pipeline. Under this supply alternative, the existing TAP pipeline would be extended to the City of Ashland. The new pipeline is assumed to be a 16-inch diameter ductile iron pipeline with a total length of approximately 21,050 feet. This supply alternative would also include a new pump station that would be wholly owned and operated by the City of Ashland. The raw water supply would be from the City s existing rights in Lost Creek Reservoir. A key issue associated with this alternative is the loss of water supply independence, including a lack of control over future wholesale water rates. The capacity of the TAP pipeline was assumed to be 1.5 mgd based on previously-completed work. The TAP supply is treated, potable water, so the full capacity would be used to meet peak potable water demands. This supply would provide a redundant potable water supply. The assumed peak season capacity is approximately 690 AF, assuming the system would only be operated during the reservoir drawdown period during non-emergencies. 6.3 Expanded Talent Irrigation District Supply Two potential alternatives were evaluated for expanding the TID supply. The first was piping the Ashland Canal from Green Springs Turnout to the Terrace Street Pump Station. It was determined that acquiring new water rights for the water saved through implementation of this alternative would likely not be possible, hence this alternative was eliminated from further consideration. The second alternative is piping the City s portion of the Ashland Canal, from the Starlite Monitoring Station to its terminus at Wright s Creek. The water gained would be in the form of reduced water losses; current losses could only be approximated, as use of TID water is generally unmetered. This alternative would have the additional benefit of preventing contamination of the TID water along that reach of the canal and ceasing overflows to Ashland Creek. CAROLLO ENGINEERS 7 June 2011 pw://carollo/documents/client/or/ashland/8406a00/deliverables/wcrs/executive Summary/Ashland_WCRS_ES.docx
11 CITY OF ASHLAND WATER CONSERVATION AND REUSE STUDY The Ashland Canal piping project would not affect available peak day supplies, assuming recovered water would be treated at the City s water treatment plant and used for potable water supply. If the City were to instead deliver recovered flows to additional properties for irrigation use, the offset would be on the order of 0.8 mgd. The estimated capacity gained through the Ashland Canal piping project is 274 AF (89 MG), based on estimated losses from the City s portion of the canal. A new Ashland Creek impoundment would not provide a redundant potable water supply; this alternative would not address the redundancy level of service goal. A key issue associated with this supply is the uncertainty of the capacity gains and their insufficiency in meeting projected capacity shortfalls on their own. 6.4 New Ashland Creek Impoundment The current evaluation focused on a new Ashland Creek impoundment at the Winburn Site, located approximately one mile upstream of Reeder Reservoir. A potential new reservoir at this site has been evaluated in several previous studies. Due to the configuration of the site, it appears possible to right-size the alternative to meet the projected storage deficit of 619 AF. The new impoundment would not affect available peak day supplies, as all flows would need to be treated at the City s water treatment plant, and this alternative would not provide a redundant potable water supply. The key issues associated with this alternative include significant environmental and community impacts; over 25 acres of clear/inundated forest land, a new 9,000 foot access road, and around one million cubic yards of imported material. It also appears it would be very difficult to obtain water rights for a new impoundment. 6.5 Potable Groundwater System An evaluation of local groundwater resources was conducted for a 700 square mile area surrounding the City, including review of over 10,000 well logs. The average production of the wells was 8 gpm, with a few wells producing more than 350 gpm. Given the uncertainty in the availability and reliability of groundwater resources, a range of cost estimates was developed for this alternative based on differences in individual well capacities, treatment requirements, and new wells versus use of existing ones. It was assumed that the groundwater system would be sized to meet the AWAC s LOS goal for redundant capacity, providing a peak capacity of 1.5 mgd. This capacity would reduce but not eliminate the projected peak day supply deficiency. This capacity would provide an annual volume of 690 AF (based on use only during the Reeder Reservoir drawdown period), sufficient to meet the projected supply shortage. Key issues include the significant uncertainty in whether the required capacity could be achieved through a reasonable number of wells and whether those wells would be a reliable source of supply. Well water may also require significant treatment for water quality and may change the aesthetics of the water. 6.6 Aquifer Storage and Recovery In the proposed aquifer storage and recovery (ASR) system, surface water would be stored underground during high flow periods by being pumped into the ASR wells. During drought periods when additional supply is needed, the water would be pumped out of the ASR wells and conveyed to the City via the TID system including the Ashland Canal. The area appearing most promising for CAROLLO ENGINEERS 8 June 2011 pw://carollo/documents/client/or/ashland/8406a00/deliverables/wcrs/executive Summary/Ashland_WCRS_ES.docx
12 CITY OF ASHLAND WATER CONSERVATION AND REUSE STUDY an ASR system, based on available geologic data, is in the vicinity of the Howard Prairie and Hyatt Reservoirs. As there are no well logs available for this area, feasibility of this option cannot be determined at this time. There is also insufficient data available to estimate the potential capacities or costs of ASR wells, hence no cost information was developed. 6.7 Intertie with City of Talent The City of Ashland recently signed an intertie agreement with the City of Talent. The intertie pipeline would follow the route of the proposed TAP pipeline extension, extending approximately two thirds (14,000 feet) of its total length. A temporary pump station may be required to deliver flows to the City of Ashland System. It is recommended that the City of Ashland work with the City of Talent to confirm the capacity and additional infrastructure requirements of the intertie, if implementation of this alternative is pursued. The estimated cost for this alternative does not include a pump station to lift flows into the City of Ashland s distribution system nor any capital cost sharing for facilities (e.g., their planned new reservoir) within the City of Talent system. This alternative provides the possibility of providing water to the City of Ashland during the winter, pending confirmation of feasibility given environmental flow requirements in the winter. 6.8 Water Treatment Plant Expansion The existing water treatment plant has a capacity of approximately 7.5 mgd, based on the plant s historical performance and input from operations staff. The water treatment plant was previously designed to a capacity of 10 mgd and this design capacity could be realized by restoring two existing filters that are currently not in service. These improvements would be sufficient to meet the projected deficiency in peak day capacity, but would not affect total available supplies and would not provide a redundant source of potable water. 6.9 Water Treatment Plant Flood Wall Implementation of a storm/flood wall at the existing water treatment plant to improve reliability of the existing facilities was evaluated. The wall was assumed to have a length of approximately 1,000 feet and height of 10 feet, based on input from City staff on water levels at the water treatment plant during previous floods. The wall would not directly meet any of the LOS goals established by the AWAC, but would decrease the vulnerability of the existing plant, thereby reducing the need for a redundant supply Emergency Water Treatment Plant Two alternatives were evaluated for an emergency water treatment plant: (1) having a contract with a membrane system manufacturer to provide a membrane system in an emergency and (2) purchasing the system and putting it in operation during an emergency. The latter alternative was determined to be more cost effective, and is discussed here. The system was assumed to have an overall capacity of 1.5 mgd, including a trailer mounted membrane system, a low-lift pump station, and allowances for site preparation. The back-up treatment plant would provide a redundant source of potable water, but would not help meet peak or annual supply capacity requirements as it would only be operated in an emergency. CAROLLO ENGINEERS 9 June 2011 pw://carollo/documents/client/or/ashland/8406a00/deliverables/wcrs/executive Summary/Ashland_WCRS_ES.docx
13 CITY OF ASHLAND WATER CONSERVATION AND REUSE STUDY 6.11 New Water Treatment Plant An alternative for a new water treatment plant was developed later in the project based on input from the AWAC. This new facility would have an initial capacity of 2.5 mgd and be expandable to eventually replace the existing WTP as it reaches the end of its useful life (ultimate capacity of about 10 mgd). The intent is that the new WTP would be located in a less vulnerable location and would be operated year-round; the planned capacity of 2.5 mgd is sufficient to meet current winter demands. The existing WTP would then only be operated during the summer months, when demands are greater Water Exchange Evaluation An evaluation of exchanging wastewater with TID to meet total maximum daily load (TMDL) requirements for temperature was completed as part of the City s Sewer Master Plan. This does not impact the water supply alternatives; a summary is included here as this evaluation was included in the OWRD grant funding. The TID exchange would involve discharging the City s effluent into the TID irrigation system. The likely discharge location would be Talent Canal. One of the benefits of this alternative would be the reduced chemical requirements needed to remove phosphorous, because most of the water would be reused or land applied downstream. This alternative would mitigate concerns about near field impacts to aquatic habitat, and would reduce the thermal load requirements to the extent that the effluent is reused downstream. The TID Board identified a number of concerns associated with alternative, including real and perceived concerns with receiving effluent, presence of chemicals in the water, and the approval of their patrons. Given the significant TID concerns as well as other regulatory and O&M issues, it was recommended that this alternative not be pursued at this time. However, the plan acknowledges that it may be viable in the future as public perception changes and if drought conditions make the water resources more valuable. 7 PLANNING LEVEL COST ESTIMATES Planning-level cost estimates were developed for each of the water supply alternatives. These estimates are presented as total project costs in August 2010 dollars, corresponding to an Engineering News Record (ENR) 20-Cities Construction Cost Index (CCI) of 8,858. Costs are at a planning level (+50/-30 percent accuracy), unless otherwise noted. Estimates should be refined as project- and site-specific requirements are further developed. Estimated capital and O&M costs for the individual alternatives are summarized in Table 5. CAROLLO ENGINEERS 10 June 2011 pw://carollo/documents/client/or/ashland/8406a00/deliverables/wcrs/executive Summary/Ashland_WCRS_ES.docx
14 CITY OF ASHLAND WATER CONSERVATION AND REUSE STUDY Table 5 Estimated Capital and O&M Costs for Water Supply Alternatives Water Supply Alternative Planning Level Estimated Costs Capital ($ Million) (1) O&M ($1,000/year) NPV ($ Million) (2) Reclaimed Water $ $ $ Reclaimed Water Imperatrice $5.3 $50 $5.2 TAP Pipeline $12.2 $337 $16.0 TID Ashland Canal Piping Ashland Creek Impoundment $2.7 - $2.2 $79.7 $100 $66.6 Groundwater $ $ $ Talent Intertie $5.3 - $4.3 WTP Expansion $0.8 - $0.7 Protected WTP - Floodwall $ $1.5 Emergency WTP $8.4 $6.9 New WTP $12.0 $9.8 Notes: (1) Costs include the following contingencies: 20 to 30 percent estimating contingency; 15 percent for contractor overhead and profit; and 20 to 25 percent for engineering, legal and administration (ELA) costs. (2) Net Present Value (NPV) based on: capital improvements completed by 2020; O&M expenses for 2020 through 2060; discount rate of 3 percent. 8 WATER SUPPLY PACKAGES The individual water supply alternatives were then combined into six initial water supply packages. All of the water supply packages fully met the AWAC s LOS goals. The one exception was Package 3, which did not fully meet the supply shortage. The packages were evaluated according to thirteen criteria, as presented in Table 6. The criteria rankings were reviewed by the AWAC and revised according to their input. Packages including an emergency supply to provide system redundancy included the cost for the Talent Intertie, which was the lowest-cost emergency supply alternative evaluated. CAROLLO ENGINEERS 11 June 2011 pw://carollo/documents/client/or/ashland/8406a00/deliverables/wcrs/executive Summary/Ashland_WCRS_ES.docx
15 CITY OF ASHLAND WATER CONSERVATION AND REUSE STUDY Table 6 Summary Criteria Evaluation Criterion Package 1 - Recycled Water + Emergency Supply + WTP Expansion Reliability + Includes redundant potable water supply Cost Effectiveness - to 0 $ M Financial Risk 0 Conceptual costs and relatively lowrisk construction Appropriateness of Use + Offsets potable water use with recycled water Environmental Friendliness 0 Pipelines along City roadways Public Acceptability Independence + Local resource Community Impacts 0 Impacts during construction only Water Quality 0 Maintain existing potable supplies Operational Flexibility 0 Incremental expansion possible, would take time Operational Manageability - New pump station, reservoir and distribution system Scalability 0 Can extend to additional properties, but not at equal efficiency Implementation Risk 0 Requires cooperation of individual property owners Package 2 - TAP Extension + WTP Expansion + Includes redundant potable water supply 0 $21.6 M + Well-developed option 0 No improvement 0 Pipeline along highway Package 3 - TID Expansion (Ashland Canal) + Emergency Supply + WTP Expansion + Includes redundant potable water supply + $12.1 M 0 Conceptual costs and relatively low-risk construction 0 No improvement 0 Pipeline in open areas Water Supply Packages Package 4 - Winburn Dam + Emergency Supply + WTP Expansion + Includes redundant potable water supply - $76.5 M - Technical details are sparse and costs are already high 0 No improvement - Massive environmental impact during construction Package 5 - Potable Groundwater + WTP Expansion + Includes redundant potable water supply 0 to + $9.9 $25.1 M - Little information on reliable capacity (may need more wells) 0 No improvement 0 Construction at multiple sites Package 6 - Aquifer Storage and Recovery (ASR) + Emergency Supply + WTP Expansion + Includes redundant potable water supply - Undefined - Technical details don t exist and potential costs are very high 0 No improvement Undefined Depends on project configuration To be defined by AWAC To be defined by AWAC To be defined by AWAC To be defined by AWAC To be defined by AWAC To be defined by AWAC - Supply from Medford 0 Impacts during construction only 0 Comparable to current 0 Temporary additional supplies may be available from Talent, total capacity limited 0 New pump station and single pipeline - City has purchased 1.5 mgd capacity in pipeline + Most well-developed of the alternatives - Supply from TID 0 Impacts during construction only - Different quality than Reeder 0 Temporary additional supplies may be available + Simplifies ongoing operations for City canal - No clear opportunity to develop required additional supply + City can pipe own portion of canal without cooperation + Local resource - Impacts during construction and potentially thereafter 0 Provides additional Ashland Creek water - Once constructed, dam expansion not likely feasible - Additional dam and related facilities to operate and maintain 0 Storage can be sized for demand projections - Given the limited information, risk is high + Local resource 0 Impacts during construction only - Iron, manganese and total dissolved solids 0 Incremental expansion possible, would take time /- new wells to operate, likely with new treatment systems + Wells can be constructed to meet demands - Risk of poor water quality, low reliability of supply - Coordination with TID and Bureau + Impacts during construction only, and distant from communities - Provides additional TID water 0 May be possible to expand supply - Additional distant facilities to operate and maintain 0 Wells can be added if basin supports it - Given the limited information, risk is high CAROLLO ENGINEERS 12 June 2011 pw://carollo/documents/client/or/ashland/8406a00/deliverables/wcrs/executive Summary/Ashland_WCRS_ES.docx
16 CITY OF ASHLAND WATER CONSERVATION AND REUSE STUDY 9 WATER SUPPLY DECISION The AWAC decided to divide the overall water supply plan into two separate components: (1) addressing the need for a redundant water supply and (2) increasing annual storage volumes. Given that annual storage volumes are not anticipated to be deficient until after 2030, it was decided that a decision on a water supply alternative should be delayed until the next plan. However, the AWAC did provide the following recommendations: A new Ashland Creek impoundment and ASR should be eliminated from consideration as a water supply alternative. Groundwater testing to further evaluate the groundwater alternative should be added to the City s CIP in the amount of $150,000. The City should move aggressively to acquire additional Ashland Creek or TID water rights as they come available. Additional storage should be evaluated as part of the next Water Master Plan Update, including alternative methods such as shading, snow fencing, and silviculture practices; tanks or reservoirs may or may not be included. The AWAC was able to reduce the alternatives being considered for system redundancy to two options: the Talent intertie and a new WTP. It was decided that the rate impacts of both alternatives will be determined and presented to the City Council to make the final decision on a new redundant water supply. This decision is anticipated in Fall Regardless of the initial alternative selected, the AWAC recommended that phased replacement of the existing WTP at a less vulnerable location would be a better investment than expansion at the existing location. CAROLLO ENGINEERS 13 June 2011 pw://carollo/documents/client/or/ashland/8406a00/deliverables/wcrs/executive Summary/Ashland_WCRS_ES.docx
17 City of Ashland Water Conservation and Reuse Study Technical Memorandum 1 Data Gap Analysis August SOUTHWEST WASHINGTON STREET, SUITE 550 PORTLAND, OREGON (503) FAX (503)
18 City of Ashland Water Conservation and Reuse Study Technical Memorandum 1 Data Gap Analysis TABLE OF CONTENTS Page 1.0 INTRODUCTION EXISTING STUDIES DATA GAP SUMMARY FOR WATER CONSERVATION AND REUSE STUDY Recycled Water TAP Pipeline TID Supply Ashland Creek Storage Groundwater DATA GAP SUMMARY FOR COMPREHENSIVE WATER MASTER PLAN Population and Demand Projections and Conservation Existing System Hydraulic Model System Analysis SUMMARY LIST OF TABLES Table 1 Projected Population from Previous Studies Table 2 Projected Demands from Previous Studies August 2010 pw://carollo/documents/client/or/ashland/8406a00/deliverables/wcrs/att A/TM1_GapAnalysis.docx i
19 Technical Memorandum No. 1 DATA GAP ANALYSIS 1.0 INTRODUCTION The City of Ashland (City) plans to submit and obtain approval of its Water Conservation and Reuse Study (WCRS) to meet the requirements of the City s Oregon Water Resources Department (OWRD) Conservation, Reuse, and Storage Grant. In parallel, the City is completing a Comprehensive Water Master Plan (CWMP). In order to prevent duplication of effort, the City intends to incorporate applicable information from several recently completed studies into the WCRS and CWMP reports. While much of this information is current, other information will need to be updated and incorporated to meet the requirements of OWRD. The purpose of this Technical Memorandum (TM) is to summarize the information already provided by existing studies, identify data gaps, and provide recommendations for completing WCRS and CWMP. 2.0 EXISTING STUDIES The WCRS report builds upon earlier technical documents relating to water supply and planning. The following studies were used to develop the Plan: Wastewater Treatment Plant Facilities Plan (Brown and Caldwell 1996, Updated Carollo 2003, Draft Update Carollo 2009); Preliminary Feasibility Study Bear Creek and Little Butte Creek Watersheds (HDR, 2009); Preparing for Climate Change in the Rogue River Basin of Southwest Oregon (Climate Leadership Initiative, 2008); Update to Wastewater Facilities Plan and Permitting Evaluation (Carollo, 2008); Reeder Reservoir Study (Brown and Caldwell, 2008); Water Distribution Modeling Services (Carollo, 2006). City of Ashland TAP Pipeline Preliminary Engineering (Carollo, 2005), (herein referred to as 2005 TAP Report ); Water Master Plan Review (Carollo, 2003); Water Distribution Analysis and Capital Improvement Plan (Lee Engineering, 2002); Water Pipeline Evaluations (Lee Engineering, 2001); City of Ashland Comprehensive Water Supply Plan (Carollo, 1998), (herein referred to as 1998 Comprehensive Plan ); August 2010 pw://carollo/documents/client/or/ashland/8406a00/deliverables/wcrs/att A/TM1_GapAnalysis.docx 1
20 City of Ashland Water Supply Report (R.W. Beck, 1989); Water Resources Management Plan and Facility Study (James Montgomery Consulting Engineers, 1977). 3.0 DATA GAP SUMMARY FOR WATER CONSERVATION AND REUSE STUDY A summary of the data gaps identified for the water supply evaluation for the WCRS is presented herein. Each section summarizes additional deficiencies that will be addressed through the WCRS to provide a complete, updated plan. The City currently has two raw water sources that are converted into treated potable water: flow from Ashland Creek and water from the Talent Irrigation District (TID) system. The water from Ashland Creek can be directly fed from either the City s raw water storage facility (Reeder Reservoir), or from the East or West Forks of the Middle Fork of Ashland Creek that are immediately upstream of Reeder Reservoir, to be treated in the water treatment plant for potable use. Previous studies of the City s water supply have concluded that the available supply is insufficient to meet the long term needs of the City, particularly under drought conditions. This is due to the fact that the storage volume in the Reeder Reservoir, the City s only water storage reservoir, is inadequate to meet the annual supply needs. Five potential water supply concepts are identified as potentially feasible: recycled water, the Talent-Ashland-Phoenix (TAP) Pipeline, an expanded TID supply, a new Ashland Creek impoundment, and groundwater or aquifer storage and recovery (ASR). A data gap analysis of these alternatives is presented in this section. 3.1 Recycled Water The City s wastewater treatment plant (WWTP) currently produces Class A reclaimed water. This water is suitable for public access irrigation, on playgrounds, parks, school yards, etc. The Ashland WWTP requires the following prior to releasing any recycled water for beneficial reuse: Submit and receive approval for a Reclaimed Water Use Plan meeting the requirements of OAR Have an NPDES permit authorizing the release of reclaimed water. Under this supply concept, recycled water would be used for irrigation to reduce the demand on the potable supply system during the high demand summer months. August 2010 pw://carollo/documents/client/or/ashland/8406a00/deliverables/wcrs/att A/TM1_GapAnalysis.docx 2
21 Summary of Past Projects The City has completed four planning studies related to reclaimed water (1998 Comprehensive Plan, and 1996, 2003, 2009 Wastewater Treatment Plant Facilities Plan). In reviewing these reports we noted that three alternatives under this supply concept were analyzed: Direct Irrigation. The potential users of reclaimed water in the City are primarily large volume commercial and municipal irrigators including parks, schools, the Southern Oregon University campus, etc. Water Exchange with TID. Under water exchange with TID, the treated effluent will be discharged into the TID canal and TID infrastructure will be used to supply reclaimed water for irrigation. The water exchange concept would provide reclaimed water for delivery to the TID canal in exchange for like amounts of TID water; this water would likely be used to augment flows in Bear Creek during low flow periods to provide environmental benefit. Recycled Water for Potable Use. This option was discounted as non-viable. Direct potable reuse is not currently allowed under federal regulations. Issues to be Resolved Much of the alternative analysis is available from the past reports. Under this contract, we will update the following information to compare recycled water supply alternatives with others identified for WCRS: Direct Irrigation Alternative. Under this alternative, we will update irrigation demands, confirm reuse pipeline sizing and alignment, and update cost estimates. As propertyspecific data are not available due to City information rules, irrigation demands from the previous study will be scaled based on system-wide water use projections. The City has also identified an alternate proposal for using recycled water, comprised of: (1) serving customers close to the WWTP that have Senior Ashland Creek Water Rights currently used for irrigation and (2) feeding recycled water into the lower part of the Ashland Canal to serve a portion of existing TID customers. This alternative will also be evaluated. Water Exchange with TID. It is assumed that the water exchange with TID would not yield additional water supply; hence, this alternative will not be considered as part of this study. Implementation of the direct irrigation alternative may require that some proportion of the flows removed from the creek be replaced. It is assumed that any such flows would not come out of the existing water supplies used by the City and would be provided by other sources. For example, the City is currently pursuing permanent access to 600 acre-feet (AF) of TID water that has previously been accessed through a 1966 agreement with the City of Talent; these flows would be available to partially replace WWTP discharges. August 2010 pw://carollo/documents/client/or/ashland/8406a00/deliverables/wcrs/att A/TM1_GapAnalysis.docx 3
22 3.2 TAP Pipeline The City participated with the cities of Talent and Phoenix, along with support from the Rogue Valley Council of Government and the Medford Water Commission (MWC), to reserve capacity and share in the cost of building the Medford, Talent and Phoenix (TAP) Pipeline and Regional Booster Pump Station. The existing TAP pipeline begins at the connection with the MWC main transmission line at Highway 99 and Belknap Road and terminates in the City of Talent at Highway 99 and Suncrest Road. The City of Ashland has a reserved capacity of 1.5 million gallons per day (mgd) of water from the MWC through the TAP Pipeline. Under this supply concept, treated water from the TAP pipeline would provide the City with a secondary source and reduce the City s dependency on the water treatment plant and existing limited raw water storage capacity. Summary of Past Projects: Original TAP memos were completed in August 2006, which included: Draft TM 1 Constraints and Design Criteria (November 2004, no final). Revised Final TM 2 Demands and Storage Requirements (August 2006, later revised). Revised Draft TM 3 Predesign Alternatives (August 2006, no final). This work included preliminary sizing/routing of the TAP extension and pump station, and recommended a designated TAP reservoir to serve both as terminal storage for the TAP pipeline as well as to help meet Ashland s overall storage needs. As part of the Hydraulic Modeling Services completed in 2007, the need for a designated TAP reservoir was revisited and an amendment was prepared to TM 2 Demands and Storage Requirements. The main conclusion was that the TAP pipeline could feed directly into the City s distribution system and that a Crowson II Reservoir (rather than a TAP reservoir) could instead be used to help meet the City s overall storage needs. The overall findings of the study were updated with TM 4 - Summary of Preliminary Engineering And Recommendations. This included finalizing the pipeline routing and updating information on pump station design, and easement and property acquisition. In 2009, Carollo was contracted for the selection and acquisition of a TAP pump station site. TM 5 Pump Station Site Evaluation and Recommendation (Draft January 2009) was submitted to the City in January Issues to be Resolved Under this contract, we will update cost estimates to compare the TAP pipeline alternative with other supply alternatives. Costs will include system development charges (SDCs) for connecting to the MWC system, based on information provided by the MWC. August 2010 pw://carollo/documents/client/or/ashland/8406a00/deliverables/wcrs/att A/TM1_GapAnalysis.docx 4
23 3.3 TID Supply The City currently receives a portion of its raw water supply from TID via the Ashland Canal. Two long-standing contracts provide up to 769 AF/yr of supply during the irrigation season of May through August. The actual amount delivered under the contracts depends on water availability in the TID supply system, as both contracts have provisions for a potential reduction of flow during drought. The City is also currently under negotiations for an additional 600 AF of water. At the direction of the City, this additional volume was initially assumed to be reserved for meeting regulatory requirements or providing environmental mitigation associated with the City s wastewater treatment plant discharge. However, this assumption was later changed based on work being done in the City s Wastewater Master Plan, being completed concurrently with this study. Summary of Past Projects Several planning studies analyzed TID as a secondary supply source for the City. These include: 1996, 2003, 2009 Wastewater Treatment Plant Facilities Plan, 2009 Draft WISE Report, 1998 Comprehensive Plan, 1989 Water Supply Report, 1977 Water Resources Management Plan and Facility Study. The 1977 Study noted that the Terrace Street Pump Station had been constructed as the result of a water contingency plan developed in It recommended implementation of the pipeline to connect the pump station to the WTP and noted the potential to increase TID supply through purchase of additional water made available through conversion of agricultural land to municipal/industrial uses. The 1989 Report noted that there are several areas within southeast Ashland within the TID boundaries that have been urbanized and no longer use TID water, though property owners are still responsible for maintaining TID assessments. The report noted that it may be possible for Ashland to condemn or purchase the rights for these lands; it was estimated these rights would total 300 to 400 AF. The 1998 Plan evaluated two main alternatives for the TID system. The first was to replace the Ashland Canal with a pipeline from the Green Springs Turnout to the Terrace Street Pump Station, with associated flow measurement, valving, turnouts for existing TID customers, and piping to connect to the City system. The plan noted that the Bureau of Reclamation and TID had recently completed a study that estimated annual water savings of 3,000 AF by piping the canal. The savings included potential water recovery from mitigation of seepage losses, as well as recovery of water from more efficient irrigation off the August 2010 pw://carollo/documents/client/or/ashland/8406a00/deliverables/wcrs/att A/TM1_GapAnalysis.docx 5
24 pressurized supply. The 1998 Plan estimated that one third of the savings would be due to seepage mitigation. The 1998 Plan also discussed options for cooperative water supply projects with TID. The alternatives were developed as concepts only and the amount of additional water supply was not estimated. The options included the following: Water Banking. This alternative would provide additional storage for the City by banking water in the TID system in years of above normal precipitation. However, the report noted that TID does not currently allow banking and that the TID Board of Directors would likely be resistant to considering banking. Water Marketing. Under this scenario, additional supply for the City would be provided via a water exchange with existing TID customers. The City would establish contractual agreements with TID customers such that the City could purchase the water from them for domestic use during drought conditions. This alternative is allowed under Oregon law, though it would require a change to the place and type of use within the water marketing agreement (from irrigation to municipal), and would require approval of the TID Board of Directors. Reallocation of Water Rights. This alternative would provide additional supply for the City by re-allocating irrigation water rights to municipal/industrial rights on existing Cityowned property (or property purchased by the City in the future). The current rights apply only to irrigation use, and only on the specific property with the entitlement, so the City would need to obtain a change in the place of use. Increasing Storage in Emigrant Lake. Under this alternative, additional storage would be provided in the lake, either by raising the height of the dam or by dredging the reservoir to recover lost volume. The 2009 Draft WISE Report was focused on improving water quality and quantity in the Little Butte Creek and Bear Creek watersheds for irrigation, aquatic habitat, and other uses in an economically and environmentally feasible manner. The City of Ashland was not a partner in WISE, but it is possible that the City could share in the costs and benefits of projects resulting from WISE. WISE evaluated multiple alternatives to increase supply, including lining irrigation canals, replacing irrigation canals with piped systems, creating new storage, and increasing existing storage. Of the listed items, the only alternatives considered worthy of further evaluation were replacing canals with piped systems and increasing existing reservoir storage, as follows: Canal Projects. WISE identified three sets of canals that could be replaced with piped systems: (C1a) the Ashland, East, West and Talent Canals, (C1b) the Joint System, Phoenix, Medford, and Hopkins Canals, and (C1c) the Cascade and Howard Prairie Delivery Canals. Of these canals, the City of Ashland would be affected by the Ashland Canal under Option C1a or by Option C1c; waters from C1b could not reach the August 2010 pw://carollo/documents/client/or/ashland/8406a00/deliverables/wcrs/att A/TM1_GapAnalysis.docx 6
25 Ashland Canal. WISE recommended that these projects be moved forward for further consideration, with a priority of C1b, C1c, then C1a, based on projected effectiveness. Increased Storage. WISE identified four main options for increasing existing reservoir storage, focused on the Agate Reservoir, Fourmile and Fish Lakes, Emigrant Lake, and Hyatt Prairie Reservoir. The Hyatt Prairie Reservoir project would increase storage by 10,000 AF with a raise of 5 to 8 feet. Water from the remaining three projects cannot reach the Ashland Canal. WISE did not reach an overall conclusion on recommended improvements, nor did it result in an implementation schedule. It is possible that individual components of the WISE project may be implemented by individual participants or partnerships, depending on funding availability. Issues to be Resolved The current work will evaluate a single scenario for the TID supply: Piping of the Ashland Canal or other WISE alternative. We will update available cost estimates for piping the Ashland Canal, including consideration of estimates within previous reports, as appropriate. Based on conversations with TID, there are currently 800 acres of property waiting for TID water rights; hence, it is unlikely that opportunities to purchase additional water rights will be available. The City does have TID water rights for a portion of the Imperatrice Property, which has been previously evaluated as a potential site for use of recycled water. However, for the purpose of this study, it is assumed that these rights would be reserved for potential replacement of WWTP discharges, or other uses deemed to have a direct environmental benefit, and would not be a potential new potable water supply source. 3.4 Ashland Creek Storage Reeder Reservoir is located on Ashland Creek three miles south of the City of Ashland and one mile north of the City s water treatment plant. The primary function of Reeder Reservoir is to provide stored water to supplement Ashland Creek when domestic demand for water exceeds the natural in-stream flow. Summary of Past Projects: As stated earlier, previous studies indicate that the Reeder Reservoir is undersized for the City s projected future demands (1998 Comprehensive Plan [1998 Plan], R.W. Beck 1989 [1989 Report], J.M. Montgomery, 1978 [1978 Study]). The previous studies evaluated new impoundments as an alternative to provide additional supply during drought conditions. A number of impoundments were evaluated in the 1978 Study, including the Winburn and Ranger sites on Ashland Creek, the Neil Creek Watershed, and the Cove-Walker Watershed. The report recommended implementation of the Winburn site alternative; an earthen August 2010 pw://carollo/documents/client/or/ashland/8406a00/deliverables/wcrs/att A/TM1_GapAnalysis.docx 7
26 impoundment with a height of 100 ft was estimated to form a reservoir of approximately 54 acres with a capacity of 1600 AF, at an approximate cost of $4.6 million (1978 dollars). O&M costs were estimated to be 0.5 percent of construction costs, or $17,500 per year. It was noted that this alternative was originally evaluated by the U.S. Soil Conservation Services in 1959, which estimated that a 100-foot high dam would create a reservoir with capacity of around 700 AF. The Ranger site was determined to be similar to the Winburn site in terms of topography, but with insufficient geotechnical data to determine an estimated cost for a dam. Flows from the Neil Creek and Cove-Walker watersheds were determined to be unreliable. The 1989 Report only evaluated an impoundment at the Winburn site, which revised the estimated impoundment volume to 635 AF for a 120 foot high earthen dam at a cost of $11 million. The 1989 Report recommended a roller-compacted concrete dam as an alternative, which at the same height had an estimated construction cost of $8.1 million (1989 dollars). The 1998 Report evaluated three impoundment alternatives: the Winburn site with a pipeline to Reeder Reservoir ($41.6 million), the Winburn Site with discharge to Ashland Creek ($41.2 million), and a reservoir below Reeder Reservoir ($21.4 million). The Winburn alternatives were assumed to have a reservoir capacity of 620 AF and the reservoir below Reeder was assumed to have a capacity of 220 AF. The report also included a cursory evaluation of offstream storage theoretically located to the east of the City; this alternative was determined to be infeasible based on anticipated high costs due to piping and pumping to and from a reservoir site. Issues to be Resolved The current study will include the impoundment at the Winburn site as the most feasible alternative for increasing storage along Ashland Creek. An updated cost estimate will be prepared based on the estimate from the 1998 Plan. 3.5 Groundwater Groundwater in the Ashland area is used for small capacity irrigation and domestic supply. Under this alternative the use of groundwater would be expanded to increase use for irrigation and domestic supply. Summary of Past Projects The City has completed two planning studies related to groundwater (1998 Comprehensive Plan, and 1977 Water Resources Management Plan and Facility Study). Both the studies express several concerns about the overall viability of using groundwater as a supply alternative for the City. The 1977 Water Resources Management Plan and Facility Study states that in a report prepared by the USGS, the availability of groundwater in the Ashland area to be of very low productivity and capable if yielding only 5 to 15 gallons per minute (gpm) from each well site. Although small wells may be utilized to augment limited portions of the City s distribution system, the reports ultimately did not select groundwater as a feasible option for the City due to significant costs. August 2010 pw://carollo/documents/client/or/ashland/8406a00/deliverables/wcrs/att A/TM1_GapAnalysis.docx 8
27 Issues to be Resolved Under this contract, costs for utilizing groundwater wells as a supply source will be reevaluated. The City has requested that the study area be increased beyond the immediate City of Ashland area to identify potential significant sources. Potential for raw water aquifer storage and recovery (ASR) will also be evaluated, depending on the outcome of the initial groundwater study. Cost estimates for any viable sources will be developed, based on those developed in the 1998 Comprehensive Plan, with additional costs for required infrastructure to connect wells to the Ashland distribution or raw water system. 4.0 DATA GAP SUMMARY FOR COMPREHENSIVE WATER MASTER PLAN A summary of the data gaps identified for the CWMP is presented herein. Each section summarizes additional deficiencies that should be addressed to provide a complete, updated plan. There are selected elements in the new plan that have not been addressed in previous plans, including the Operations and Maintenance Evaluation. As there is no previous work to be incorporated, these items are not discussed herein. The City completed a water master plan in 1977 (Comprehensive Water Plan), with updates in the form of the 1998 Comprehensive Water Supply Plan, 2001 Water Pipeline Evaluations, 2002 Water Distribution Analysis and CIP, 2003 Water Master Plan Review, and the 2006 Water Distribution Modeling Services. This CWMP will incorporate the findings of these previous documents, updated as outlined below, and will address additional system components and conditions not covered in the previous studies. The following sections describe the data gaps for each of the main components of the CWMP. 4.1 Population and Demand Projections and Conservation Summary of Past Projects Population and demands projections have been developed as a part of numerous studies over the past 12 years. The population and demand projections from the studies are summarized in Tables 1 and 2, respectively. The approaches used in the studies were as follows: 1998 Comprehensive Water Supply Plan. This plan intended to project water demands based on growth of different types of water customers. However, growth for different customer classes was unavailable and the plan developed flow projections based on general population growth and per capita demands. This plan assumed 10 percent of all water produced was lost as unaccounted-for water. The population growth rate was assumed to be 1.4 percent per year. This document used historical demands per month from 1993 to The report selected a per capita consumption of 140 gallons per capita per day (gpcd), though the average from 1996 to 1997 was 148 gpcd. The August 2010 pw://carollo/documents/client/or/ashland/8406a00/deliverables/wcrs/att A/TM1_GapAnalysis.docx 9
28 lower value was used to reflect assumptions in conservation (20 percent reduction of peak demands) Update to the Wastewater Facilities Plan and Permitting Evaluation. This update included a population projection for the City assuming an average of 1 percent growth per year, as prescribed by the Community Development Department Water Distribution Analysis & CIP. This analysis included population and demand projections. Given various growth rates from different agencies, this report selected a 1.4 percent population growth rate, similar to the 1998 study. This study used a per capita demand of 153 gpcd, a peak day peaking factor of 2.25, and a peak hour peaking factor of TAP Preliminary Engineering Report. This report reviewed water production from the Water Treatment Plant for the years 1998 to The historical average peak day peaking factor from this data was estimated to be 2.0. This plan estimated a peak day demand of 10.0 million gallons per day (mgd) by the year Water Distribution Modeling Services. This study collected the average and maximum monthly demands from 1998 to 2006, but did not develop demand projections. Historical population data are available from Portland State University s Population Research Center (PSU PRC) and have been used in previous studies. These data are also shown in Table 1. The most recent population projections that have been officially adopted by Ashland s City Council were documented in the City s 1981 Comprehensive Plan (1981 Plan). The 1981 Plan projected an increase of 187 people per year, through This represents a percent increase of approximately 0.9 percent per year for 2010; the projected percent growth each year declines as the growth is defined as a fixed number of new people per year. Table 1 Projected Population from Previous Studies City of Ashland Water Conservation and Reuse Study Year (1) 1998 CWSP 2002 Water Distribution Model , Wastewater Fac. Plan Portland State University Population Research Center ,350 19, ,770 19, ,034 20, , , ,743 20,880 August 2010 pw://carollo/documents/client/or/ashland/8406a00/deliverables/wcrs/att A/TM1_GapAnalysis.docx 10
29 Table 1 Projected Population from Previous Studies City of Ashland Water Conservation and Reuse Study Year (1) 1998 CWSP 2002 Water Distribution Model 2008 Wastewater Fac. Plan Portland State University Population Research Center , ,352 21,630 21, , , ,237 22, , ,838 23, , ,554 24, , , , ,065 Notes: 1. Only years for which data are available are shown. Table 2 Projected Demands from Previous Studies City of Ashland Water Conservation and Reuse Study Year 1998 Comprehensive Water Supply Plan (mgd) 2006 TAP Preliminary Engineering (mgd) ADD MDD ADD MDD Notes: 1. ADD average day demand; MDD maximum day demand. August 2010 pw://carollo/documents/client/or/ashland/8406a00/deliverables/wcrs/att A/TM1_GapAnalysis.docx 11
30 Issues to be Resolved The City s population for the last five years will be established, using data from the PSU PRC. Based on discussions with City staff, it is anticipated that the population projections from the City s 1981 Comprehensive Plan will be extended through 2060 and used directly for this study. New demand projections will be developed based on: Historical per capita demands for the past 5 years, based on historical population and total water supply. Projected additional conservation, based on the level of service goal to be established by the Ashland Water Advisory Committee (AWAC). Projected curtailment levels, also to be based on a level of service goal to be established by the AWAC. The current work will also include: An update to the City s curtailment program. A summary of the City s current and future conservation programs, including a summary of historical water use patterns, comparison of per capita demands to similar utilities, development of conservation and curtailment goals, summary of conservation programs and performance to date, proposed new conservation programs, and recommendations. 4.2 Existing System Summary of Past Projects The existing water system, including pipelines, pressure zones, reservoirs, and pump stations was most recently described in the 2002 Water Distribution Analysis & CIP. Previous studies have included a summary of the existing system, but the most recent comprehensive description is provided in this 2002 study. Issues to be Resolved The current system likely has new and replaced infrastructure since the 2002 study. It is anticipated that the City s current GIS data accurately depicts all current pipelines (including diameter, material, and age), valves, meters, and hydrants. The CWMP will summarize the water system as described in previous studies, and will incorporate all system changes since the 2002 study as provided in the GIS data and confirmed by City staff. August 2010 pw://carollo/documents/client/or/ashland/8406a00/deliverables/wcrs/att A/TM1_GapAnalysis.docx 12
31 4.3 Hydraulic Model Summary of Past Projects The City s water system was first modeled by Lee Engineering in the 2002 Water Distribution Analysis and CIP. The model was created in H20NET version 3.1 by MW Soft, Inc. Reservoir & pressure reducing valve (PRV) settings were included in the 2003 Water Master Plan Review. The model was since updated to InfoWater in the 2006 Water Distribution Model project. General setpoints are included in the City s existing hydraulic model. The 2003 Water Master Plan Review assigned water demands based on land use by developing demands per acre for each land use category. This methodology was used to distribute the demands to the correct locations in the hydraulic model. The 2006 project included a limited calibration of the Infowater model, consisting of comparison of static pressures within the model to those from hydrant tests previously conducted by City staff. The model was found to have slightly higher pressures (5-15 psi) than the actual system, but this difference was not thought to significantly affect the evaluations conducted at that time. Issues to be Resolved For this CWMP, the demands will be updated according to the new demand projections, maintaining the current demand distribution within the model. New system infrastructure and facilities since the 2006 model will be added. Settings for pump stations and PRVs will be verified for accuracy with City operations staff. The hydraulic model may also be calibrated based on hydrant tests to be conducted by City staff, based on both static pressures and pressures/flows during flow tests, in preparation for the system analysis. 4.4 System Analysis Summary of Past Projects Distribution System The 2007 Water Distribution Model Project established the following criteria for pipelines: Commercial area fire flow criterion of flow of 4,000 gpm for 4 hours, with a maximum pipeline velocity of 10 feet per second (fps) and minimum residual pressure of 20 pounds per square inch (psi). Residential area fire flow criterion of flow of 1,500 gpm for 2 hours, with a maximum velocity of 10 fps and minimum residual pressure of 20 psi. Improvements were recommended to address the following challenges: Improved fire flows at Ashland Community Hospital and Ashland High School. August 2010 pw://carollo/documents/client/or/ashland/8406a00/deliverables/wcrs/att A/TM1_GapAnalysis.docx 13
32 New service to developments in the Railroad and Crowman Districts. Improved fire flows within the Loop Road Area (discussed below). Improved system looping to generally improve supply and fire flow capabilities. Potential elimination of the South Mountain Pump Station. Upgrades to the Park Estates Pump Station to increase usable capacity in Crowson Reservoir and potentially serve the current South Mountain Pump Station service area. Potential increases to the Alsing and Fallon Reservoir service areas to increase reservoir turnover. Isolation of the Crowson and Granite Reservoir service areas to improve turnover in Granite Reservoir. Some of the above evaluations also included consideration of pump stations and storage facilities, as discussed in the appropriate sections below. Few of the recommended improvements have been implemented, pending the outcome of the current evaluation. Pump Station Analysis The 2005 TAP Pipeline Preliminary Engineering established the following criteria for pump stations: The pumps are required to fill the operational storage volume in the reservoir within 12 hours during maximum day demand conditions. The pumps need to refill the fire suppression storage volume within 24 hours of a fire event. The pumps are required to refill the emergency storage volume within 24 hours. As noted above, the 2007 Water Distribution Model reviewed the option of removing the South Mountain Pump Station, and increasing the capacity of the Park Estates Pump Station. However, a general evaluation of pump station capacity has not recently been conducted. Storage Analysis The 2005 TAP Pipeline Preliminary Engineering Report TM 2 (Revised, August 2006) used the following storage criteria, which were first established in the 2003 Water Master Plan Review: Operational Storage of 25 percent of MDD. Emergency Storage of 50 percent of MDD. Fire Flow Storage based on land use in the area served by each reservoir. August 2010 pw://carollo/documents/client/or/ashland/8406a00/deliverables/wcrs/att A/TM1_GapAnalysis.docx 14
33 4,000 gpm for four hours for Granite and Crowson Reservoir service areas which include commercial properties (0.96 MG). 1,500 gpm for two hours for Fallon and Alsing Reservoir services areas, which are residential only (0.18 MG). Two fires at 4,000 gpm for four hours system-wide (1.92 MG). It was assumed that if the City implemented a redundant potable source that emergency storage requirements could be reduced below the above recommendations. Under projected 2005 conditions, the overall storage requirement was 7.55 MG, which was 1.53 MG in excess of the currently available storage (6.02 MG). There is excess storage in the Alsing and Fallon service areas, with significant shortages in the Crowson and Granite areas. The storage deficiency was projected to increase to 3.40 MG in the future (or 1.90 MG with the reduced storage requirements associated with the TAP Pipeline). The August 2006 Revision to TM 2 recommended that the City implement the following storage projects: Construction of a new 1.5 MG TAP Reservoir that would serve as terminal storage for the TAP Pipeline. Construction of a new 0.75 MG Reservoir in the Ashland Loop Road area, which would serve the area currently served by the Park Estates Pump Station. City staff noted that these new reservoirs would overlap with the Crowson Reservoir service area, and that an additional Crowson Reservoir is desired. In February 2007, a further Amendment was developed to TM 2, based on the City s interest in evaluating whether the TAP Pipeline could be implemented without a designated terminal storage reservoir. The 2007 Amendment proposed the following combination of storage and projects to meet the projected storage needs: Construction of a new 1.5 to 2.0 MG Crowson II Reservoir to operate in parallel with the existing Crowson Reservoir. Construction of a new 0.2 MG reservoir in Zone 5 (Loop Road Reservoir), which would serve the area currently served by the Park Estates Pump Station. Subsequently, the City performed a siting study for these two additional reservoirs (Crowson II and Ashland Loop Road Reservoir Siting Study, October 2006). The Crowson II Reservoir was recommended to be constructed adjacent to the existing reservoir. The siting study found that the best location for the Ashland Loop Road reservoir requires extensive cut and fill, resulting in high costs for the reservoir. However, City staff and Brown and Caldwell indicated that a 50,000 gallon reservoir could be accommodated on the Ashland Loop Road site without extensive cut and fill. August 2010 pw://carollo/documents/client/or/ashland/8406a00/deliverables/wcrs/att A/TM1_GapAnalysis.docx 15
34 Issues to be Resolved Distribution System Previous efforts have reviewed the distribution system for the provision of fire flow at specific locations. As part of this CWMP, the distribution system analysis will use the hydraulic model to evaluate system-wide fire flow availability. Pumping Capacity An evaluation of the pumping capacity of all the City s pump stations has not been included in previous studies. As part of this CWMP, the City s pump stations will be evaluated according to criteria established by the City. Storage Analysis The storage analysis in this CWMP will use data already provided in these previous studies, using updated system demand projections, and will incorporate any revised storage criteria established by the City. The evaluation will include an alternatives analysis for the Loop Road Area, including the following alternatives: Construction of a new Loop Road Reservoir with capacity of 50,000 gallons, with fire flow requirements met through an expanded Park Estates Pump Station. Construction of a new Loop Road Reservoir with capacity of 200,000 gallons, with no fire flow improvements required at the Park Estates Pump Station. No new Loop Road Reservoir, with fire flow requirements met through an expanded Park Estates Pump Station. All alternatives will assume net storage requirements will be met through a Crowson II Reservoir. Whether emergency storage requirements should be adjusted based on whether a redundant potable water supply is implemented will also be evaluated. 5.0 SUMMARY The City has made significant investments in previous studies of both the City s raw water supply and distribution systems. The WCRS and WMCP will draw significantly on previous work, while being updated to reflect the latest available technical data and the values and perspectives of the City of Ashland, as represented by the AWAC. August 2010 pw://carollo/documents/client/or/ashland/8406a00/deliverables/wcrs/att A/TM1_GapAnalysis.docx 16
35 City of Ashland Technical Memorandum 2 Water Needs Analysis WATER CONSERVATION AND REUSE STUDY and COMPREHENSIVE WATER MASTER PLAN FINAL October SOUTHWEST WASHINGTON STREET, SUITE 550 PORTLAND, OREGON (503) FAX (503)
36 City of Ashland Technical Memorandum 2 Water Needs Analysis WATER CONSERVATION AND REUSE STUDY and COMPREHENSIVE WATER MASTER PLAN TABLE OF CONTENTS Page 1.0 INTRODUCTION Historic and Projected Populations Historic Population Projected Population Historical and Projected Demands Without Conservation Historical Demands Projected Demands without Additional Water Conservation... 5 LIST OF TABLES Table 1 Historic Population... 1 Table 2 Projected Population... 2 Table 3 Historical Water Demands... 4 Table 4 Historical Per Capita Demands Based on Supply... 4 Table 5 Historical Per Capita Demands based on Historical Billing Data... 5 Table 6 Projected Water Demands, Including Unaccounted for Water, No Additional Conservation... 6 Table 7 Projected Water Demands, Excluding Unaccounted for Water, No Additional Conservation... 6 LIST OF FIGURES Figure 1 Population Projections... 3 Figure 2 Projected Demands... 7 FINAL June 27, 2011 pw://carollo/documents/client/or/ashland/8406a00/deliverables/wcrs/att B/Attch_B_WaterNeedsAnalysisTM.docx (C) i
37 Technical Memorandum No. 2 WATER NEEDS ANALYSIS 1.0 INTRODUCTION This technical memorandum (TM) reviews the City s historic water system demands and projects future demands. Future demands are projected through 2060 using historic per capita usage and population projections in the City s 1981 Comprehensive Plan. The effect of additional water conservation beyond what the City has already implemented on demands has not been included in this chapter, but is discussed separately in TM 3 - Water Conservation. 1.1 Historic and Projected Populations Historic Population Historic populations and demands were reviewed to calculate the City s typical per capita usage. The Portland State University Population Research Center (PRC) provides current and historical population estimates for the State of Oregon, its counties, and its cities. Historic population in the City of Ashland is shown in Table 1. Table 1 Historic Population City of Ashland Water Conservation and Reuse Study Year Population served , , , , ,505 Notes: (1) Source: Portland State University s Population Research Center Projected Population Population projections from the City s 1981 Comprehensive Plan were used since they are the most recent projections accepted by City Council, and are preferred by the City of Ashland s Planning Department. The Comprehensive Plan projects an annual increase in population of 187 people. Projected populations are shown in Table 2. FINAL June 27, 2011 pw://carollo/documents/client/or/ashland/8406a00/deliverables/wcrs/att B/Attch_B_WaterNeedsAnalysisTM.docx (C) 1
38 Table 2 Projected Population City of Ashland Water Conservation and Reuse Study Year Projected Population , , , , ,326 Notes: (1) Source: City of Ashland Comprehensive Plan (1981). The historic population trend has been somewhat higher than the Comprehensive Plan projections, as shown in Figure 1. For example, historic population from the PRC shows population in 2009 as 21,505, whereas the population projected in 2009 by the Comprehensive Plan is 20,793. However, given the unknowns inherent in projecting future populations, the Comprehensive Plan projections have been very accurate and City planning staff believes that these projections are representative of long-term trends. 1.2 Historical and Projected Demands Without Conservation The term water demand refers to all the water requirements of the system including residential, commercial, governmental, and unaccounted for water. Unaccounted for water is the difference between the volume of water produced at the water treatment plant and the volume of water billed. It includes system losses (i.e., leakage), incomplete billings due to meter inaccuracies, and nonrevenue uses such as pipeline flushing. This section presents the historical and projected demands for the City without taking into account the effects of additional water conservation beyond what the City has already accomplished. It is anticipated that the City will implement additional water conserving measures in the future, as documented in TM 3. Hence, actual projected requirements are anticipated to be lower than documented in this TM Historical Demands The historical water demands are presented in Table 3. Note that since these data are based on production data at the water treatment plant, they include unaccounted for water. There are two main types of demands that are evaluated: average day demand (ADD), which is the total usage averaged over a one-year period and maximum day demand (MDD), which is the peak usage observed on any one day of the year. The City s ADD over the past five years ranged from 2.93 to 3.44 million gallons per day (mgd). The lowest demand year occurred in 2009; during that year there were both voluntary and mandatory curtailments during the summer which likely contributed to overall lower water use when averaged over the year. The City s MDD over the past five years ranged from 6.50 to 7.17 mgd. The average peaking factor (ratio of maximum day to average day FINAL June 27, 2011 pw://carollo/documents/client/or/ashland/8406a00/deliverables/wcrs/att B/Attch_B_WaterNeedsAnalysisTM.docx (C) 2
39 Figure 1 Population Projections FINAL June 27, 2011 pw://carollo/documents/client/or/ashland/8406a00/deliverables/wcrs/att B/Attch_B_WaterNeedsAnalysisTM.docx (C) 3
40 demand) was 2.06 over the 5-year period, excluding data from Data from 2009 were excluded from the average due to the curtailments in that year. Table 3 Year Historical Water Demands City of Ashland Water Conservation and Reuse Study Average Day Demands 1 (mgd) Maximum Day Demands 1 (mgd) Peaking Factor (Max Day/Avg Day) Average (2) Notes: (1) Source: Ashland Water Treatment Plant production data for finished water; this number includes Unaccounted For Water, or losses. (2) Excluding 2009 because of voluntary and mandatory curtailment in that year. Average annual per capita demands were calculated based on two sets of data. First, usage was calculated based on production at the water treatment plant (supply). These data include unaccounted for water. Usage was also calculated based on historical billings; these data do not include unaccounted for water. Per capita demands including unaccounted for water are presented in Table 4. These data are based on the average day production at the water treatment plant, as presented in Table 3, and the historical population, as presented in Table 1. The average per capita demand over the 5-year period was 157 gpcd. Data from 2009 were again excluded in the calculation of the average demands due to curtailments. Table 4 Historical Per Capita Demands Based on Supply City of Ashland Water Conservation and Reuse Study Year Average Day Demands 1 (mgd) Population Per Capita Demands (gpcd) , , , , , Average (2) Notes: (1) Source: Water Treatment Plant production data for finished water; this number includes Unaccounted For Water, or losses. (2) Excluding 2009 because of voluntary and mandatory curtailment in that year. FINAL June 27, 2011 pw://carollo/documents/client/or/ashland/8406a00/deliverables/wcrs/att B/Attch_B_WaterNeedsAnalysisTM.docx (C) 4
41 Average annual per capita demands were also calculated excluding unaccounted for water, as shown in Table 5. These data are based on City billing data and the historical population, as presented in Table 1. The average per capita demand over the 5-year period was 144 gpcd. Data from 2009 were again excluded due to curtailments. Table 5 Year Historical Per Capita Demands based on Historical Billing Data City of Ashland Water Conservation and Reuse Study Average Day Demands 1 (mgd) Population Number of accounts 1 Per Capita Demands (gpcd) ,880 8, ,430 8, ,630 8, ,485 8, ,505 8, Average (2) , Notes: (1) Source: City billing data; excluding TID water and unaccounted for water. (2) Excluding 2009 because of voluntary and mandatory curtailment in that year. The City also bills for Talent Irrigation District (TID) water served to properties in the lower portion of the Ashland Canal. There are also properties within the City limits along the upper portions of the Ashland Canal that are billed directly by TID. TID water is not produced at the City s water treatment plant, and is therefore not reflected in Tables 4 or Projected Demands without Additional Water Conservation Estimates of future water demand were developed based on historic consumption and population forecasts presented in earlier sections. Current (2009) estimates are based on the current (2009) PRC population data. Projected average daily water demands are developed by multiplying the estimated per capita usage by the forecasted population for a given year. The projected demands presented in this memorandum do not consider the demand reductions expected due to additional water conservation beyond what the City is already achieving. Table 6 presents the projected demands including unaccounted for water. These projections are based on an average per capita water use of 157 gpcd, as calculated in Table 4 above. The average day demands were then multiplied by the average peaking factor of 2.06, as calculated in Table 3 above, to calculate projected MDD. Resulting MDD projections ranged from a current demand of 6.96 mgd up to 9.81 mgd in FINAL June 27, 2011 pw://carollo/documents/client/or/ashland/8406a00/deliverables/wcrs/att B/Attch_B_WaterNeedsAnalysisTM.docx (C) 5
42 Table 6 Projected Water Demands, Including Unaccounted for Water, No Additional Conservation City of Ashland Water Conservation and Reuse Study Year Projected Average Day Demands (mgd) Projected Max Day Demands (mgd) (current) Notes: (1) Max Day Demand = Average Day Demand * Peaking Factor Table 7 presents the projected demands excluding unaccounted for water. These projections are based on an average per capita water use of 144 gpcd, as calculated in Table 5 above. The average day demands were then multiplied by the average peaking factor of 2.06, as calculated in Table 3 above, to calculate projected MDD. Resulting MDD projections ranged from a current demand of 6.54 mgd up to 9.23 mgd in Table 7 Projected Water Demands, Excluding Unaccounted for Water, No Additional Conservation City of Ashland Water Conservation and Reuse Study Year Projected Average Day Demands (mgd) Projected Max Day Demands (mgd) (current) Notes: (1) Maximum Day Demand = Average Day Demand * Peaking Factor The overall projections are shown in Figure 2. As noted above, these projections do not include the impact of additional conservation beyond what the City is already achieving. The impact of conservation on projected demands is evaluated in TM 3 Water Conservation. FINAL June 27, 2011 pw://carollo/documents/client/or/ashland/8406a00/deliverables/wcrs/att B/Attch_B_WaterNeedsAnalysisTM.docx (C) 6
43 Figure 2 Projected Demands FINAL June 27, 2011 pw://carollo/documents/client/or/ashland/8406a00/deliverables/wcrs/att B/Attch_B_WaterNeedsAnalysisTM.docx (C) 7
44 City of Ashland Water Conservation and Reuse Study Technical Memorandum 3 Water Conservation Analysis FINAL October SOUTHWEST WASHINGTON STREET, SUITE 550 PORTLAND, OREGON (503) FAX (503)
45 City of Ashland Water Conservation and Reuse Study Technical Memorandum 3 Water Conservation Analysis TABLE OF CONTENTS Page 1.0 INTRODUCTION LEVEL OF SERVICE GOALS CURRENT CONSERVATION PROGRAMS HISTORICAL WATER SAVINGS THROUGH CONSERVATION Per Capita Demands UNACCOUNTED FOR WATER WATER USE PATTERNS Customer Categories Indoor Versus Outdoor COMPARISON WITH OTHER COMMUNITIES CONSERVATION AND CURTAILMENT GOALS Conservation Goals Monthly Demands with Varying Conservation Levels Maximum Day Demands Curtailments POTENTIAL NEW CONSERVATION PROGRAMS RECOMMENDATIONS LIST OF TABLES Table 1 Past Conservation Measures... 2 Table 2 Historical Per Capita... 3 Table 3 Historic Unaccounted For Water... 5 Table 4 Indoor versus Outdoor Uses... 8 Table 5 Historical Residential Per Capita Demands Table 6 Projected Average Day Demands with Varying Levels of Conservation Table 7 Monthly Water Demands for 5 percent Conservation, in Million Gallons Table 8 Monthly Water Demands for 10 percent Conservation, in Million Gallons Table 9 Monthly Water Demands for 15 percent Conservation, in Million Gallons Table 10 Projected Maximum Day Demands with Varying Levels of Conservation Table 11 Conservation Programs Implemented By Other Utilities October 2010 pw://carollo/documents/client/or/ashland/8406a00/deliverables/wcrs/att L/WaterConservationTM.docx (B) i
46 LIST OF FIGURES Figure 1 Historical Per Capita Demands... 4 Figure 2 Water Use by Customer Class... 6 Figure 3 Monthly Trends in Water Use... 7 Figure 4 Indoor and Outdoor Uses... 9 Figure 5 Monthly trend of Indoor and Outdoor Uses Figure 6 Comparison of Per Capita Demands Figure 7 Monthly Demand Projections Figure 8 Project 2060 Monthly Usage Based on 45 Percent Curtailment October 2010 pw://carollo/documents/client/or/ashland/8406a00/deliverables/wcrs/att L/WaterConservationTM.docx (B) ii
47 Technical Memorandum No. 3 WATER CONSERVATION ANALYSIS 1.0 INTRODUCTION This chapter documents the City s current water conservation efforts, historical water use trends, water losses, consumption by customer category, comparison of the City s water use with other communities, and conservation goals for the future. Finally, it documents the projected demands after the effect of water conservation is taken into consideration. Water conserving rate structures are discussed in the Financial Plan chapter and will be developed later in the project. Staffing needs are discussed in the Operations and Maintenance chapter. 2.0 LEVEL OF SERVICE GOALS The assumed demands for the existing supply analysis are based on the level of service goals established by the Ashland Water Advisory Council (AWAC), as discussed in TM 4 Level of Service Goals. There are two key goals that impact the projected demands: 1. Water System Capacity The raw water supply system must be capable of meeting projected demands that have been reduced based on 5 percent conservation in addition to conservation already being achieved by the City. However, the City will have a goal of achieving 15 percent additional conservation. 2. Water System Reliability The raw water supply system must be capable of meeting projected demands assuming 45 percent mandatory curtailments during a severe (approximately 1 in 100 year) drought, in addition to planned conservation levels. Though it was originally intended that the level of service goals would be established prior to initiating the supply evaluation, additional information was needed to support the AWAC in selecting a level of service goal for raw water supply capacity. As such, this TM describes projected demands for three different potential conservation levels: 5, 10 and 15 percent conservation in addition to the conservation already achieved by the City. 3.0 CURRENT CONSERVATION PROGRAMS In the past, the City has implemented various measures to conserve water, such as rebates for ultra low flow and high efficiency toilets, low flow showerheads, efficient washing machines, and dishwashers. Additionally, the City conducts irrigation audits, performs leak detection, and promotes water conservation through its rates and codes. Table 1 summarizes the City s programs and water savings through the years 2005 and In both cases, the savings are cumulative from initiation of the conservation program. Hence, 2005 values document all the October 2010 pw://carollo/documents/client/or/ashland/8406a00/deliverables/wcrs/att L/WaterConservationTM.docx (B) 1
48 water savings the City has accrued since the initiation of its conservation program, including the year values consist of 2005 values plus additional savings from 2006 and Table 1 Past Conservation Measures City of Ashland Water Conservation Analysis Measure Water savings in (gpd) Water savings in (gpd) Toilet rebates 54,600 57,200 Showerhead rebates 40,420 41,070 Washing machine rebates 29,260 33,600 Dishwasher rebates 5,160 6,000 Irrigation audit 9,800 15,600 Leak detection 125, ,000 Rates 135, ,000 Codes 25,000 25,000 New technology 2 15,000 15,000 Total water savings (gpd) 439, ,470 Notes: (1) Information from City staff. (2) Park s irrigation system. 4.0 HISTORICAL WATER SAVINGS THROUGH CONSERVATION 4.1 Per Capita Demands Calculation of per capita demands is useful to compare trends of water use over time, and compare Ashland s water use with other communities. There are two ways to calculate per capita demands based on the amount of water produced, and based on the amount of water consumed. Both these amounts are metered and recorded by the City. Per capita calculation based on the water produced, also known as supply based per capita is done by dividing production at the water treatment plant by total population. This calculation will inherently include the amount of water that is lost through the distribution system. These losses, known as unaccounted for water (UFW), are not captured in the per capita demands calculated using the water consumed. The billings based per capita is calculated from City billing records and does not include UFW. Over the last five years, there has been a significant decrease in the amount of water produced per capita. However, there has not been a significant decrease in the amount of water billed per October 2010 pw://carollo/documents/client/or/ashland/8406a00/deliverables/wcrs/att L/WaterConservationTM.docx (B) 2
49 capita. This does not mean that the City s conservation measures are not working, rather it indicates improved metering and reduction in water losses. Losses are discussed further herein. Table 2 shows historic per capita consumption rates based on supply and billing. Figure 2 shows this information graphically. Both values show decreased usage in 2009, which can be attributed to the voluntary and mandatory curtailments in that year. Table 2 Year Historical Per Capita City of Ashland Water Conservation Analysis Supply based per capita demands 1 Billings based per capita demands Average Notes: (1) Finished water data from City s water treatment plant. (2) Billing data from City staff. (3) The average does not include data from 2009 because of voluntary and mandatory curtailments in that year. 5.0 UNACCOUNTED FOR WATER As discussed above, the difference between the water produced and the water billed is termed unaccounted for water (UFW). UFW includes leakage from the distribution system, metering inaccuracies, and non-metered City uses (e.g., pipeline flushing). Table 3 shows the percentage of UFW over the analysis period. The average UFW over the 5-year period was 8.4 percent, excluding data from The City has maintained a UFW percentage of less than 10 percent, which is considered the industry standard for water conservation, in all years except As noted above, the City has seen a significant decrease in UFW over the past 10 years. This is likely due to two factors: (1) maintenance and replacement of old meters (which tend to under-read over time) and (2) pipeline improvements that have reduced leakage. The UFW was extremely low (0.5 percent) in Such a low value is unexpected and likely reflects an inaccuracy in metering of either produced or billed water. October 2010 pw://carollo/documents/client/or/ashland/8406a00/deliverables/wcrs/att L/WaterConservationTM.docx (B) 3
50 Percapitademand(gpcd) emand(gpcd) Year Supplybased Billingsbased Figure 1 HISTORICAL PER CAPITA DEMANDS WCRS and CWMP City of Ashland
51 Table 3 Year Historic Unaccounted For Water City of Ashland Water Conservation Analysis Water produced 1 (MG) Water billed 2 (MG) Unaccounted For Water 3 (%) Average Notes: (1) Source: Water Treatment Plant production data. (2) City billing data. (3) Calculated percentage of losses. (4) The average does not include data from 2009 because of voluntary and mandatory curtailments in that year. 6.0 WATER USE PATTERNS 6.1 Customer Categories The City bills four kinds of users separately residential, commercial, governmental, and some TID accounts. Given Ashland s land use makeup, residential water uses constitute the majority of the City s water use, followed by commercial, and then governmental. Figure 2 shows a typical breakdown of water uses amongst the City s customer classes. The percentage of UFW is also shown. 6.2 Indoor Versus Outdoor An analysis of indoor versus outdoor uses helps City staff track water use and target water conserving measures most effectively. To evaluate indoor versus outdoor uses, a monthly water use analysis was performed. Figure 3 shows the average daily demand by month over the year. As can be seen from Figure 3, the water use in Ashland is highly influenced by the season, with peak usage occurring around July, and minimum usage occurring during the December through March period. This pattern is typical for municipal water systems. October 2010 pw://carollo/documents/client/or/ashland/8406a00/deliverables/wcrs/att L/WaterConservationTM.docx (B) 5


52 UFW,7% Governmental,12% Commercial,19% Residential,63% NOTE: 2008 data was used to generate the figure as it was most representative of average years. Figure 2 WATER USE BY CUSTOMER CLASS WCRS and CWMP City of Ashland
53 7.00 AverageDailyDemand(mgd) JAN FEB MAR APR MAY JUN JUL AUG SEP OCT NOV DEC Month Figure 3 MONTHLY TRENDS IN WATER USE WCRS and CWMP City of Ashland
54 It is assumed that the minimum water use represents the indoor water use, which stays constant through the year. Additional use beyond this minimum amount is attributed to outdoor use. Table 4 shows the break up of indoor and outdoor uses every month in a typical year. Note, total indoor usage varies each month due to variation in the number of days per month. Table 4 Indoor versus Outdoor Uses City of Ashland Water Conservation Analysis Month Total Demands 1 (MG) Indoor Use 2 (MG) Outdoor Use (MG) January February March April May June July August September October November December Total Notes: (1) Source: 2008 Water Treatment Plant production data for a typical year for finished water; this number includes Unaccounted For Water. (2) Assumes the minimum daily use in December is representative of indoor use through the year. Monthly indoor use is calculated by multiplying the minimum daily use (the average daily use during the month of December) with the number of days in the month. As shown in Table 4, over a one-year period, the total indoor usage (604 million gallons, MG) is similar to total outdoor usage (592 MG). Figure 4 shows the percentage of indoor and outdoor use over the entire year. Figure 5 shows the total water usage for each month in MG, divided into indoor and outdoor usage. October 2010 pw://carollo/documents/client/or/ashland/8406a00/deliverables/wcrs/att L/WaterConservationTM.docx (B) 8
55 Outdoor, 49.5% Indoor, 50.5% NOTE: 2008 data was used to generate the figure as it was most representative of average years. Figure 4 INDOOR AND OUTDOOR USES WCRS and CWMP City of Ashland
56 MonthlyDem mand(mg) Outdoor Demand Indoor Demand 0 JAN FEB MAR APR MAY JUN JUL AUG SEP OCT NOV DEC Month Figure 5 INDOOR AND OUTDOOR MONTHLY TRENDS WCRS and CWMP City of Ashland
57 It is understood that the population of the City increases during the summer due to tourism. Hence, a portion of the increased summer water usage is due to increased indoor water usage due to tourism, and not only due to outdoor water usage. However, as commercial usage accounts for only around 20 percent of total City usage, this amount was assumed to be small and the influence of seasonal population on indoor versus outdoor usage was not included in the study. 7.0 COMPARISON WITH OTHER COMMUNITIES The average historical per capita water demand for the City of Ashland is 157 gpcd including UFW. Figure 6 shows the per capita demand of Ashland compared with other communities and the national average. Note that various communities calculate water losses at varying points in the system, and report per capita demands in different ways. Figure 6 does not account for those differences. Water use varies significantly among communities due to region, climate and socioeconomic factors, as well as due to conservation measures. In the United States, the regional differences in per capita demands are largely due to variations in outdoor water use. The impact of climate can be seen in comparing the California average (229 gpcd) to the nationwide average (160 gpcd). One example of the impact of socioeconomic factors is a comparison between per capita usage in Tualatin Valley Water District (TVWD) and the City of Lake Oswego. Both communities are located in the Portland metropolitan area and have similar climates; however, Lake Oswego has a relatively wealthier population on average. As expected, the per capita usage in TVWD (117 gpcd) is significantly less than that for Lake Oswego (170 gpcd). Due to these factors, it is not possible to do a true apples to apples comparison of the City of Ashland to other communities. However, it can be noted that the City of Ashland s per capita consumption (157 gpcd) is below the national average (160 gpcd), and well below the California average (229 gpcd). However, it is not as low as communities that have implemented very aggressive conservation programs, such as the City of Santa Cruz (107 gpcd, estimated to be 117 gpcd with UFW), indicating that additional conservation could still be achieved. Additionally, Ashland s residential customers were analyzed separately as they constitute approximately 63 percent of the demands. Since it is only possible to calculate the residential uses from the billing data, billings based per capita consumption rates were calculated. The supply-based per capita usage (including UFW) was estimated from these data assuming the percentage of UFW would apply consistently across all customer types. Table 5 documents the trends in residential water use. October 2010 pw://carollo/documents/client/or/ashland/8406a00/deliverables/wcrs/att L/WaterConservationTM.docx (B) 11


58 250 Percapitademands(gpcd) Ashland LakeOswego TVWD (Portland) SantaCruz MarinMunicipal WaterDist. California average National average Figure 6 COMPARISON OF PER CAPITA DEMANDS WCRS and CWMP City of Ashland
59 Table 5 Year Historical Residential Per Capita Demands City of Ashland Water Conservation Analysis Estimated supply-based per capita residential demands 1 Billings-based per capita residential demands Average Notes: (1) Calculated by adding each year s UFW percentage from Table 3. (2) Billing data from City staff. (3) The average does not include data from 2009 because of voluntary and mandatory curtailments in that year. For comparison, the residential water use in a typical single-family American household is 101 gpcd, and Ashland s average at 105 gpcd is just a little over that. However, residential water use also varies considerably by region, climate, and socioeconomic factors. For instance, the residential average varies from approximately 65 gpcd in Boston, to 75 gpcd in Seattle, to 100 gpcd in Tampa, to 220 gpcd in Phoenix CONSERVATION AND CURTAILMENT GOALS 8.1 Conservation Goals The City considered three increasing levels of conservation to help meet its projected demands. The three levels are 5, 10, and 15 percent reduction in existing per capita demands, beyond the level of conservation already being achieved in the City. Table 6 shows the per capita consumption rates and average day demand projections assuming the City achieves 5, 10 and 15 percent reductions. It was assumed that the targeted conservation levels would be reached over a 20-year period (2030), with half of the targeted conservation achieved by Source: Handbook of Water Use and Conservation by Amy Vickers. October 2010 pw://carollo/documents/client/or/ashland/8406a00/deliverables/wcrs/att L/WaterConservationTM.docx (B) 13
60 Table 6 Projected Average Day Demands with Varying Levels of Conservation City of Ashland Water Conservation Analysis 5 percent reduction 10 percent reduction 15 percent reduction Year Per capita demand 1 Total demand 2 Per capita demand 1 Total demand 2 Per capita demand 1 Total demand Notes: (1) In gallons per capita per day. (2) In million gallons per day Monthly Demands with Varying Conservation Levels Based on discussions with City conservation staff and historical water use patterns, it was assumed that 75 percent of the desired reductions by volume would be achieved through outdoor use and 25 percent through indoor use. Because of the planned reductions in outdoor use, the monthly demand curve is projected to be flatter, with a smaller peak in the summer, due to most outdoor demands currently being exerted in the peak months of May through September. The current monthly trend was developed using 2008 data as it was considered to be a typical year. Refer to Figures 3 and 5 for current monthly usage trends. The new monthly usage estimates were calculated as follows, based on an example of 5 percent additional conservation for 2008: Total volume of water to be conserved (59.8 MG) was calculated by multiplying the conservation level (5 percent) by total usage ( MG). Indoor savings (14.9 MG) were calculated as 25 percent of total conservation savings (59.8 MG). These savings were divided equally over the 12 months of the year. Outdoor savings (44.8 MG) were calculated as 75 percent of the total conservation savings (59.8 MG). This was converted into a 9 percent reduction in outdoor use over the high use period (May through September) by dividing the conserved amount (44.8 MG) by the total outdoor usage over that period (514.7 MG). This percent reduction was then applied to outdoor use in each of those months. October 2010 pw://carollo/documents/client/or/ashland/8406a00/deliverables/wcrs/att L/WaterConservationTM.docx (B) 14
61 Total usage under 5 percent additional conservation was then calculated as the sum of the revised indoor and outdoor usage projections. The resulting monthly demands for each level of conservation are shown in Tables 7,8, and 9 and presented graphically in Figure 7. These values were converted into monthly peaking factors which were applied to future demand projections to estimate future monthly demands with the new conservation levels. Table 7 Month Monthly Water Demands for 5 percent Conservation, in Million Gallons City of Ashland Water Conservation Analysis Total Current Demands 1 Indoor Use 2 Outdoor Use Reduced Indoor Use Reduced Outdoor Use Total Reduced Monthly Use Reduction % Jan Feb Mar Apr May Jun Jul Aug Sept Oct Nov Dec Total Notes: (1) Source: 2008 Water Treatment Plant production data for a typical year for finished water; this number includes Unaccounted For Water. (2) Assumes the minimum daily use in December is representative of indoor uses through the year. Monthly indoor use is calculated by multiplying the minimum daily use with the number of days in the month. October 2010 pw://carollo/documents/client/or/ashland/8406a00/deliverables/wcrs/att L/WaterConservationTM.docx (B) 15
62 Table 8 Month Monthly Water Demands for 10 percent Conservation, in Million Gallons City of Ashland Water Conservation Analysis Total Current Demands 1 Indoor Use 2 Outdoor Use Reduced Indoor Use Reduced Outdoor Use Total Reduced Monthly Use Reduction % Jan Feb Mar Apr May Jun Jul Aug Sept Oct Nov Dec Total Notes: (1) Source: Water Treatment Plant production data for a typical year for finished water; this number includes Unaccounted For Water, or losses data were used. (2) Assumes the minimum daily use in December is representative of indoor uses through the year. Monthly indoor use is calculated by multiplying the minimum daily use with the number of days in the month. Table 9 Month Monthly Water Demands for 15 percent Conservation, in Million Gallons City of Ashland Water Conservation Analysis Total Current Demands 1 Indoor Use 2 Outdoor Use Reduced Indoor Use Reduced Outdoor Use Total Reduced Monthly Use Reduction % Jan Feb Mar Apr May Jun October 2010 pw://carollo/documents/client/or/ashland/8406a00/deliverables/wcrs/att L/WaterConservationTM.docx (B) 16
63 Table 9 Month Monthly Water Demands for 15 percent Conservation, in Million Gallons City of Ashland Water Conservation Analysis Total Current Demands 1 Indoor Use 2 Outdoor Use Reduced Indoor Use Reduced Outdoor Use Total Reduced Monthly Use Reduction % Jul Aug Sept Oct Nov Dec Total Notes: (1) Source: Water Treatment Plant production data for a typical year for finished water; this number includes Unaccounted For Water, or losses data were used. (2) Assumes the minimum daily use in December is representative of indoor uses through the year. Monthly indoor use is calculated by multiplying the minimum daily use with the number of days in the month Maximum Day Demands In TM 2 Water Needs Analysis, maximum day demands were calculated based on projected average day demands and the historical peaking factor of However, under the proposed additional conservation scenarios peak usage will be reduced, reducing the ratio of the maximum day demand to the average day demand. To account for this reduced peak, projected maximum day demands were projected as follows, using 5 percent additional conservation for 2060 as an example: The projected maximum day demand without conservation was calculated based on the historical peaking factor (2.06). The ratio of the peak month under 5 percent conservation (174.4 MG) to the peak month with no additional conservation (187.5 MG) was calculated yielding a ratio of This ratio (0.93) was then multiplied by the projected 2060 maximum day demand without additional conservation (10.1 mgd) to yield the projected 2060 maximum day demand with 5 percent additional conservation (9.4 mgd). The resulting projected maximum day demands are presented in Table 10. As noted above, it is assumed that the targeted conservation level would be achieved by 2030, with half the targeted conservation level achieved by October 2010 pw://carollo/documents/client/or/ashland/8406a00/deliverables/wcrs/att L/WaterConservationTM.docx (B) 17
64 MonthlyDemand(MG) JAN FEB MAR APR MAY JUN JUL AUG SEP OCT NOV DEC Currentusage 5percentconservation 10percentconservation 15percentconservation Figure 7 MONTHLY DEMAND PROJECTIONS WCRS and CWMP City of Ashland
65 Table 10 Year Projected Maximum Day Demands with Varying Levels of Conservation City of Ashland Water Conservation Analysis Projected Demands (million gallons per day) 5 percent reduction 10 percent reduction 15 percent reduction ADD MDD ADD MDD ADD MDD Notes: (1) Assumes half of the targeted additional conservation level is achieved by (2) Assumes the targeted additional conservation level is achieved by Curtailments During drought conditions, water consumption is typically curtailed to conserve supply. As documented in TM 4 Level of Service Goals, the AWAC established a level of service goal of accepting 45 percent curtailments under extreme drought conditions (the estimated 1 in a 100- year drought with projected climate change impacts). The 45 percent curtailment was applied as follows, using 5 percent additional conservation and 2060 demands as an example: It was assumed that maximum month flows projected for the appropriate conservation level would be further reduced by 45 percent. For example, for 5 percent additional conservation for 2060, the projected maximum month demand (258.3 MG) was reduced by 45 percent to yield a curtailed supply volume of MG for the maximum month. For all remaining months where the projected demand exceeds 142 mgd, the demand was assumed to be the curtailment volume (142.0 MG). For months with projected usage less than the curtailment volume, demands were unaffected. The resulting projected monthly usage volumes in MG are shown in Figure 8. October 2010 pw://carollo/documents/client/or/ashland/8406a00/deliverables/wcrs/att L/WaterConservationTM.docx (B) 19

66 Figure 8 MONTHLY USAGE VOLUMES DURING CURTAILMENTS WCRS and CWMP City of Ashland
67 9.0 POTENTIAL NEW CONSERVATION PROGRAMS In order to achieve the conservation goal selected, additional programs will need to be implemented to conserve more water than the City is already conserving with its existing programs. There are several utilities that have implemented aggressive conservation programs, and Ashland could style its new conservation program inspired by the successes of others. Table 11 documents some of the measures that are being implemented by other utilities. The utilities chosen for comparison are the following: East Bay Municipal Utility District (EBMUD), Oakland, California. Denver Water, Denver, Colorado. Eugene Water and Electricity Board (EWEB), Eugene, Oregon. City of Santa Barbara, California. City of Corvallis, Oregon. October 2010 pw://carollo/documents/client/or/ashland/8406a00/deliverables/wcrs/att L/WaterConservationTM.docx (B) 21
68 October pw://carollo/documents/client/or/ashland/8406a00/deliverables/wcrs/att L/WaterConservationTM.docx (B) Table 11 Conservation Programs Implemented By Other Utilities City of Ashland Water Conservation Analysis Program Description Ashland EBMUD 1 Denver Water Water audits by staff Self audit kits/ information Toilet rebates Clothes washer rebates Sub-meter incentives Lawn conversion rebate Irrigation efficiency program Sprinkler timer rebate Smart irrigation controller rebates Free conserving devices Daily/ weekly irrigation information Free rain sensors Car wash certification Xeriscape design information Watering restrictions Water budget calculator Mulch discount Cooling towers Pre-rinse spray nozzles Water broom rebates Rainwater harvesting Graywater reuse Residential indoor and landscape water surveys to help customers identify ways to save water Provide water wise kits to customers to conduct a self audit on their houses, or information on website on how to conduct a water audit Customers receive money for upgrading toilets to more efficient models Customers receive money for upgrading washers to more efficient models Multifamily customers receive money for installing sub-meters within the complex to better monitor water use by family EWEB 2 Santa Barbara 3 Corvallis 4 (8) dishwasher & refrig also (6) Customers receive money for converting lawns to water efficient landscaping (6) Commercial and large irrigation customers receive money for reducing annual water use by fixed amounts Customers receive money for installing timers on their sprinkler systems Customers receive money for installing weather-based irrigation controllers Customers receive free devices to conserve water such as low flow showerheads, faucet aerators, hose nozzle, toilet flush bag, Website provides daily/weekly updates on optimum watering for the week, or latest weather information Customers receive free sensors that shut off irrigation systems during or after a rain event Based on certain set criteria, car washes are issued Water Efficiency Certificates Water efficient landscape design guidelines, plant guides Customers are not allowed to water during certain times of day Provide customers with online tools to help calculate their optimum water use Provide customers with financial incentives to apply mulch Provide commercial customers with incentives to improve water efficiency in cooling towers Provide commercial customers (particularly restaurants and schools) with water efficient spray nozzles Commercial customers receive money for installing water efficient cleaning devices Provide customers with information to install rainwater capture systems at home Provide customers with information to install graywater systems at home Notes: (1) East Bay Municipal Utility District (2) Eugene Water and Electricity Board (3) City of Santa Barbara (4) City of Corvallis (5) (5) (6) (5) (5) Updates needed Only in curtailment (6) (6) Part of a package (5) (8) (8) (5) Not recommended by Staff (6) Staff expressed interest in adding (7) Updates recommended (8) Staff recommends Information Only
69 10.0 RECOMMENDATIONS Meeting the 15 percent conservation target identified by the AWAC will required significant expansion of the City s current conservation efforts, including additional staffing and funding for programs. The next step is for the City to conduct a detailed Water Conservation Study to evaluate the various potential measures to identify the costs and implementation issues associated with them, and select those that will most cost-effectively achieve the desired demand reductions. Until that study is complete, it is recommended that the City continue its existing water conservation programs, and continue to improve public education and awareness on the importance of water conservation. October 2010 pw://carollo/documents/client/or/ashland/8406a00/deliverables/wcrs/att L/WaterConservationTM.docx (B) 23
70 City of Ashland Water Conservation & Reuse Study (WCRS) & Comprehensive Water Master Plan (CWMP) Technical Memorandum 4 Level of Service Goals FINAL October SOUTHWEST WASHINGTON STREET, SUITE 550 PORTLAND, OREGON (503) FAX (503)
71 City of Ashland Water Conservation & Reuse Study (WCRS) & Comprehensive Water Master Plan (CWMP) Technical Memorandum 4 Level of Service Goals TABLE OF CONTENTS Page 1.0 INTRODUCTION ORGANIZATIONAL OVERVIEW LEVEL OF SERVICE GOALS OVERVIEW Water System Capacity Water System Reliability Water System Redundancy Regulatory Requirements SUMMARY... 6 LIST OF TABLES Table 1 Ashland Water Advisory Council Members... 3 Table 2 Selected LOS Goals... 6 LIST OF FIGURES Figure 1 Organizational Structure for the WCRS and CWMP... 2 Figure 2 Summary of the AWAC s Role... 2 FINAL October 14, 2010 pw://carollo/documents/client/or/ashland/8406a00/deliverables/wcrs/att C/Existing Supply Evaluation.docx (A) i
72 Technical Memorandum No. 4 LEVEL OF SERVICE GOALS 1.0 INTRODUCTION The City of Ashland is developing a Water Conservation and Reuse Study (WCRS) and Comprehensive Water Master Plan (CWMP) to identify needed improvements to the City s water supply system. As part of the WCRS and CWMP, the City established both an Ashland Water Advisory Council (AWAC) and a Technical Review Committee (TRC). This technical memorandum describes these two groups, the overall process for selecting a water supply package, and the establishment of level of service (LOS) goals. 2.0 ORGANIZATIONAL OVERVIEW The organizational structure for the WCRS and CWMP is shown in Figure 1. As shown in the figure, final decision making authority for selecting a water supply package remains with the Ashland City Council. The role of the AWAC is to serve as an advisory group to the Council and the City s water staff, providing a link with the community and involving impacted persons and interest groups with the WCRS and CWMP. The TRC is intended to provide technical review and input to the consultant s work, supporting the AWAC and Council in their decision making processes. Finally, the Consultant Team (led by Carollo Engineers) is responsible for conducting the majority of the technical work to support the WCRS and CWMP, in accordance with the Consultant s contract scope of work. The AWAC was established in accordance with the City of Ashland s committee policies and is intended to be in existence throughout development and implementation of the water supply program. The AWAC s authority is limited to collecting information, conducting analyses and making recommendations. All position statements or recommendations of the Committee are to be transmitted by its Chairman to the City Council. The role of the AWAC within the WCRS and CWMP is shown in Figure 2. The AWAC role includes the following: Establishing level of service (LOS) goals to be used to define the water supply packages. Providing ongoing feedback to the TRC and Consultant Team. Evaluating the water supply packages developed by the Consultant Team according to the criteria established by the AWAC. Selecting the AWAC s Preferred Water Supply Package and conveying the AWAC recommendation to City Council. FINAL October 14, 2010 pw://carollo/documents/client/or/ashland/8406a00/deliverables/wcrs/att C/Existing Supply Evaluation.docx (A) 1


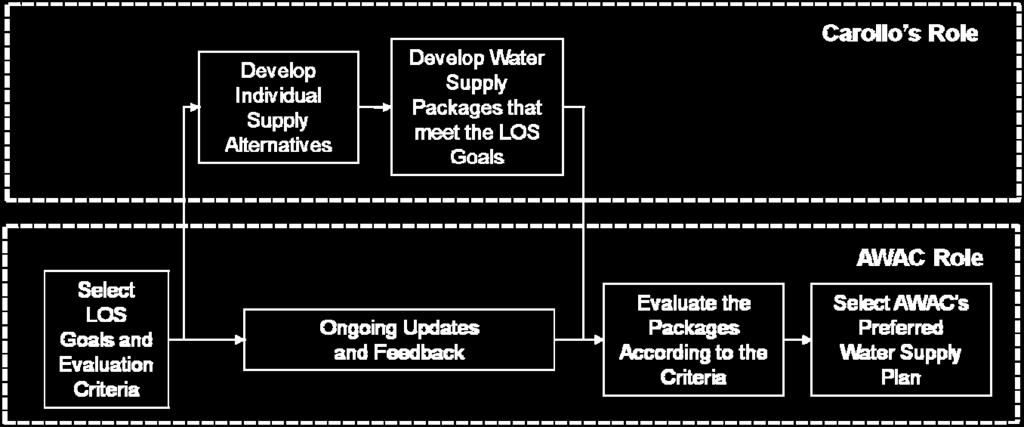
73 Figure 1 Organizational Structure for the WCRS and CWMP Figure 2 Summary of the AWAC s Role FINAL October 14, 2010 pw://carollo/documents/client/or/ashland/8406a00/deliverables/wcrs/att C/Existing Supply Evaluation.docx (A) 2
74 The AWAC has a total of eleven members, as listed in alphabetical order in Table 1. At the first AWAC meeting, the decision was made to have Richard Whitley, a member of the Consultant Team, serve as a non-voting AWAC chairperson. Table 1 AWAC Member Ashland Water Advisory Council Members City of Ashland Level of Service Goals Affiliation Pat Acklin Lesley Adams Alex Amarotico Darrell Boldt Kate Jackson Donna Mickley Don Morris Amy Patton Donna Rhee Carol Voisin John Williams At large member (Southern Oregon University Geography Department) Rogue Riverkeeper - Klamath/Siskiyou Wildlands Center Chamber of Commerce Board City System Development Charge Committee Member City Councilor United States Forest Service At large member Interested Citizen At large member City Councilor Forest Lands Committee 3.0 LEVEL OF SERVICE GOALS OVERVIEW LOS goals were established in four areas, as follows: Water system capacity; Water system reliability; Water system redundancy; and Regulatory requirements. The LOS goals were selected by the AWAC through a number of meetings, as follows: April 15, The LOS concept was presented to the AWAC with examples of potential LOS goals. May 5, The AWAC received input from the public at an open listening session. FINAL October 14, 2010 pw://carollo/documents/client/or/ashland/8406a00/deliverables/wcrs/att C/Existing Supply Evaluation.docx (A) 3
75 June 2, Potential LOS goals in the four areas were presented to the AWAC along with supporting information. The AWAC was directed that they could select either one of the proposed LOS goal levels, or develop an alternative LOS goal in each of the four goal areas. June 10, Three of the four LOS goals were selected at a supplementary AWAC meeting, consisting of those for water system reliability, water system redundancy, and regulatory requirements. July 19, The final LOS goal, for water system capacity, was selected by the AWAC, based on additional information provided on the capacity of existing supplies. Additional information on the four specific LOS goal areas is provided herein. 3.1 Water System Capacity The final selected LOS goal for water system capacity is as follows: Have sufficient supply to meet projected demands that have been reduced based on 5 percent additional conservation. Potential levels presented to the AWAC for consideration consisted of 5, 10 and 15 percent additional conservation. However, the AWAC was not limited to these levels. The AWAC decided that a 5 percent conservation level, in addition to conservation already being achieved by the City, was appropriate for water supply planning. However, the AWAC also recommends that the City set a goal of achieving 15 percent additional conservation. This compromise was developed based on the range of conservation levels preferred by the various AWAC members, with preferences including the proposed 5, 10 and 15 percent additional conservation levels. The water system capacity LOS goal was established based on background information provided on the following: Conservation levels already achieved by the City. Comparison of per capita usage in Ashland compared to other communities; and Resulting projected shortages in raw water supply and water treatment plant capacity for the various potential conservation levels. 3.2 Water System Reliability The final selected LOS goal for water system reliability is as follows: Community will accept curtailments of 45 percent during a severe drought. A severe drought was defined as an approximately 1-in-100 year event. Potential levels presented to the AWAC for consideration included 30, 40 and 50 percent curtailments. AWAC FINAL October 14, 2010 pw://carollo/documents/client/or/ashland/8406a00/deliverables/wcrs/att C/Existing Supply Evaluation.docx (A) 4
76 members were generally divided between preferences for a 40 or 50 percent curtailment goal; the selected 45 percent goal was reached as a compromise. The water system reliability LOS goal was established based on background information provided on the following: Historical variation in flows available from the Ashland Creek/Reeder Reservoir supply. Projected climate change impacts. Residential per capita usage corresponding to the potential curtailment goal levels; and Comparison to the City s existing curtailment plan. 3.3 Water System Redundancy The final selected LOS goal for water system redundancy is as follows: Implement redundant supply project to restore fire protection and supply for indoor water use shortly after a treatment plant outage. Potential levels presented to the AWAC for consideration consisted of the following: Have sufficient redundant supplies to meet restricted indoor water usage requirements during a WTP outage. Have sufficient redundant supplies to meet average day demands during a WTP outage. Have sufficient redundant supplies to have no reduction in service during a WTP outage. The final wording identified by the AWAC represents the AWAC s desire to improve water system redundancy, while not unnecessarily limiting the water supply alternatives being considered. The water system redundancy LOS goal was established based on background information provided on the following: Vulnerability of the existing water treatment plant to natural disasters, including floods, landslides, and fire. Limitations of existing finished water storage. Impacts of loss of pressure in the distribution system. FINAL October 14, 2010 pw://carollo/documents/client/or/ashland/8406a00/deliverables/wcrs/att C/Existing Supply Evaluation.docx (A) 5
77 3.4 Regulatory Requirements The final selected LOS goals for regulatory requirements is as follows: Meet or exceed all current and anticipated regulatory requirements. No alternatives were provided to the AWAC for this LOS goal and no alternate levels were suggested by the AWAC. 4.0 SUMMARY The LOS goals, as selected by the AWAC, are summarized in Table 2. Table 2 Goal Area Selected LOS Goals City of Ashland Level of Service Goals Goal Water System Capacity Water System Reliability Water System Redundancy Regulatory Requirements Have sufficient supply to meet projected demands that have been reduced based on 5 percent additional conservation. Community will accept curtailments of 45 percent during a severe drought. Implement redundant supply project to restore fire protection and supply for indoor water use shortly after a treatment plant outage. Meet or exceed all current and anticipated regulatory requirements. FINAL October 14, 2010 pw://carollo/documents/client/or/ashland/8406a00/deliverables/wcrs/att C/Existing Supply Evaluation.docx (A) 6
78 City of Ashland Water Conservation & Reuse Study (WCRS) & Comprehensive Water Master Plan (CWMP) Technical Memorandum No. 5 Existing Supply Evaluation FINAL October SOUTHWEST WASHINGTON STREET, SUITE 550 PORTLAND, OREGON (503) FAX (503)
79 City of Ashland Water Conservation & Reuse Study (WCRS) & Comprehensive Water Master Plan (CWMP) Technical Memorandum No. 5 Existing Supply Evaluation TABLE OF CONTENTS Page 1.0 INTRODUCTION EXISTING RAW WATER SUPPLIES Ashland Creek Rights and Agreements Reliability of Supply Talent Irrigation District (TID) Existing Rights and Contracts Reliability System Yield CLIMATE CHANGE IMPACTS PROJECTED DEMANDS Level of Service Goals Average Monthly Demands Maximum Day Demands WATER SUPPLY MODEL Drought Scenario with Climate Change in-10 Year Drought Summary of Capacity Requirements Timing of Additional Supply Requirements WATER TREATMENT CAPACITY SUMMARY APPENDIX A - Ashland Creek Water Rights APPENDIX B - TID Contracts FINAL October 14, 2010 pw://carollo/documents/client/or/ashland/8406a00/deliverables/wcrs/tm 05/TM 5_ExistingSupplyEvaluation.docx (A) i
80 LIST OF TABLES Table 1 Ashland Creek Water Rights... 2 Table 2 Estimated Yield from Existing Sources... 5 Table 3 Average Day Demands Table Drought Scenario: Additional Supply Requirements Table with Climate Change Scenario: Additional Supply Requirements Table 6 1-in-10 Year Scenario: Additional Supply Requirements Table 7 Summary of Supply Model Analysis Table 8 Timing of Additional Supply Requirements Table 9 Projected Shortages for the 1-in-10 Year Drought Table 9 Water Treatment Plant Capacity Evaluation LIST OF FIGURES Figure 1 Historical Streamflows to Reeder Reservoir... 3 Figure 2 Estimated Streamflows Based on Climate Change Modeling... 7 Figure 3 Worst Year on Record Based on Climate Change Analysis... 8 Figure 4 Year 2060 Monthly Demands with Different Conservation Levels Figure 5 Year 2060 Monthly Demands with Conservation and Curtailment Figure 6 Schematic of Existing Supply Model Figure Drought Scenario: Total Supplies Figure Drought Scenario: Supply Analysis with 5 Percent Conservation Figure with Climate Change Scenario: Supply Analysis with 5% Conservation19 Figure 10 1-in-10 Year Scenario: Supply Analysis with 5% Conservation Figure 11 Year 2010 Supply Analysis without Climate Change and 5% Conservation.. 23 Figure 12 Year 2030 Supply Analysis without Climate Change and 5% Conservation.. 24 Figure 13 Year 2050 Supply Analysis with Climate Change and 5% Conservation Figure 14 Supply Requirements Projected with 5 Percent Conservation Figure 15 Project Water Treatment Plant Capacity Requirements FINAL October 14, 2010 pw://carollo/documents/client/or/ashland/8406a00/deliverables/wcrs/tm 05/TM 5_ExistingSupplyEvaluation.docx (A) ii
81 Technical Memorandum No. 5 EXISTING SUPPLY EVALUATION 1.0 INTRODUCTION The City of Ashland (City) receives water from Ashland Creek and Reeder Reservoir and from the Talent Irrigation District (TID). These supplies are treated at the Ashland Water Treatment Plant and delivered to the distribution system and the City s customers. The purpose of this technical memorandum (TM) is to evaluate the volume available from these supplies and estimate if they will meet the level of service goals developed by the Ashland Water Advisory Council (AWAC). This includes both an evaluation of the raw water supplies to meet projected demands over a multi-year period, as well as an evaluation of the ability of the water treatment plant to meet projected maximum day demands. 2.0 EXISTING RAW WATER SUPPLIES 2.1 Ashland Creek Ashland Creek is located in Jackson County, Oregon, United States, near Interstate 5 and the California border, in the south end of the Rogue Valley. The West Fork basin has an area of 10.5 square miles and the East Fork basin has an area of 8.14 square miles. Both branches of Ashland Creek drain to Reeder Reservoir. Water from Ashland Creek can be taken from Reeder Reservoir or from direct diversions on the East and West Forks of Ashland Creek. Reeder Reservoir was formed by the construction of Hosler Dam in The dam is located just below the confluence of the East and West Forks and impounds 860 acre-feet (AF) or 280 million gallons (MG) of water. However, due to the reservoir configuration, it was assumed that 20 percent of the reservoir volume is unavailable, based on input from City staff. The volume of water available from the Ashland Creek/Reeder Reservoir supply is dependent upon yearly stream flow runoff Rights and Agreements The City has owned water rights on Ashland Creek since the 1880 s. Table 1 summarizes Ashland s ditch rights to this water. This information is based on the letter furnished to the City by State Watermaster in A copy of this letter is presented in Appendix A. A more detailed evaluation of existing water rights is presented in TM 12 Water Rights Evaluation Reliability of Supply The reliability of the Ashland Creek supply is determined by analyzing influent stream flows that can either be used directly or stored in Reeder Reservoir. Stream flows in Ashland Creek have been measured periodically since 1924 by the US Geological Survey (USGS) and the City. The USGS records include the periods October 1924 to January 1933, December 1974 to FINAL October 14, 2010 pw://carollo/documents/client/or/ashland/8406a00/deliverables/wcrs/tm 05/TM 5_ExistingSupplyEvaluation.docx (A)
82 September 1982, and October 2002 to the present. In each case, the measurements were made in the East and West Forks separately near their confluence. Table 1 Ashland Creek Water Rights (1) City of Ashland WCRS & CWMP Total Creek Flow, cfs Ashland Rights, cfs Ditch Rights, cfs (2) Notes: (1) Based on letter from State Engineer s office dated July 5, (2) Ditch rights interpolated; value stated in the State Engineer s letter (1.149 cfs) appears incorrect. Previous reports have estimated the flow from Ashland Creek for three drought conditions: a one-year critically dry period based on historical stream flow data from (Montgomery, 1977), a three-year critically dry period based on historical stream flow data from (Carollo, 1998), and a one-year critically dry period based on a drought scenario with an assumed probability of occurrence of 1 in 50 years (Beck, 1989). For this evaluation the stream flow analysis was conducted similar to the work completed in 1998, using stream flow data from 1928 to For context, Figure 1 presents historical Ashland Creek streamflows to Reeder Reservoir during the two worst years of record (1930 and 1931) and compares them to the recent dry year (2009). FINAL October 14, 2010 pw://carollo/documents/client/or/ashland/8406a00/deliverables/wcrs/tm 05/TM 5_ExistingSupplyEvaluation.docx (A)


83 FINAL October 14, pw://carollo/documents/client/or/ashland/8406a00/deliverables/wcrs/tm 05/TM 5_ExistingSupplyEvaluation.docx (A) Figure 1 Historical Streamflows to Reeder Reservoir
84 2.2 Talent Irrigation District (TID) TID water is supplied to the City from the Ashland Canal, the lower portion of which is owned and operated by the City of Ashland. The TID water supply was developed through construction of a series of reservoirs and canals which deliver water to the Ashland, Talent, Phoenix, and Medford areas, primarily for irrigation. TID water is delivered to customers within the City in two ways. Of importance to the current analysis are water rights owned by the City that are delivered to the City s water treatment plant via the Terrace Street Pump Station and distributed to customers through the potable water distribution system. In addition, there are a number of properties within the City that have TID water rights for irrigation use, that are mostly delivered via the Ashland Canal. These irrigation rights are not considered in the supply analysis described in this TM; the usage is unmetered and has not been included in projected demands. Further information about the TID system is provided in TM 10 Talent Irrigation District Supply Existing Rights and Contracts Detailed information on TID contracts and historical TID usage is provided in TM 10 Talent Irrigation District Supply. Ashland has a long-standing water supply contract with TID that provides 769 acre*feet (AF) from April through October. However, a portion of this available supply is used by the City to provide irrigation service via the Ashland Canal to a number of properties, including Lithia Park and Southern Oregon University (SOU). Estimated annual usage by these properties is 546 AF, leaving 223 AF available for delivery to the Ashland Water Treatment Plant. The City has also been using an additional 600 AF of TID water under an annual contract with the Bureau of Reclamation. The City is currently negotiating a long-term agreement for this water. This additional TID water was initially assumed to be reserved to meet regulatory requirements or mitigate environmental impacts associated with discharges from the City s Wastewater Treatment Plant, at the City s direction. However, based on current plans for the City s wastewater treatment plant discharges, it is now assumed that this additional TID water will be available for future water supply Reliability The City s contract enables it to receive its entire allotment of water whenever full supply is available. However, the City s contracts provide for a reduction of flow during drought, depending on water availability within the TID supply system. A detailed discussion of contractual entitlements is beyond the scope of this document, however, a summary of the TID contracts is provided in TM 10 Talent Irrigation District Supply. Previous reports estimate that the amount of available supply from TID during a drought will vary between 50 and 80 percent of maximum. Actual historical data varies between 60 and 80 percent during dry years but there is no established trend, particularly for sustained extreme drought conditions as occurred in FINAL October 14, 2010 pw://carollo/documents/client/or/ashland/8406a00/deliverables/wcrs/tm 05/TM 5_ExistingSupplyEvaluation.docx (A) 4
85 For this evaluation it was assumed that the amount of available supply from TID during prolonged drought conditions (as is assumed for the third year of the drought conditions) will be 50 percent of the contractual entitlement. Curtailment of TID use during droughts is not included in the City s current curtailment program. However, for the purpose of this analysis, it was assumed that in years in which the TID supply is only 50 percent available that irrigation usage of the City s TID water would also be curtailed by 50 percent. 2.3 System Yield Each of the City s sources has a theoretical safe yield. The annual safe yield is the amount of water that can be reliably captured and distributed in one year during the most severe drought conditions. Yield estimates are based on a review of historical stream flow data and operational characteristics of the system (i.e., reservoir storage capability, seasonal use limitations prescribed by water rights, etc.). The actual yield estimate selected for planning purposes is based primarily on engineering judgment, and is often based on historical low flow because this condition provides a conservative basis for planning. The current estimate of the yield from Ashland Creek based on the stream flow the historical low flow period is more conservative than the estimates in some of the previous studies. However, using these data to compute the yield estimate is not overly conservative, since the historical record includes other similar low flow conditions in the creek, most recently in Likewise, our assumption that available supply from TID will be 50 percent of the contractual entitlement is conservative, however, it is reasonable to predict reduced availability of supply from TID during prolonged drought conditions. The total estimated yield including Ashland Creek flows and supply from TID are presented in Table 2. It is important to note that the full yield from Ashland Creek cannot usually be utilized. Due to the limited size of Reeder Reservoir, a portion of the Creek flows are spilled during the spring when available flows are in excess of demands and the reservoir is already full. In comparison, releases from the TID system are controlled and hence can be fully utilized. Table 2 Estimated Yield from Existing Sources City of Ashland WCRS & CWMP Source Yield, acre-feet Yield, MG Ashland Creek (1) 4,634 1,510 TID (2) Total 5,019 1,635 Notes: (1) Based on 1931 streamflows less downstream ditch rights and evaporation from Reeder Reservoir. (2) Assumes 50 percent TID available. FINAL October 14, 2010 pw://carollo/documents/client/or/ashland/8406a00/deliverables/wcrs/tm 05/TM 5_ExistingSupplyEvaluation.docx (A) 5
86 3.0 CLIMATE CHANGE IMPACTS An analysis of the climate change impacts on the City was completed by Dr. Alan Hamlet of the Climate Research Center at the University of Washington. The study used a Distributed Hydrologic Surface Vegetation Model (DHSVM) to project anticipated alterations to water resources in the City s watershed. A total of eight climate change scenarios for year 1920 through 2006 were investigated. TM 6 Effects of Climate Change in Ashland Creek, Oregon presents a detailed report of the models and analysis used for the climate change evaluation. For the evaluation of climate change impacts on Ashland Creek, the average of the eight climate change scenarios was used. Figure 2 presents the modeled combined stream flows (east and west fork) from the eight different scenarios, averaged over the evaluated 1920 to 2006 period. The average stream flows projected under the climate change scenarios is compared to the historical flow. As illustrated in Figure 2, all of the climate change scenarios indicate increased Ashland Creek flows in spring but decreased flows in summer and fall. However, the various climate change scenarios vary in the predicated severity of these changes. Though 1931 was the worst drought year on record, with the projected climate change impact, 1924 became the worst year on record (Figure 3). As shown in the figure, 1924 flows with climate change predict much greater spring flows with significantly lower flows available in June through September, consistent with the overall results. These results are consistent with the climate change impacts projected in the report Preparing for Climate Change in the Rogue River Basin of Southwest Oregon (December 8, 2008) which was developed in cooperation by the Climate Leadership Initiative, the National Center for Conservation Science and Policy, and the MAPSS Team at the U.S.D.A Forest Service Pacific Northwest Research Station. Projections were based on downscaling three climate models and incorporating a global vegetation change model used by the Intergovernmental Panel on Climate Change. The report included an assessment of potential impacts of climate change on natural systems, as well as economic, built and human systems within the Rogue Basin. Similar to the current effort, the 2008 report projected increased streamflows in winter and early spring, with decreased flows during the summer and fall. A section on water supply predicted that water scarcity will become more common, especially in summer and fall. FINAL October 14, 2010 pw://carollo/documents/client/or/ashland/8406a00/deliverables/wcrs/tm 05/TM 5_ExistingSupplyEvaluation.docx (A) 6
87 FINAL October 14, pw://carollo/documents/client/or/ashland/8406a00/deliverables/wcrs/tm 05/TM 5_ExistingSupplyEvaluation.docx (A) Figure 2 Estimated Streamflows Based on Climate Change Modeling

88 FINAL October 14, pw://carollo/documents/client/or/ashland/8406a00/deliverables/wcrs/tm 05/TM 5_ExistingSupplyEvaluation.docx (A) Figure 3 Worst Year on Record Based on Climate Change Analysis
89 4.0 PROJECTED DEMANDS The City s historic water system demands and projected future demands are presented in TM 2 Water Needs Analysis. The future demands are projected through 2060 using historic per capita usage and projected population. An evaluation of the impact that current and planned future water conservation will have on demands is presented in TM 3 Water Conservation. This section briefly presents a summary of the current and projected demands to aid in evaluating if the existing raw water supply and treatment systems have adequate capacity to meet projected demands during the planning period. There are two types of demands used in the analysis: Average monthly demands, which are used to evaluate the sufficiency of raw water supplies. Maximum day demands, which are used to evaluate the capacity of the water treatment plant. Other demands such as emergency needs during a supply outage, fire fighting demands, and peak hour supplies are assumed to be met through potable water storage tanks in the distribution system, as will be discussed in Chapter 5 Distribution System Analysis of the Comprehensive Water Master Plan. 4.1 Level of Service Goals The assumed demands for the existing supply analysis are based on the level of service goals established by the Ashland Water Advisory Council (AWAC). There are two key goals that impact the projected demands: Water System Capacity. The raw water supply system must be capable of meeting projected demands that have been reduced based on 5 percent conservation in addition to conservation already being achieved by the City. However, the City will have a goal of achieving 15 percent additional conservation. Water System Reliability. The raw water supply system must be capable of meeting projected demands assuming 45 percent mandatory curtailments during a severe (approximately 1 in 100 year) drought, in addition to planned conservation levels. Though it was originally intended that the level of service goals would be established prior to initiating the supply evaluation, additional information was needed to support the AWAC in selecting a level of service goal for raw water supply capacity. As such, this TM describes results of the existing supply analysis for three different potential conservation levels: 5, 10 and 15 percent conservation in addition to the conservation already achieved by the City. Information on the timing of additional raw water supply requirements is provided for the selected 5 percent conservation level only. FINAL October 14, 2010 pw://carollo/documents/client/or/ashland/8406a00/deliverables/wcrs/tm 05/TM 5_ExistingSupplyEvaluation.docx (A) 9
90 4.2 Average Monthly Demands Average monthly demands were projected to evaluate the sufficiency of existing raw water supplies. As presented in TM 2 Water Need Analysis, the average daily demands (ADD) were calculated based on the City s water production data. Table 3 presents the current and projected ADD for the City without taking into account the effects of additional water conservation beyond what the City is already achieving. The average monthly demands were then calculated by multiplying the ADD by the number of days in a month and the monthly peaking factor. The projected average monthly demands for 2060 with and without additional conservation are presented in Figure 4. All evaluated levels of 5, 10 and 15 percent additional conservation are shown in the figure. All conservation levels are in addition to the conservation currently achieved by the City. Water use patterns including conservation were projected assuming 75 percent of water savings would come from outdoor use and 25 percent from indoor, as discussed in TM 3 Water Conservation. Figure 5 presents the projected average monthly demands for 2060 after applying the 45 percent curtailment level of service goal developed by the AWAC for each of the evaluated additional conservation levels. Further information on curtailment assumptions is provided in TM 3 Water Conservation. Table 3 Year Average Day Demands City of Ashland WCRS & CWMP Average Day Demand (mgd) Maximum Day Demand (mgd) 2009 (Current) Maximum Day Demands Maximum day demands were used to evaluate the capacity of the water treatment plant. The fluctuations in daily water use in the City are primarily influenced by temperature and rainfall. The water consumption during hot summer days is considerably higher than during the winter. Maximum day demands were calculated by multiplying the projected average day demands for each year by the historical peaking factor, as described in TM 2 Water Needs Analysis. Seasonal variations in industrial/commercial and agricultural demands also cause fluctuations in daily water use. The projected maximum day demands are presented above in Table 3. FINAL October 14, 2010 pw://carollo/documents/client/or/ashland/8406a00/deliverables/wcrs/tm 05/TM 5_ExistingSupplyEvaluation.docx (A) 10
91 FINAL October 14, pw://carollo/documents/client/or/ashland/8406a00/deliverables/wcrs/tm 05/TM 5_ExistingSupplyEvaluation.docx (A) Figure 4 Year 2060 Monthly Demands with Different Conservation Levels
92 FINAL October 14, pw://carollo/documents/client/or/ashland/8406a00/deliverables/wcrs/tm 05/TM 5_ExistingSupplyEvaluation.docx (A) Figure 5 Year 2060 Monthly Demands with Conservation and Curtailment
93 5.0 WATER SUPPLY MODEL The objective of the water supply model is to compare the available supplies to the estimated demands and identify limitations of the existing supply system to meet future demands, especially under different drought conditions. Figure 6 presents a schematic of the existing supply model. As illustrated, both Ashland Creek (Reeder Reservoir levels) and TID supplies were considered to generate available water for the City s use. Three drought scenarios were considered in this analysis, and the supply results were compared to projected year 2060 demands: 1. Worst Drought ( ) without Climate Change. 2. Worst Drought (1924) with Climate Change in-10 year drought (1987) without Climate Change. This section presents the details of each analysis and overall estimated supply deficits. For each scenario, the reservoir water level was modeled over a three-year period, taking into account monthly inflows and demands. The model for each scenario included three water years (October through September). However, the model was extended by an additional three months in the final year, as the most severe shortages were found to occur at the end of the drought period Drought Scenario Under this scenario the stream flow conditions in Ashland Creek were assumed to be the same as occurred during the drought (worst drought on record). Although it is not known that the same (or similar) stream conditions will occur in the future, it is reasonable to use the actual historical record as the basis of the analysis. Due to its relatively small capacity, the reservoir was found to refill annually, even under the most severe drought conditions. Hence, though a three-year period was modeled, projected shortages in the final year were not affected by drought conditions in the previous years. The following assumptions were made for this scenario: Fifty percent of TID supply is available in the third drought year. Five percent conservation would be applied to the demands. Forty-five percent curtailment will be enforced during severe droughts. FINAL October 14, 2010 pw://carollo/documents/client/or/ashland/8406a00/deliverables/wcrs/tm 05/TM 5_ExistingSupplyEvaluation.docx (A) 13

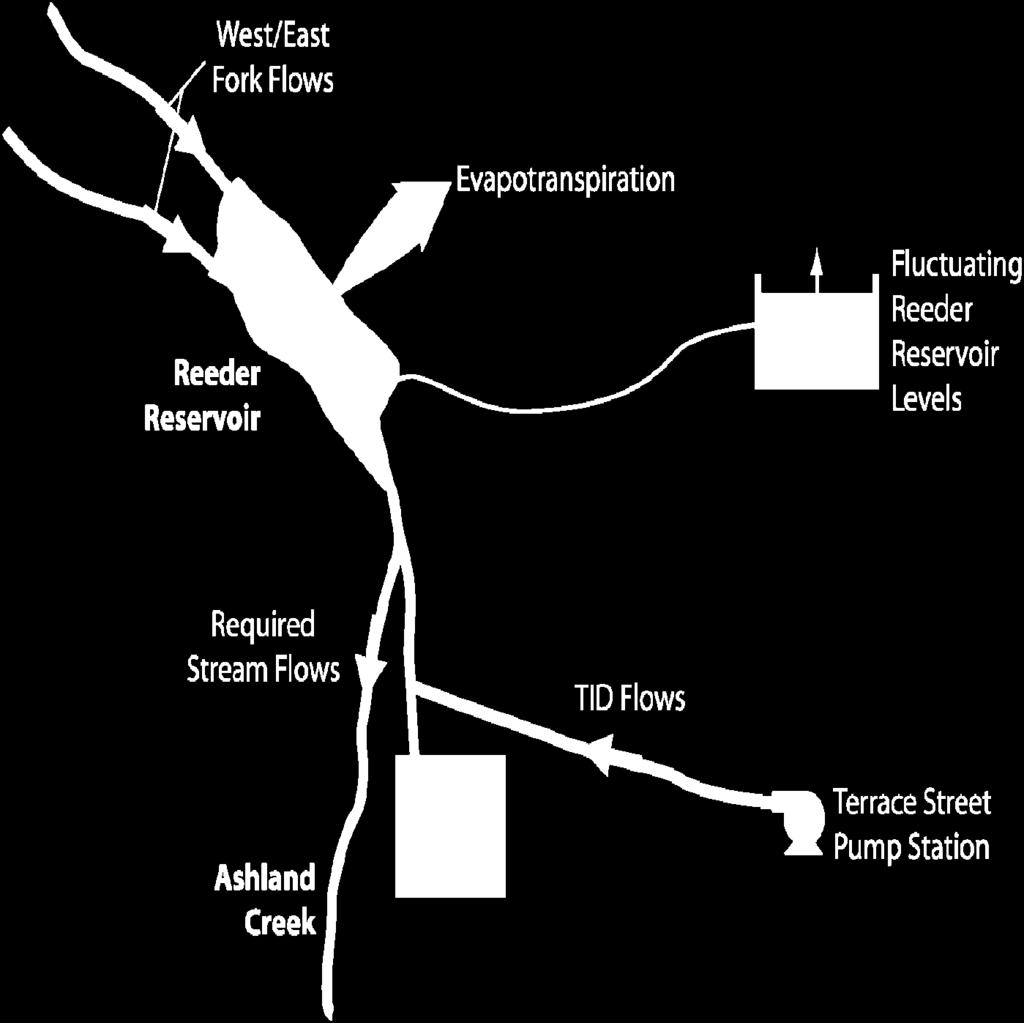
94 Figure 6 Schematic of Existing Supply Model FINAL October 14, 2010 pw://carollo/documents/client/or/ashland/8406a00/deliverables/wcrs/tm 05/TM 5_ExistingSupplyEvaluation.docx (A) 14
95 Figure 7 presents the total supplies to the City s water system taking into account stream flows, TID, losses through evapotranspiration, and required stream releases. As shown in the figure, projected streamflows were significantly greater during the summers of 1929 and 1930, than in The total supplies were compared to year 2060 projected demands to estimate the available supply and deficit conditions (Figure 8). There are three main lines on the figure: the red-dotted line shows the net supply available from Ashland Creek (inflow to Reeder Reservoir) and TID, which concurs with the black line shown in Figure 7. The purple line shows the projected monthly demands, including projected conservation and curtailments. The green line shows the projected reservoir level, with a maximum at 224 MG (the usable capacity of the reservoir). When supplies exceed demands (i.e., the red line is higher than the purple line) the reservoir fills (i.e., the green line trends upwards). Conversely, when demands exceed supplies (i.e., the purple line is higher than the red line) the reservoir empties (i.e., the green line trends downwards). Once the reservoir is empty, only streamflows are available to meet demands. As shown in the figure, the reservoir did not empty in the first two modeled years (as illustrated by the green line in Figure 8). However, in the third year, the reservoir emptied in October and did not begin to refill until December. During a portion of this period, streamflows were insufficient to meet projected demands (red dashed line is below the purple line), representing a water supply shortage. As illustrated in Figure 8, for the drought conditions and 5 percent additional conservation, the existing water supply system is not adequate in the final year. Table 4 presents the additional supply capacity needed under the different conservation scenarios, presented in both millions of gallons (MG) and acre-feet (AF). As shown in the table, existing supplies were insufficient for all except the 15 percent additional conservation scenario. Table Drought Scenario: Additional Supply Requirements City of Ashland WCRS & CWMP Additional Conservation Goal Additional Supply Capacity Needed MG 5 percent percent percent 0 0 AF FINAL October 14, 2010 pw://carollo/documents/client/or/ashland/8406a00/deliverables/wcrs/tm 05/TM 5_ExistingSupplyEvaluation.docx (A) 15
96 FINAL October 14, pw://carollo/documents/client/or/ashland/8406a00/deliverables/wcrs/tm 05/TM 5_ExistingSupplyEvaluation.docx (A) Figure Drought Scenario: Total Supplies
97 FINAL October 14, pw://carollo/documents/client/or/ashland/8406a00/deliverables/wcrs/tm 05/TM 5_ExistingSupplyEvaluation.docx (A) Figure Drought Scenario: Supply Analysis with 5 Percent Conservation
98 with Climate Change Under this scenario the historical streamflow conditions in Ashland Creek were simulated using the climate change model. With projected climate change impacts, the worst water supply year within the historical record became Similar to the previous scenario, the following assumptions were made: Fifty percent of TID supply is available in the third drought year. Five percent conservation would be applied to the demands. Forty-five percent curtailment will be enforced during severe droughts. Figure 9 presents the supply analysis with 5 percent conservation and 45 percent curtailment. Unlike the scenario, in this case, the flows for 1924 were modeled for three consecutive years. As shown in the figure, even under these severe drought conditions, the reservoir is projected to fill each year due to high projected streamflows in the spring. Hence, there is no carryover effect from previous years. The reservoir is projected to empty in September and not begin to refill until December, with supply shortages projected during this period. As shown in Figure 9, projected climate change impacts resulted in more severe shortages. Table 5 presents additional supply requirements; additional supply is projected to be required under all conservation scenarios. Table with Climate Change Scenario: Additional Supply Requirements City of Ashland WCRS & CWMP Additional Supply Capacity Needed Additional Conservation Goal MG AF 5 percent percent percent FINAL October 14, 2010 pw://carollo/documents/client/or/ashland/8406a00/deliverables/wcrs/tm 05/TM 5_ExistingSupplyEvaluation.docx (A) 18
99 FINAL October 14, pw://carollo/documents/client/or/ashland/8406a00/deliverables/wcrs/tm 05/TM 5_ExistingSupplyEvaluation.docx (A) Figure with Climate Change Scenario: Supply Analysis with 5% Conservation
100 5.3 1-in-10 Year Drought Based on the available data, an approximately 1-in-10 year drought for Ashland Creek occurred in These data were used in the supply model to calculate water requirements for year 2060 demands as shown in Figure 10. This scenario was evaluated to determine whether the aggressive curtailment goal selected by the AWAC under severe drought conditions would lead to frequent curtailments in more typical years. Under this scenario, the following assumptions were made: 100 percent of the TID supply will be available. 5 percent conservation goal will be applied. No curtailments will be enforced. As shown in Figure 10, a shortage was predicted for the 5 percent additional conservation level. Table 6 presents the results of this analysis for the different conservation goals; there is a shortage projected for all conservation levels. However, it is important to note that these shortages are based on an assumption of no curtailments of either potable water demands or TID irrigation demands. Table 6 1-in-10 Year Scenario: Additional Supply Requirements City of Ashland WCRS & CWMP Additional Conservation Goal Additional Supply Capacity Needed MG 5 percent percent percent AF FINAL October 14, 2010 pw://carollo/documents/client/or/ashland/8406a00/deliverables/wcrs/tm 05/TM 5_ExistingSupplyEvaluation.docx (A) 20
101 FINAL October 14, pw://carollo/documents/client/or/ashland/8406a00/deliverables/wcrs/tm 05/TM 5_ExistingSupplyEvaluation.docx (A) Figure 10 1-in-10 Year Scenario: Supply Analysis with 5% Conservation
102 5.4 Summary of Capacity Requirements Table 7 presents a summary of the supply model analysis for the three supply scenarios and three conservation level scenarios. As anticipated, the 1924 climate change conditions resulted in more severe shortages than the conditions without climate change. The results from the climate change scenario were selected as the basis for developing the water supply packages. Table 7 Additional Conservation Goal Summary of Supply Model Analysis City of Ashland WCRS & CWMP No Climate Change Additional Supply Capacity Needed, MG (AF) (1) 1924 With Climate Change 1987 No Climate Change MG AF MG AF MG AF 5 percent percent percent Notes: (1) MG millions of gallons; AF acre feet. The shortages projected under the 1-in-10 year drought scenario without curtailments exceeded those for the 1924 climate change scenario. Hence, if the selected water supply package only meets the projected 1924 climate change scenario shortage, curtailments would be anticipated to be required during a 1-in-10 year drought. However, curtailments would not be as severe as the 45 percent curtailments assumed for the 1924 climate change scenario. Some water supply packages may exceed the minimum supply requirements and result in the lack of a need for curtailments under the 1-in-10-year drought scenario. 5.5 Timing of Additional Supply Requirements To further evaluate the timing of required additional capacity, model scenarios for additional years were developed for the 5 percent conservation level for the years 2010, 2030, 2050, and Ashland Creek flows for years 2010 and 2030 were assumed to be per the drought conditions without climate change. Ashland Creek flows for years 2050 and 2060 were assumed to be per the 1924 conditions with projected climate change impacts. The results of these scenarios are shown in Figures 11, 12, 13 and Table 8. Figure 14 shows that the demands are projected to exceed supplies in approximately It was assumed that additional supplies would need to be in place approximately two years prior, in 2036, to meet capacity requirements. FINAL October 14, 2010 pw://carollo/documents/client/or/ashland/8406a00/deliverables/wcrs/tm 05/TM 5_ExistingSupplyEvaluation.docx (A) 22
103 FINAL October 14, pw://carollo/documents/client/or/ashland/8406a00/deliverables/wcrs/tm 05/TM 5_ExistingSupplyEvaluation.docx (A) Figure 11 Year 2010 Supply Analysis without Climate Change and 5% Conservation
104 DRAFT August 4, pw://carollo/documents/client/or/ashland/8406a00/deliverables/wcrs/tm 05/TM 5_ExistingSupplyEvaluation.docx (A) Figure 12 Year 2030 Supply Analysis without Climate Change and 5% Conservation
105 DRAFT August 4, pw://carollo/documents/client/or/ashland/8406a00/deliverables/wcrs/tm 05/TM 5_ExistingSupplyEvaluation.docx (A) Figure 13 Year 2050 Supply Analysis with Climate Change and 5% Conservation
106 DRAFT August 4, pw://carollo/documents/client/or/ashland/8406a00/deliverables/wcrs/tm 05/TM 5_ExistingSupplyEvaluation.docx (A) Figure 14 Supply Requirements Projected with 5 Percent Conservation
107 Table 8 Timing of Additional Supply Requirements City of Ashland WCRS & CWMP Additional Conservation Goal Additional Supply Capacity Needed 2 MG Notes: (1) Surplus demand was calculated based on June through October demands when deficits were observed in the model. (2) 2010 and 2030 scenarios based on Ashland Creek flows available under the drought without climate change impacts and 2060 scenarios based on Ashland Creek flows available under the 1924 drought with projected climate change impacts. All scenarios assume 50 percent of TID flows are available. AF As discussed above, shortages are also projected for the 1-in-10 year drought condition without curtailments. Though these shortages are not being used to size the water supply projects, they may provide a reason to implement those packages sooner than Table 9 shows the projected shortages for the 1-in-10-year drought for 2010 and As shown in the table, shortages are already projected for 2010; curtailments of approximately 21 percent would be required to eliminate the shortage. It is assumed that by 2060 a water supply package will be implemented that would at least meet the projected 619 AF shortage. Under this assumption, approximately 21 percent curtailments would also be projected to be required in If the selected water supply package exceeded the 619 AF requirements, the projected curtailments would be reduced. Table 9 Projected Shortages for the 1-in-10 Year Drought City of Ashland WCRS & CWMP Additional Conservation Goal Additional Supply Capacity Needed 2 MG Notes: (1) Based on projected Ashland Creek flows during an approximately 1-in-10 year drought, as represented by historical 1987 flows. Additional capacity needed based on no conservation and curtailments on either the potable water or TID systems. (2) Additional capacity needed in 2060 based on 5 percent conservation level and no curtailments. AF FINAL October 14, 2010 pw://carollo/documents/client/or/ashland/8406a00/deliverables/wcrs/tm 05/TM 5_ExistingSupplyEvaluation.docx (A) 27
108 6.0 WATER TREATMENT CAPACITY The capacity of the Ashland Water Treatment Plant was evaluated for its ability to meet projected maximum day demands. The current capacity of the water treatment plant was assumed to be 7.5 million gallons per day (mgd). The theoretical capacity may be somewhat higher, however, the 7.5 mgd capacity reflects the experience of City staff and historical plant performance. Figure 15 shows the projected maximum day demands for the three different conservation scenarios (5, 10 and 15 percent additional conservation), as well as the current water treatment plant capacity. These demands do not assume curtailments, as the City must be able to provide sufficient supply in non-drought years without curtailments. As shown in the figure, the demands are projected to exceed the capacity for all conservation levels. However, the higher conservation levels both reduce the magnitude of and delay the need for the required capacity expansions. The additional projected capacities required for the conservation level scenarios are summarized in Table 9 and vary from 0.5 mgd for the 15 percent conservation level to 1.9 mgd for the selected 5 percent conservation level. This additional capacity could theoretically be achieved by increasing treatment capacity, adding a new potable water source, or transferring existing irrigation to non-potable supplies. Total capacity needs are addressed through the water supply packages, as described in TM 14 Water Supply Packages. Table 9 Additional Conservation Goal Water Treatment Plant Capacity Evaluation City of Ashland WCRS & CWMP Additional Capacity Required in 2060 Year in Which Additional Capacity is Needed 5 percent 1.9 mgd percent 1.2 mgd percent 0.5 mgd 2048 Notes: (1) MGD millions of gallons per day. FINAL October 14, 2010 pw://carollo/documents/client/or/ashland/8406a00/deliverables/wcrs/tm 05/TM 5_ExistingSupplyEvaluation.docx (A) 28
109 FINAL October 14, pw://carollo/documents/client/or/ashland/8406a00/deliverables/wcrs/tm 05/TM 5_ExistingSupplyEvaluation.docx (A) Figure 15 Project Water Treatment Plant Capacity Requirements
110 7.0 SUMMARY Based on the analyses contained in this TM and the level of service goals established by the AWAC, the following conclusions can be made: Additional raw water supply will be needed in approximately 2037; a total 202 MG (619 AF) of additional supply will be needed by These estimates are based on planning for 5 percent conservation in addition to what the City is already achieving and 45 percent curtailments in addition to conservation during severe drought years. Additional maximum day supply will be needed by approximately 2018; an additional 1.9 mgd of capacity will be needed by This additional capacity could be achieved by increasing treatment capacity, adding a new potable water source, or transferring existing irrigation to non-potable supplies. These estimates are based on planning for 5 percent conservation in addition to what the City is already achieving and no curtailments during typical years. FINAL October 14, 2010 pw://carollo/documents/client/or/ashland/8406a00/deliverables/wcrs/tm 05/TM 5_ExistingSupplyEvaluation.docx (A) 30
111 TECHNICAL MEMORANDUM NO. 6 EFFECTS OF CLIMATE CHANGE ON ASHLAND CREEK, OREGON City of Ashland Water Conservation and Reuse Study and Comprehensive Water Master Plan Alan F. Hamlet Pablo Carrasco Dept. of Civil and Environmental Engineering University of Washington Final Report 8/9/2010 1
112 EXECUTIVE SUMMARY Ashland s water supply is provided primarily by surface water inflows to Reeder Reservoir from the east and west forks of Ashland Creek. The Ashland Creek watershed accumulates significant snowpack in winter, and historical streamflows typically peak in May/June for the East fork and April/May for the West fork in response to melting snow. Global climate model simulations from the Intergovernmental Panel on Climate Change Fourth Assessment Report (IPCC AR4) project warmer temperatures and changes in the seasonality of precipitation for the Pacific Northwest region of North America. Because snowpack is sensitive to these kinds of changes, losses of snowpack and resultant streamflow timing shifts (more flow in winter, less in summer) are common impacts to water supply that have been shown in many previous studies throughout the region. In this study we apply a fine scale hydrologic model implemented over Ashland Creek to simulate the effects of projected changes in temperature and precipitation from the IPCC AR4 on snowpack and streamflow. Ten realizations of 2040s climate (each associated with a Global Climate Model) for the A1b emissions scenario are used as input to the hydrologic model and are compared to a historical baseline simulation from Summary of Results Figure ES.1 shows projected annual average temperature and precipitation for the ten climate change scenarios used in the study and historical conditions. Temperatures are about 2 C +/ 0.5 C (3.6 F +/ 0.9 F) warmer than historical conditions on average. Annual precipitation shows a small systematic change of a few percent with a range from about 650mm (90% of historical) to 880mm (122% of historical). Scenarios are generally wetter in winter and drier in summer, however. 2
113 900 Precipitation in mm Temperature in Centigrade Degrees Historic ccsm3_a1b_ echam5_a1b_ hadgem1_a1b_ pcm1_a1b_ cgcm3.1_t47_a1b_ echo_g_a1b_ ipsl_cm4_a1b_ cnrm_cm3_a1b_ hadcm_a1b_ miroc_3.2_a1b_ Climate Change Average Figure ES.1 Downscaled Annual Precipitation and Temperature Projections for Ten Different Climate Change Scenarios for the 2040s Compared to Historical Data These changes in temperature and precipitation result in substantial changes in snowpack and streamflow in the East Fork hydrologic simulations (Figures ES.2 and ES.3), including earlier and reduced peak snow water equivalent, increases in Oct March streamflow and decreases in April September streamflow. Extreme low flows also become markedly more severe due to lower soil moisture in late summer and corresponding reductions in base flow in the simulations (Figure ES.4). Changes in the West Fork (not shown) are similar. 3
114 Climate Change Range Historic Climate Change Average mm Figure ES.2 East Fork mean Snow Water Equivalent for the historical period (1920 to 2000) and A1b climate change scenarios for the 2040s Climate Change Range Historic Climate Change Average CFS Figure ES.3 East Fork Average Monthly Streamflow for the historical period (1920 to 2000) and A1b climate change scenarios for the 2040s. 4
115 6 5 4 CFS 3 2 Climate Change Range Historic Climate Change Average Figure ES.4 Quantiles for extreme low streamflow for the historical period (1920 to 2000) and A1b climate change scenarios for the 2040s Changes in streamflow for the combined east and west forks for historical and 2040s climate change conditions are shown in Figure ES.5. Average annual changes in streamflow are negligible in the simulations (less than 1 percent), but cool season flows are increased and warm season flows reduced. On average April September flow is reduced by about 13 percent for the projected 2040s conditions in comparison with historical conditions. May September flow is reduced by about 26 percent in comparison with historical conditions. 5
116 CFS Climate Change Range Historic Climate Change Average 0 Figure ES.5 Combined Monthly Streamflow of the West and East Forks for the historical period (1920 to 2000) and A1b climate change scenarios for the 2040s Conclusions The hydrologic simulations show that projected temperature and precipitation changes in the Pacific Northwest for the 2040s associated with the A1b scenario will result in substantial reductions in spring snowpack, May September streamflow, and extreme low flows in Ashland Creek. Although there is considerable uncertainty in these projections because of differences in the global climate model simulations, all scenarios show reductions in average April 1 snow water equivalent in both east and west forks, and nine out of ten scenarios of combined flow show reductions in May through September streamflow. Likewise, extreme low flows in every future simulation year are lower than their historical counterparts. Thus there is little question of the general nature of these fundamental changes in watershed processes, uncertainty in the absolute value of the changes notwithstanding. It is important to note that changes in the future will also vary from decade to decade due to natural variability of precipitation and temperature. In relatively cool and wet decades water supply impacts may be reduced from the averages shown above, whereas in relatively warm and dry decades water supply impacts may be larger than shown. 6

117 TECHNICAL REPORT INTRODUCTION Ashland Creek is located in Jackson County, Oregon, United States, near Interstate 5 and the California border, and located in the south end of the Rogue Valley. The West Fork basin has an area of 10.5 mi 2 and the East Fork has an area of 8.14 mi 2. Both branches of the Ashland creek drain to the Reeder Reservoir. In this study we implemented the Distributed Hydrological Vegetation Model over the East and West branches of the river with the objective of simulating the effects of climate change on streamflow in these basins. Figure 1 East and West Fork of Ashland Creek, near Ashland, OR. Flow is to the North (top of Map) into Reeder Reservoir. Hydrologic Model The Distributed Hydrologic Surface Vegetation Model (DHSVM) (Wigmosta et al. 1994) which explicitly represents the effects of topography and vegetation on water fluxes through the landscape has been implemented over the Ashland Creek watershed near Ashland, Oregon (Figure 1). DHSVM is typically applied at high spatial resolutions on the order of 50 meters for watersheds up to 100,000 km 2 and at sub daily timescales for multi year simulations. This 7
118 distributed hydrologic model has been applied predominantly to mountainous watersheds in the Pacific Northwest in the United States. DHSVM, as with any distributed hydrologic model, requires extensive information about the simulated basin. The first type of information is static data and can be divided in three main categories: elevation, vegetation cover and soils. The second type is dynamic, or time series, information which includes meteorological data that can be obtained from weather stations or derived from others models. In the basins modeled, observing stations do not have sufficiently long records or do not exist in a spatially relevant location. Therefore, gridded products provide the spatial coverage that observing stations may lack DHSVM consists of computational grid cells centered on Digital Elevation Model (DEM) elevation nodes, which explicitly represent the effects of topography in the basin. DEM data are used to define absorbed shortwave radiation, precipitation, air temperature, and down slope water movement. In DHSVM each cell may exchange surface and subsurface water with its neighbors resulting in a three dimensional redistribution across the basin. This water is routed across the basin using the defined stream channel network. In this study, we implemented DHSVM v2.4. Some modifications to the code in comparison with previous versions include the addition of a deep groundwater layer, expansion of surface and subsurface flow paths from 4 to 8 directions, allowance of the re infiltration of water from the stream channel network back into the soil layer, the division of surface flows resulting from runoff from impervious surfaces by the fraction of impervious area, and the calculation of water temperature within the channel network. 8
 Figure 3 Digitized stream networks used in the hydrological model")
.")
119 Figure 2 Schematic diagram of the Distributed Hydrology Vegetation Model (DHSVM) Figure 3 Digitized stream networks used in the hydrological model implementation. Flow is roughly from South to North (top to bottom in the figure). (Note Reeder Reservoir in the lower center portion of the figure.) 9

120 Figure 4 Digital elevation model used in the hydrologic model implementation Figure 5 Soil depth model used in the hydrologic model implementation 10

121 Figure 6 Land cover classes used in the hydrologic model implementation. 11
122 Climate Change Scenarios The climate change scenarios evaluated using DHSVM were downscaled from Global Climate Models (GCM) models to 1/16 degree resolution following methods described by Hamlet et al. (2010). The downscaled data were monthly averages for maximum temperature, minimum temperature and total monthly precipitation. The GCM data is bias corrected using the historical gridded meteorological data series using quantile mapping techniques described by Wood et al. (2002). In this process the historical dataset is aggregated to monthly time step and the coarser GCM spatial resolution and the GCM data is bias corrected to produce a new dataset that closely matches the statistics of observations. These data are then spatially downscaled and temporally disaggregated using the Hybrid Delta downscaling method described by Hamlet et al. (2010) (Figure 7). The end product combines the realistic time series and spatial variability of storms from the historical dataset with the bias adjusted future climate change signals for temperature and precipitation from the GCM scenarios. The resulting daily downscaled temperature and precipitation scenarios were downloaded from the Columbia Basin Climate Change Scenarios Project website [ for the ten GCMs included in the study for the A1b emissions scenario (Table 1) (see also Mote and Salathé 2010), and were post processed to produce 3 hourly forcings for DHSVM using methods described by Carrasco and Hamlet (2010). Table 1 List of Global Climate Models (GCMs) used in the study Global Climate Models** Period Of Analysis UKMO HadCM CNRM CM ECHAM5/MPI OM ECHO G PCM CGCM3.1(T47) CCSM IPSL CM MIROC3.2(medres) UKMO HadGEM **Global Climate Model scenarios are described by Mote and Salathé (2010) 12
123 Figure 7 Overview of the downscaling process Table 1 Average Monthly Temperature in Celsius Degrees for Historic data and GCM simulations Historic ccsm3 GCM cgcm3 GCM Cnrm GCM echo 5 GCM echo g GCM Hadcm GCM Hadgm GCM ipsl cm4 GCM miroc 3.2 GCM October November December January February March April May June July August September pcm 1 GCM 13
124 Table 2 Monthly precipitation in mm for historical data and ten 2040 GCM scenarios Historic ccsm3 GCM cgcm3 GCM Cnrm GCM echo 5 GCM echo g GCM Hadcm GCM Hadgm GCM ipsl cm4 GCM miroc 3.2 GCM October November December January February March April May June July August September pcm 1 GCM 25 Temperature C Historic ccsm3_a1b_ echam5_a1b_ hadgem1_a1b_ pcm1_a1b_ cgcm3.1_t47_a1b_ echo_g_a1b_ ipsl_cm4_a1b_ cnrm_cm3_a1b_ hadcm_a1b_ miroc_3.2_a1b_ Figure 8 Average monthly temperature for historical data and ten 2040 GCM scenarios 14
125 200 Precipitation mm Historic ccsm3_a1b_ echam5_a1b_ hadgem1_a1b_ pcm1_a1b_ cgcm3.1_t47_a1b_ echo_g_a1b_ ipsl_cm4_a1b_ cnrm_cm3_a1b_ hadcm_a1b_ miroc_3.2_a1b_ Figure 9 Average precipitation for historical data and ten 2040 GCM scenarios Precipitation mm Temperature C Figure 10 Average monthly meteorological data from 1916 to
126 Precipitation mm Temperature C Figure 11 Average Meteorological data from 2030 to 2059 for GCM ccsm3_a1b Precipitation mm Temperature C Figure 12 Average Meteorological data from 2030 to 2059 for GCM echam5_a1b 16
127 Precipitation mm Temperature C Figure 13 Average Meteorological data from 2030 to 2059 for GCM hadgem1_a1b Precipitation mm Temperature C Figure 14 Average Meteorological data from 2030 to 2059 for GCM pcm1_a1b 17
128 Precipitation mm Temperature C Figure 15 Average Meteorological data from 2030 to 2059 for GCM cgcm3.1_t47_a1b Precipitation mm Temperature C Figure 16 Average Meteorological data from 2030 to 2059 for GCM echo_g_a1b 18
129 Precipitation mm Temperature C Figure 17 Average Meteorological data from 2030 to 2059 for GCM ipsl_cm4_a1b Precipitation mm Temperature C Figure 18 Average Meteorological data from 2030 to 2059 for GCM cnrm_cm3 19
130 Precipitation mm Temperature C Figure 19 Average Meteorological data from 2030 to 2059 for GCM hadcm_a1b Precipitation mm Temperature C Figure 20 Average Meteorological data from 2030 to 2059 for GCM miroc_3.2_a1b 20
131 900 Precipitation in mm Temperature in Centigrade Degrees Historic ccsm3_a1b_ echam5_a1b_ hadgem1_a1b_ pcm1_a1b_ cgcm3.1_t47_a1b_ echo_g_a1b_ ipsl_cm4_a1b_ cnrm_cm3_a1b_ hadcm_a1b_ miroc_3.2_a1b_ Climate Change Average Figure 21 Downscaled annual precipitation and temperature projections for ten different climate change scenarios for the 2040s compared to historical data. USGS STREAMFLOW DATA STATIONS West Fork Ashland Creek near Ashland, OR Location. Lat 42 08'55", long '55" near line between NW 1/4 SW 1/4 sec.28, T.39 S., R.1 E., Jackson County, Hydrologic Unit , in Rogue River National Forest, on left bank 0.3 mi upstream from city diversion, 2.5 mi south of Ashland, and at mile 0.4. Drainage Area mi 2, at diversion dam 0.3 mi downstream. Period of Record. September 1924 to January 1933, water years , 1963, annual maximum; December 1974 to September 1982, Oct to current year. Monthly discharge only for some periods published in WSP Gage. Water stage recorder and crest stage gage. Datum of gage is 2, ft above NGVD of Sept. 10, 1924, to Jan. 31, 1933, water stage recorder at site about 0.2 mi upstream at different datum. Oct. 14, 1953 to Sept. 30, 1963, crest stage gage at diversion dam 0.3 mi 21
132 downstream at different datum. Oct. 1, 2002 to Aug. 29, 2005, water stage recorder at same site at datum 1.00 ft higher. Remarks. No regulation or diversion above station. Extremes for Period of Record. Maximum discharge, 330 ft 3 /s Dec. 2, 1962, gage height,15.51 ft, site and datum then in use, from rating curve defined by computation of peak flow over dam; minimum, 0.8 ft 3 /s Sept. 7, 2005 Calculated stats for period: 1975, 1 to 1978,12 Obs Sim Sim/Obs Avg Flow Std Dev Correlation Coefficient =0.831 RMSE = RMSE/Obs Mean = MSE/Obs Var = Nash Sutcliff Eff. = Monthly Stats: Mon ObsAvg SimAvg Bias RMSE ObsStDev SimStDev
133 Figure 22 Hydrograph for the Calibration Period January 1974 to December 1978, Validation Period January 1979 to December 1982 Calculated statistic for validation period for period: 1979, 1 to 1980, 12 Obs Sim Sim/Obs Avg Flow Std Dev Correlation Coefficient = RMSE = RMSE/Obs Mean = MSE/Obs Var = Nash Sutcliff Eff. =
134 Monthly Stats: Mon ObsAvg SimAvg Bias RMSE ObsStDev SimStDev East Fork Ashland Creek Near Ashland, OR Location. Lat 42 09'10", long '30", in NW 1/4, NW 1/4 sec.28, T.39 S., R.1 E., Jackson County, Hydrologic Unit , in Rogue River National Forest, on left bank 0.1 mi upstream from city diversion dam, 2.5 mi south of Ashland, and at mile 0.2. Drainage Area mi 2, at diversion dam 0.1 mi downstream. Period Of Record. September 1924 to January 1933, water years , 1963, annual maximum; December 1974 to September 1982, Oct to current year. Gage. Water stage recorder and crest stage gage. Datum of gage is 2, ft above NGVD of Sept. 10, 1924 to Jan. 31, 1933, water stage recorder at site about 200 ft downstream at different datum. Oct. 19, 1953 to Sept. 30, 1963, crest stage gage at diversion dam 0.1 mi downstream at different datum. Extremes For Period Of Record. Maximum discharge, 335 ft 3 /s Dec. 2, 1962, gage height, 5.42 ft, site and datum then in use, from rating curve defined by computation of peak flow over dam; minimum discharge, 0.47 ft 3/ s Mar. 14, 1977, result of freeze up. Extremes Outside Period Of Record. Flood of Jan. 15, 1974, is the highest since at least Discharge, 5,630 ft 3 /s by slope area measurement of peak flow, gage height, 10.2 ft from flood marks. Peak believed to be affected by release from debris dams breaking upstream. 24
135 Figure 23 Hydrograph for the Calibration Period January 1974 to December 1978, Validation Period January 1979 to December 1982 Calculated stats for period: 1975, 1 to 1978,12 Obs Sim Sim/Obs Avg Flow Std Dev Correlation Coefficient = RMSE = RMSE/Obs Mean = MSE/Obs Var = Nash Sutcliff Eff. =
136 Monthly Stats: Mon ObsAvg SimAvg Bias RMSE ObsStDev SimStDev Calculated statistic for validation period for period: 1979, 1 to 1980, 12 Obs Sim Sim/Obs Avg Flow Std Dev Correlation Coefficient = RMSE = RMSE/Obs Mean = MSE/Obs Var = Nash Sutcliff Eff. = Monthly Stats: Mon ObsAvg SimAvg Bias RMSE ObsStDev SimStDev
137 RESULTS East Fork Snow Water Equivalent East Fork Climate Change Range Historic Climate Change Average mm Figure 24 East Fork Mean Snow Water Equivalent for the historical period 1920 to 2000 and climate change scenarios for the 2040s 450 mm Historic ccsm3 cgcm3 cnrm echo 5 echo g hadcm hadgm ipsl cm4 miroc 3.2 pcm 1 Figure 25 East Fork mean Snow Water Equivalent for the historical period 1920 to 2000 and climate change scenarios for the 2040s 27
138 Table 3 Mean Monthly Snow Water Equivalent for the period historic period 1920 to 2000 and climate change scenarios from 2030 to 2059 Historic ccsm3 GCM cgcm3 GCM Cnrm GCM echo 5 GCM echo g GCM Hadcm GCM Hadgm GCM ipsl cm4 GCM miroc 3.2 GCM October November December January February March April May June July August September pcm 1 GCM Table 4 Snow Statistics for the period historic period 1920 to 2000 and climate change scenarios from 2030 to 2059, Julian Day of 10% accumulation (JD 10% SWE), Julian Day of maximum accumulation (JD MAX SWE), Julian Day of 90% melting of the accumulated snow (JD 90% MELT SWE), Maximum Snow Water Equivalent (MAX SWE), Days Between 10% of accumulation to 90 % of melting (DAYS 10% - 90%) Historic ccsm3 GCM cgcm3 GCM Cnrm GCM echo 5 GCM echo g GCM Hadcm GCM Hadgm GCM ipsl cm4 GCM miroc 3.2 GCM JD 10% SWE JD MAX SWE JD 90% MELT SWE MAX SWE DAYS 10% 90% pcm 1 GCM 28
139 Evapotranspiration East Fork mm Climate Change Range Historic Climate Change Average Figure 26 East Fork monthly evapotranspiration for the historical period 1920 to 2000 and climate change scenarios for the 2040s 120 mm Historic ccsm3 cgcm3 cnrm echo 5 echo g hadcm hadgm ipsl cm4 miroc 3.2 pcm 1 Figure 27 East Fork monthly evapotranspiration for the historical period 1920 to 2000 and climate change scenarios for the 2040s 29
140 Table 5 Accumulated Monthly Evapotranspiration for the period historic period 1920 to 2000 and climate change scenarios from 2030 to 2059 Historic ccsm3 GCM cgcm3 GCM Cnrm GCM echo 5 GCM echo g GCM Hadcm GCM Hadgm GCM ipsl cm4 GCM miroc 3.2 GCM October November December January February March April May June July August September pcm 1 GCM Streamflow East Fork Climate Change Range Historic Climate Change Average CFS Figure 28 East Fork average monthly streamflow for the historical period 1920 to 2000 and climate change scenarios for the 2040s 30
141 45 CFS Historic ccsm3 cgcm3 cnrm echo 5 echo g hadcm hadgm ipsl cm4 miroc 3.2 pcm 1 Figure 29 East Fork average monthly streamflow for the historical period 1920 to 2000 and climate change scenarios for the 2040s Table 6 Average monthly streamflow (units cfs) for the historical period 1920 to 2000 and climate change scenarios for the 2040s October November December January February March April May June July August September Historic ccsm3 GCM cgcm3 GCM Cnrm GCM echo 5 GCM echo g GCM Hadcm GCM Hadgm GCM ipsl cm4 GCM miroc 3.2 GCM pcm 1 GCM
142 Extreme Values East Fork CFS 250 Climate Change Range 200 Historic 150 Climate Change Average Probability of Exceedence Figure 30 East Fork quantiles for extreme flood for the historical period 1920 to 2000 and climate change scenarios for the 2040s 500 CFS Probability of Exceedence Historic ccsm3 cgcm3 cnrm echo 5 echo g hadcm hadgm ipsl cm4 miroc 3.2 pcm 1 Figure 31 East Fork quantiles for extreme flood for the historical period 1920 to 2000 and climate change scenarios for the 2040s 32
143 6 5 4 CFS 3 2 Climate Change Range Historic Climate Change Average Probability of Exceedence Figure 32 East Fork quantiles for extreme 7 day low streamflow for the historical period 1920 to 2000 and climate change scenarios for the 2040s 6 CFS Probability of Exceedence Historic ccsm3 cgcm3 cnrm echo 5 echo g hadcm hadgm ipsl cm4 miroc 3.2 pcm 1 Figure 33 East Fork quantiles for extreme 7 day low streamflow for the historical period 1920 to 2000 and climate change scenarios for the 2040s 33
. (Black line represents observed values). 34")
144 Figure 34 East Fork simulated monthly average streamflow (units cfs). (Black line represents observed values). 34
145 WEST FORK Snow Water Equivalent West Fork Climate Change Range Historic Climate Change Average mm Figure 35 West Fork mean Snow Water Equivalent for the historical period 1920 to 2000 and climate change scenarios for the 2040s 350 mm Historic ccsm3 cgcm3 cnrm echo 5 echo g hadcm hadgm ipsl cm4 miroc 3.2 pcm 1 Figure 36 West Fork mean Snow Water Equivalent for the historical period 1920 to 2000 and climate change scenarios for the 2040s 35
146 Table 7 West Fork mean Monthly Snow Water Equivalent for the historical period 1920 to 2000 and climate change scenarios for the 2040s Historic ccsm3 GCM cgcm3 GCM Cnrm GCM echo 5 GCM echo g GCM Hadcm GCM Hadgm GCM ipsl cm4 GCM miroc 3.2 GCM October November December January February March April May June July August September pcm 1 GCM Table 8 West Fork Snow Statistics for the historical period 1920 to 2000 and climate change scenarios for the 2040s, Julian Day of 10% accumulation (JD 10% SWE), Julian Day of maximum accumulation (JD MAX SWE), Julian Day of 90% melting of the accumulated snow (JD 90% MELT SWE), Maximum Snow Water Equivalent (MAX SWE), Days Between 10% of accumulation and 90% of melting (DAYS 10% - 90%). Historic ccsm3 GCM cgcm3 GCM Cnrm GCM echo 5 GCM echo g GCM Hadcm GCM Hadgm GCM ipsl cm4 GCM miroc 3.2 GCM JD 10% SWE JD MAX SWE JD 90% MELT SWE MAX SWE DAYS 10% 90% pcm 1 GCM 36
147 Evapotranspiration West Fork CFS Climate Change Range Historic Climate Change Average Figure 37 West Fork Monthly Evapotranspiration for the historical period 1920 to 2000 and climate change scenarios for the 2040s 100 CFS Historic ccsm3 cgcm3 cnrm echo 5 echo g hadcm hadgm ipsl cm4 miroc 3.2 pcm 1 Figure 38 West Fork Monthly Evapotranspiration for the historical period 1920 to 2000 and climate change scenarios for the 2040s 37
148 Table 9 West Fork Accumulated Monthly Evapotranspiration for the historical period 1920 to 2000 and climate change scenarios for the 2040s Historic ccsm3 GCM cgcm3 GCM Cnrm GCM echo 5 GCM echo g GCM Hadcm GCM Hadgm GCM ipsl cm4 GCM miroc 3.2 GCM October November December January February March April May June July August September pcm 1 GCM Stream Flow Climate Change Range Historic Climate Change Average 25 CFS Figure 39 West Fork Average Monthly Streamflow for the historical period 1920 to 2000 and climate change scenarios for the 2040s 38
149 40 CFS Historic ccsm3 cgcm3 cnrm echo 5 echo g hadcm hadgm ipsl cm4 miroc 3.2 pcm 1 Figure 40 West Fork Average Monthly for the historical period 1920 to 2000 and climate change scenarios for the 2040s Table 10 West Fork Average Monthly Streamflow for the historical period 1920 to 2000 and climate change scenarios for the 2040s Historic ccsm3 GCM cgcm3 GCM Cnrm GCM echo 5 GCM echo g GCM Hadcm GCM Hadgm GCM ipsl cm4 GCM miroc 3.2 GCM October November December January February March April May June July August September pcm 1 GCM 39
150 Extreme Values West Fork CFS 250 Climate Change Range 200 Historic 150 Climate Change Average Probability of Exceedence Figure 41 West Fork quantiles for extreme daily flood for the historical period 1920 to 2000 and climate change scenarios for the 2040s 500 CFS Probability of Exceedence Historic ccsm3 cgcm3 cnrm echo 5 echo g hadcm hadgm ipsl cm4 miroc 3.2 pcm 1 Figure 42 West Fork quantiles for extreme daily flood for the historical period 1920 to 2000 and climate change scenarios for the 2040s 40
151 CFS Climate Change Range Historic Climate Change Average Probability of Exceedence Figure 43 West Fork quantiles for extreme 7 day low streamflow for the historical period 1920 to 2000 and climate change scenarios for the 2040s 500 CFS Probability of Exceedence Historic ccsm3 cgcm3 cnrm echo 5 echo g hadcm hadgm ipsl cm4 miroc 3.2 pcm 1 Figure 44 West Fork quantiles for extreme 7 day low streamflow for the historical period 1920 to 2000 and climate change scenarios for the 2040s 41
. (Black line represents observed values.) 42")
152 Figure 45 West Fork simulated monthly average streamflow (units cfs). (Black line represents observed values.) 42