Buffer Zone = Area of Undisturbed Vegetation
|
|
|
- Edgar Norton
- 5 years ago
- Views:
Transcription
1 Scientific overview: Water quality functions of coastal buffers Caitlin Chaffee, Coastal Policy Analyst RI Coastal Resources Management Council November 29, 2012
2 Buffer Zone Setback = Minimum i Distance Buffer Zone = Area of Undisturbed Vegetation
3 Buffers have many functions one of which is water quality improvement 1. Protection of Water Quality 2. Protection of Coastal Habitat 3. Provide Scenic and Aesthetic Qualities 4. Provide Erosion Control 5. Flood Control 6. Historic and Archaeological Resource Protection o
4 Vegetation is Key! Stabilizes soils Slows water flow Increases infiltration rates Filters sediment Removes pollutants Maintains groundwater flow paths Performs additional functions


, bacteria, etc.")
5 Pollutant Removal Mechanisms Physical trapping Plant and microbial uptake Microbial degradation and conversion Chemical adsorption Removal of variety of pollutants: sediment, heavy metals, excess nutrients (N and P), bacteria, etc. Photo: Dr. Mark Stolt, URI NRS Dept.
6 Nitrogen is limiting nutrient in coastal systems Excess nutrients can lead to eutrophication, algal / phytoplankton blooms, fish kills Removal important in densely developed d areas Nutrient Removal
7 Sources of Excess Nutrients Wastewater Fertilizer runoff from agricultural and residential lands Pet waste Atmospheric deposition
8 Nitrate Removal (Denitrification) Naturally occurring process Need carbon source (organic material) and anaerobic conditions


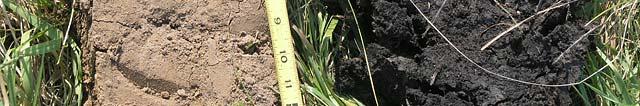
9 Organic matter and anaerobic conditions i both present in hydric soils
10 32 28 Nitrate-N Removal Dissolved Oxygen kg -1 d - -1 ) (mg L -1 ) Removal Rate (µg Dissolv ved Oxygen Hydric Soils Nonhydric Soils (n = 9 sites) (n = 5 sites) Nitrate-N
11 Groundwater Hydrology (Groundwater Flow Path) Is Important To Nitrate Removal Water table Groundwater flow path Coastal Wetland Estuary Aquiclude Shallow groundwater moves through wetland ecosystem with hydric soils High groundwater N removal
12 By protecting buffer zones we are often preserving groundwater flow paths and protecting areas with high potential for nitrate removal
13 Buffer Zone Water table Wetland (Coastal Feature) Groundwater flow path Estuary Aquiclude
14 Factors That Reduce Buffer Effectiveness Increased Slopes Highly Permeable Soils Dense Soils (e.g. dense till or shallow bedrock) High Sediment Loading High % of impervious surface in drainage area Altered Hydrology Subsurface Drains Concentrated Flow Artificially Lowered Water Tables
15 Human disturbance in coastal areas can minimize the N Removal Function Of Vegetated Buffers at the land-water margin: Retaining Wall Original ground surface Fill Drain Estuary/Stream Original Coastal Wetland: High Denitrification Soils
16 Urbanization Alters Hydrology
17 Urbanization Alters Hydrology Less infiltration, higher runoff volumes


18 Concentrated Overland Flow Examples: gutters, pipes, channels Velocity can exceed 1 foot per second Water crosses a 50 foot buffer in minutes
19 Vegetated Buffers fail if upland generates concentrated flows.
20 Urbanization Alters Streams
21 Urban riparian zone with channel incisement Altered Water Table Increased impervious surface and stream channel incisement in urbanizing watersheds can lead to lowered water tables undisturbed hydric sites mimic non-hydric sites after disturbance.
22 Forested vs. Urban Riparian Zones: Hydric Water Table Depths (Gold et al., 2001) pth surface (cm) table Table below Dep soil s Depth Water of water tt Forested Hydric RI Forested Hydric Riparian Zone Site Forested Nonhydric Forest RI Forested Nonhydric Hydric Baltimore Forest Undisturbed Hydric Suburban Hydric Baltimore Suburban Hydric Urban Hydric Baltimore Urban Hydric Urbanization creates water table dynamics similar il to natural non-hydric conditions: RI Riparian Sites Baltimore Riparian Sites Annual mean
23 Solution? Greater Buffer Widths Improved Upgradient Management
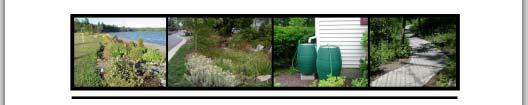
24 Low Impact Development (LID) Low Impact Development (LID) practices can protect buffers and coastal features by increasing infiltration
25 What Is LID? Stormwater management approach Attempts to preserve natural hydrology of a site Uses distributed, ib t d small-scale scale controls to manage rainwater and runoff
26
27 LID Underlying Principles Keep the water on the site Slow the runoff down Allow physical, chemical, biological processes to take place Reduce pollutant loading to waterways treat first flush
28 LID Strategies: Avoid, Reduce and Manage Impacts Identify and preserve sensitive resources Minimize lot disturbance Reduce and disconnect impervious surface Infiltrate runoff near its source Reduce concentrated overland flow encourage sheet flow to vegetated areas
29 LID TRADITIONAL
30 Jordan Cove Project, CT LID Cluster Traditional
31 SEA Streets Project Seattle, WA
32 LID Practices for Residential Lots Bioretention ( rain gardens ) Vegetated swales Permeable paving Infiltration trenches Dry wells
33 Bioretention / Rain Gardens Shallow depression with conditioned soil Capture runoff and allow it to infiltrate Filter runoff (physical and biological processes)

34 Vegetated Swales Densely vegetated open drainage channels Transport stormwater Slow flow rates Facilitate infiltration


35 Permeable Paving / Impervious Block pavers Porous asphalt or concrete Base of aggregate material Allow for infiltration Surface Alternatives
36 Dry Wells Small excavated trenches backfilled with stone Hold and slowly release rooftop runoff
37 Infiltration Trenches Excavated trench backfilled with aggregate and lined with filter fabric Often used where space is limited
38
39 Recommendations Buffers must be viewed as one component of surface water protection Where upland development is intense, land reshaping and LID practices should be used to enhance buffer function Optimal buffer width for water quality protection will vary with upland practices and site features


40 Thanks Dr. Art Gold, URI Dept. of Natural Resource Science