Building Operator Certification Level I
|
|
|
- Jean Pearson
- 5 years ago
- Views:
Transcription


1 Building Operator Certification Level I A Partnership of the CUNY Institute for Urban Systems Building Performance Lab, the CUNY School of Professional Studies, and the New York State Energy Research & Development Authority
2 Building Operator Certification Level I (BOCI) Building Systems: Electrical CUNY School of Professional Studies CUNY Building Performance Lab The BOC On-Site Generation, Schedules and Spreadsheets: Lesson 5
3 Agenda for Class 5 Topic 1: On-Site Generation and Load Management Topic 2: Load Management and Demand Response Topic 3: Schedules and Spreadsheets for Lighting & Motors
4 Topic One: Onsite Generation & Load Management To be familiar with on-site power generation its advantages and the different forms it takes Understand cogeneration technology and its application at your facility
5 Reasons for On-site Generation Emergency Power Back-up power Occasional use When the regular supply of power is down- continuity of operations Legal and emergency requirements (hospital, etc.) Supply power to the priority / important loads in the facility Data Protection Types of Emergency Power Sources Batteries: Uninterruptible Power Supply (UPS) Emergency Generators: fuel source diesel or natural gas Power Generation Normal operation/continuous use Energy and monetary savings Shaving of peak load Higher efficiency of Co-Gen Generation using green power sources (photovoltaic (solar electric), wind or geothermal ) Supply power for facility s part load, such as: Part (~5%) of power load is met by solar electric (PV) panels 50% of the facility power load is met by a Co-Gen plant

6 On-Site Electrical Generation Generator Set Used for applications: Emergency Power Generator or Continuous Power Generation o Prime mover: engine or turbine o Electric generator o Controls, switchgear, etc
7 Electric Generators Two Kinds Emergency Power When the regular supply of power is down Synchronous Generator is used for: Stand-alone operation capability Black-Start on a power loss Precise constant speed control Capable of generating 60 hertz AC electric power required for equipment loads More stringent requirements to connect to the electric grid Power Generation Normal operation/continuous use Synchronous or Induction Generators are used Induction Generators are: Simple in design: like induction motor Lower cost than synchronous generator Easier to connect to grid than synchronous generator Must work in connection to grid, cannot work stand-alone Operates in parallel to the grid
8 On-Site Electrical Generation How Emergency Power is Transferred Normal source of power (top left) feeds the normal 480 Volt bus Transfer switch connects this normal source of power to the 480 Volt emergency bus (bottom of diagram) When the normal power supply is down, the Automatic Transfer Switch (ATS) switches specific to the back-up generator ATS is tested regularly, monthly or quarterly

 Co-Gen plants capture the heat of the fuel normally wasted for other uses in the facility, such as heating.")
9 Types of Power Generation Electric Utility Power Generation Standard electric power plants burn fuel oil or natural gas in a boiler to create steam to power a turbine. After it s used, the steam is condensed, rejecting 2/3 of the energy in the fossil fuel. This energy loss is part of the standard heat cycle of power generation: only 1/3 the fossil fuel s energy is converted to useful electricity! Co-Generation (Cogen) Co-Gen plants capture the heat of the fuel normally wasted for other uses in the facility, such as heating. The efficiency of a Cogen plant is much higher than a standard power plant which produces only electricity.
10 Cogeneration: definition Getting two forms of usable energy from a single fuel input. FUEL ELECTRICITY + HEAT Natural Gas (usually) fuels engine or turbine that drives generator. Waste heat recovered and delivered to building, to supply the heating loads of the building. This will supply a portion of the total heat load. Also called Combined Heat & Power (CHP) EFFICIENCY OF GENERATION SOURCES Utility-generated electricity 33-45% efficiency Boilers for heating 65-75% efficiency Co-generation 75-85% officiency COGEN IS MUCH MORE EFFICIENT, BUT ONLY IF WASTE HEAT CAN BE RECOVERED AND USED ONSITE!

11 Efficiency of Cogen Package Unit Efficiency Analysis Efficiency = Energy Output Energy Input Efficiency = 644,840 = 83% 779,000 Total Output of Energy: 644,840 Btu/hr Total Input of Energy: 779,000 Btu/hr Energy Output includes the electrical energy and the heat energy, both Converted to Btu s. Courtesy: Tecogen Inc.
12 Cogeneration: Topping Cycle GEN Engine drives generator (recip engine or gas turbine) Capture waste heat from prime mover and use this recovered heat for the building (heating or cooling).
 : 7 L x")
13 Cogeneration: Typical Topping Cycle Plant for a Medium-Size Institution Dimensions (100 kw unit) : 7 L x 4 W x 5.5 H
14 Cogen: What do you Need? Space for equipment (see previous slide for footprint ) Long facility operating hours with electric AND thermal loads, such as hot water and heating The best sites have long operating hours and relatively steady loads for electricity and heat Hospitals, hotels, prisons, apartment complexes The heat recovered can also by used for cooling by absorption type chillers
15 Cogeneration: Load Matching Only economic when waste heat is recovered and used So the heat generated must be matched by the heat used, both in the time of season and the time of day Graph shows: Seasonal mis-match heat is generated in summer Solution: use absorption cooling to capture the waste heat and drive an absorption chiller
16 Cogeneration: Load Matching (cont d) Graph shows a daily mismatch, with heat generated in the daytime but needed at night. Solution: Add storage tanks to store the hot water during the day and for use during nightime load peaks.
 Can also use a steam turbine to directly drive a")
17 Cogeneration: Bottom Cycle Using Available High Pressure Steam Back-pressure turbine replaces a Pressure-Reducing Valve (PRV) Can also use a steam turbine to directly drive a pump or fan
18 Cogen Operations & Maintenance Operations: Run without recovering heat? o When there is not a need for the heat recovered, a waste heat generator or heat balance radiator is used o When you are running with a heat balance radiator, you are probably not saving money o Operation without heat recovery may be economical for Demand Response. To reduce the peak electric load for a few hours during the peak demand times in the summer. Maintenance: Reciprocating engines need monthly maintenance. Turbine generators require less maintenance.
19 Topic 2: Load Management & Demand Response Understand the importance of load management Be able to select loads in your facility for load management and demand response Understand Peak Demand and its management
20 Electric Bills Rate Structure Electric Bill Rate Structure Base charge fixed amount ( $ per month ) Consumption charge ( $ per KW-hours) Demand charge ( $ per KW ) Electric Utility Rate Structures Regulated by NYS Public Service Commission
21 Electric Bill Example Electric Bill for a building of 100,000 Sq Ft $10,000 per month = $120,000 per year Electric Bill Base charge fixed amount: $200 per month Consumption charge KW-hours: $6,000 per month Demand charge $30 per KW $3,800 per month Total: $10,000 per month The demand charge can increase your electric bill by 60%!
22 Key Terms Energy Consumption - The amount of energy used over a period of time; the units are kilowatt-hours. Consumption is also called energy use or energy usage. Demand The amount of power drawn at one point in time. For electrical demand the units are watts or kilowatts (kw). Peak Demand - The peak power that is demanded during a specific (brief) period of time. For electric peak demand, the peak KW measured over a 15 or 30 minute interval. Demand Charge The charge based upon the Peak Demand of electric power in a specific time frame, usually the peak 30 minutes in a month. Example: $30 / KW / month Load Profile A graph of electric demand (power in kilo-watts) over a period of time
23 Annual Load Profile (Electricity) Usage as it varies over a time period day, month, year kwh (Thousands) Electricity Consumption 10 0 Jan Feb Mar Apr May Jun Jul Aug Sep Oct Nov Dec Month PEAK USE - AC ELECTRIC BASE USE - LIGHTING, MOTORS, ELEVATORS, APPLIANCES, REFRIGERATION, COMPUTERS


24 Load Management in the Facility Demand & Usage Load profile & peak demand limiting Peak ~ 280 kw Peak Shaved to 250 kw
25 Load Profile - Daily Load profile results from equipment operation
26 Demand Charges - Example Demand (Peak Demand) is measured in KW Based on the peak demand of power over a period of time. Example: October 4th: Peak demand is 100 KW October 10th: Peak demand is 150 KW October 18th: Peak demand is 200 KW October 28th: Peak demand is 100 KW The electric utility demand charge rate is $30 / KW / month What is the demand charge for the month of October? Demand Charge = (Highest) Peak Demand x demand charge rate Demand Charge = 200KW (10/18) x $30/ KW/month = $6,000 / month
27 Electric System Peak Electric System Peak is peak demand for the entire city or region. The summer peak is usually the highest demand for electricity during the year. System peak is for the utility grid overall and is typically set by air-conditioning load of a city s commercial sector, in mid-late afternoon Electricity Consumption Jan Feb Mar Apr May Jun Jul Aug Sep Oct Nov Dec Month
28 Load Management: Electric System Peak Demand Response Program In Demand Response Programs utilities contract with building owners to make load reductions when called upon, at times of system peaks. Call for short duration action usually a minimum 4-hour period Response to request must be reliable and timely Documentation of deployment required Penalties for failure to provide contracted response
29 Why Demand Management? Electricity that drives up the Peak Demand is more expensive than off-peak electricity High, short-duration peaks drive up the average cost of all kilowatt-hours consumed Utilities will Pay for your load reduction [ Demand Response Program ] See Let s examine some load management strategies
30 Load Management: Demand Actions you can take to reduce peak demand Load Shedding, Peak-Shaving Prioritized load-shut-downs Turn-off non-essential loads Occupied areas some loads to turn-off Un-occupied areas more loads to turn-off Duty cycling largest equipment can be shut down for short periods of time, and then restarted. By manual operation for a period of time By automatic operation on a schedule by BMS
31 Management of Non-Essential Loads Two vacuum pumps running (you only need one) Two condensate pumps running (you only need one) Two heating water circ pumps running (you only need one) Two chilled water circ pumps running (you only need one) Blower fans on in unoccupied spaces Exhaust fans on in unoccupied spaces Unoccupied areas Large Areas: Cafeteria, Auditorium What can you turn off: Lights and Fans Some hallway lights Some classroom lights Turn off the Boiler at 2:00 pm
32 Load Management Examples: Load Shifting to off-peak times Hot water making Domestic hot water-don t operate boilers if you have a tank of hot water to meet your needs. Dishwashing - Wash dishes after peak time (dishwashers use electric heaters) Other equipment not essential to current operation Equipment for Load Shifting - Thermal storage During off-peak time, make cold water or ice at night and store for next day use During peak periods the cold water or ice is used provide cooling to the building, reducing the need for compressors. Equipment for Generation Customers start up their stand-by generators and provide a source of generation to the grid.
33 Example of Actions by Building Operator for Demand Management: Equipment Description Action Electric Demand (KW) Reduced Boiler 1 Burner Motor 15 HP Turn Off Not Needed 9 KW Condensate Pumps 4 10 HP Turn Off Not Needed 24KW Vacuum Pump 1 10 HP Turn Off Not Needed 6 KW Air Handlers 2 Each 2 x 15 HP Turn Off Not Needed 36 KW Lighting in Un-occupied Area Turn Off Not Needed 1.5 KW Lighting in Hallways & Some Rooms Turn Off Not Needed 1.0 KW Dishwashing Machines Shifted to evening usage 6 KW Demand Reduction Total: 83 KW
34 Topic 3: Schedule & Spreadsheets for Lighting & Motors Topic Objectives: What do these schedules and spreadsheets tell us? Why is a basic understanding of Excel helpful? Why is it important to know Agenda Conducting basic calculations in a spreadsheet Setting up a spreadsheet from data Preparing a schedule for lighting survey data Reading a schedule from plans (for motors)
35 Basic Excel Calculations From our Basic Excel class, we already have an understanding of: Cell designation Rows Columns Basic Excel operations Next we ll cover using some basic formulas in excel

36 Basic Excel Calculations Why should we learn to use Excel?? We can perform various operations without having to do them by hand. i.e. totaling the values in a column or row as seen in the picture to the right
37 C1 Basic Excel Calculations For review: Formulas must begin with an = sign For addition, use + i.e.: =E3+F3 For subtraction, use - i.e.: =E3-F3 For multiplication, use * i.e.: =E3*F3 For Division, use / i.e.: =E3/F3
38 Slide 37 C1 Will the instructor be projecting excel to the class and show some examples of these formulas? There is an Excel Prep Course that I taught last week that covered using basic formulas in fairly great detail, showing these examples as a review should be more than enough. CLASS2009, 9/11/2012

39 Basic Excel Calculations IMPORTANT TIP!! Do NOT hard code numbers into formulas Though technically not incorrect, it does defeat some of the purpose of using Excel By entering formulas using the cells, instead of numbers, the formulas will update automatically if the contents of the cells change
40 C2 Setting up a Spreadsheet from Data Often times you will need to take information on paper and enter it into a spreadsheet Lighting Survey Data Utility Bill Data This information is entered into Excel to be used in different types of calculations
41 Slide 39 C2 In the instructor notes, we should include more about how operators can use excel back on the job and how it can help them. We have the students perform 3 different exercises in the Excel Prep Course that demonstrate how Excel can be helpful back on the job. In addition to the slides on setting up spreadsheets from data in this lesson, we cover most applications that they could potentially use on the job. I think that adding more examples on how Excel is useful starts to get to be a bit outside the scope of this lesson as well as a bit complex for the students, many of whom have little to no experience with Excel. CLASS2009, 9/11/2012
42 C3 Setting up a Spreadsheet from Data Billing Dates Consumption & Demand Billing Charges
43 Slide 40 C3 In the instructor notes, what would review in class about this diagram? Depending on what Michael Bobker wants, I belive that this slide is going to be removed from the final lesson. I have added in a slide after this one that shows that information on a Utility Bill can be easily translated to a spreadsheet. The example spreadsheet on the following slide was taken from one of the exercises in the Excel Prep Course. The circles help to direct students to the items on the Utility Bill that become the column headings when translated to an Excel Spreadsheet. CLASS2009, 9/11/2012
44 Setting up a Spreadsheet from Data Do you notice any similarities between the items that were circled on the previous slide and the column headings in this spreadsheet?
45 C4 Setting up a Spreadsheet from Data Common Inputs Fuel Consumption (kwh, therms, gallons) Electric Demand (kw) Costs ($) Totals Meter read-dates Days in Billing periods IMPORTANT: If looking for Total Energy Use, all fuel types should be converted to the same units (BTUs)
46 Slide 42 C4 So these are "columns" in excel? The common inputs listed on this slide are typical column headings that they might see in a spreadsheet. CLASS2009, 9/11/2012
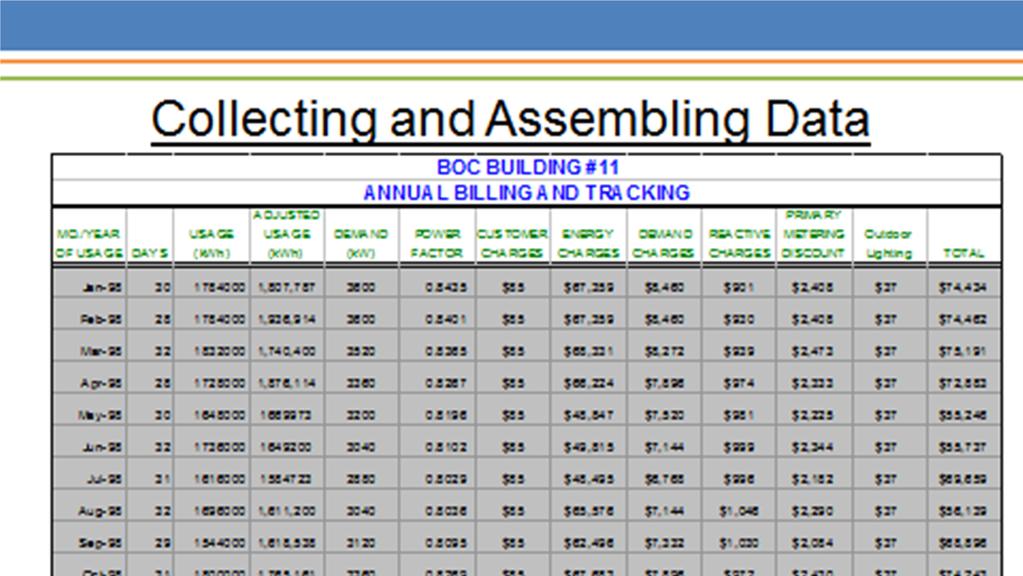

47 C5
48 Slide 43 C5 In the instructor notes, what would review in class about this diagram? This slide is an example of a more complex spreadsheet that has been set up from data, in this case it is a spreadsheet to track annual electrical demand & consumption and the charges associated with them. Not sure what you mean by there is a simpler example. Why don't we use it then, or do we? I've updated some of the slides, the simpler example is now shown on slide 10 CLASS2009, 9/11/2012
49 C6 Preparing a Lighting Schedule for Purpose of a Lighting Survey A Survey or count of light fixtures throughout the building Used to develop an estimate of the total electricity use by lighting Useful for identifying areas for potential energy reductions Can see how large/small fixtures are Can also be organized by space type, to identify reductions based on space type i.e. bathrooms, mechanical closets, office spaces, etc
50 Slide 44 C6 It's a bit confusing because you mention a "schedule" a "survey" and a "spreadsheet". Are these synonymous terms or three separate things? These terms are not synonymous, I've changed some of the verbage around on this slide as well as the next to make it a little clearer for the students. CLASS2009, 9/11/2012
; You only need to make")
51 C7 Preparing a Lighting Schedule for Used to develop a Schedule or an inventory of fixtures in a facility Either hand-written notes (shown below) or using a template (shown right) is acceptable, as long as the required information is obtained Helpful Tip: A Lighting Survey form can be made easily by modifying a lighting spreadsheet (like the example on the next slide); You only need to make cells large enough to allow notes to be written and clearly readable
52 Slide 45 C When you say "template" do you mean an excel table? Yes/No, by template I mean any blank form that they can print out copies of and use to record the required information during a lighting survey. This doesn't have to be an excel spreadsheet, it can be a word document or any other file type that they want to use as long as it has the correct information and fields on it to accurately complete the lighting survey In the instructor notes, please add what you would explain about the two images on the slide What's the difference between a lighting survey and a lighting spreadsheet? CLASS2009, 9/12/2012

53 C8 Sample Lighting Survey Information from the Lighting Survey is then taken and entered into a spreadsheet This spreadsheet calculates monthly and annual lighting electrical usage based on the information entered. Spreadsheets can either be filled entirely like the one shown below, or they use a reference table as explained on the following slide In the spreadsheet shown below, the # of fixtures, # of lamps, Watts and ballast factor are entered from notes taken during the lighting survey. Formulas are used to calculate Total kw, monthly kwh, operating hours and cost
54 Slide 46 C So do you use a ljghting survey to create a lighting spreadsheet? Yes, this was also answered further in the instructor notes on the previous slide Do we need to explain which excel formulas are used? I think it's more prudent that they understand what the spreadsheet is doing with the information and a brief overview of how things are being calculated rather than get into having them learn the actual Excel formulas So how does an operator use this information back on the job? I think the purpose of this section is to familiarize students with what a lighting survey is as well as why it is important, we're not asking or expecting students to be able to perform lighting surveys on their own. CLASS2009, 9/12/2012

55 C9 Sample Lighting Survey Reference Tables A table of various light fixture types, bulb types, wattages that a spreadsheet will pull information from
56 Slide 47 C9 So how does an operator use this information back on the job? Simple answer would be that they don't, this is an example of a reference table which is a semi-automated way of generating a lighting spreadsheet. Rather than specify all of the information that you observed for a fixture, you can select the fixture description that most accurately relates to what you saw and calculations will be automatically done based on your selection as well as the quantity that you specified. CLASS2009, 9/12/2012

57 C10 Sample Lighting Survey Information about light fixtures are selected either in a drop-down menu or by entering a fixture code (specified by fixture code in the example shown above) In the image shown below, we can see that for fixture code CFG42/1-L there is 1 lamp/fixture, 42 Watts for each lamp, and a fixture wattage of 42 Watts as well. These values will be used in a kw or kwh savings that will be done in this spreadsheet. Values will differ based on the fixture code entered
58 Slide 48 C This looks like a different spreadsheet than the one on slide 14. Why did you use a different one? This is the front-end of the reference table that was shown on the previous slide, this slide serves to finish explaining how a reference table works to generate a lighting spreadsheet Not sure what we are saying on this slide. Why are we selecting the light fixtures? See answer to the above comment You need to explain this slide and how it relates to the previous slides. See answer to top comment. CLASS2009, 9/12/2012
59 C11 Reading a Schedule from Plans for Motors Motor Schedules are a different way of presenting motor information For example, rather than looking at separate Pump and Motor nameplates, a Schedule presents all of the information in one place.
60 Slide 49 C11 In the notes, you say "the nameplate picture" but there is no picture on the slide. Is it the image on the next slide? Yes CLASS2009, 9/12/2012


61 Reading a Schedule from Plans for Motors Notice how the same information is presented in both the nameplate to the left and the schedule below, what differs is the way that this information is organized. Schedules are helpful because all the information is presented in one place, notice below that specifications for pumps and motors are shown


62 C12 Reading a Schedule from Plans Often times a set of building drawings will have a sheet with schedules for various pieces of equipment; notice in the image on the left, the titles of each schedule will tell you what information you can expect to see. Which schedule should you look at to find information on the motors for the pumps in the buildings?
63 Slide 51 C12 Do you have the source of this so we may try to get a better image? The original source is a full size drawing, unless there's some way of scanning the entire sheet then there's no better way of getting this image. Speaking with Mike Bobker, he was fine with this image since it only needs to show that we picked the "Pump Schedule" out of the entire page of various schedules. CLASS2009, 9/12/2012


64 C13 Reading a Schedule from Plans In this close-up of the Pump Schedule from the sheet shown on the previous slide, we see that motor horsepower and design RPM are specified on the Pump Schedule.
65 Slide 52 C13 I assume we will use RPM and HP on a spreadsheet? See the activity on the following slides. CLASS2009, 9/12/2012

66 Reading a Schedule from Plans The information in the schedule can be transferred to a spreadsheet and used for calculations. With the data in a spreadsheet, as shown above, we can manipulate the data to calculate different things. On the following slides we will show how you can calculate Annual and Monthly Electric Consumption for these motors


67 C14 Motor Schedule Activity We start by finding the equivalent kw Draw for the motor. From Herzog s book, we know that a safe way to estimate electric use is to multiply motor horsepower by.55 to get kw. This calculation is shown in the image to the left, the finished process shown to the right.
68 Slide 54 C14 Should we go into more detail about the excel formulas you are using to do these calculations? I explain the steps that are shown in each image as well as show the formulas that are used in any applicable steps. The students have also taken the Excel Prep Course if it was found that they needed it, so no there is no need to go into more detail about the excel formulas. How would an operator use this information on the job? Not saying they would use this because most of the students won't ever be required to do something like this for work, but they could use this to do exactly what's shown on this slide and the slide after, calculate actual kw Demand, Monthly and Annual Run-hours. The end goal of this calculation is to be able to see how many kwh is atributable to the pumps for the example facility.. CLASS2009, 9/12/2012


69 C15 Motor Schedule Activity As illustrated above, the monthly run-hours can be multiplied by 12 to get an estimate of Annual run-hours. Finally, the annual run-hours can be multiplied by the kw Consumption to calculate the Annual kwh Consumption for each motor.
70 Slide 55 C15 How would an operator use this information on the job? See response on previous slide. CLASS2009, 9/12/2012
71 R1 Review How are they all related? Schedules, Utility bills and Lighting survey data can be thought of as spreadsheets Excel allows us to rearrange and manipulate this information however we need
72 Slide 56 R1 Let's include more about how the inormation is used back on the job. Robert, 8/31/2012