Lessons Learned. Developing the Federally Mandated TAMP 2018 LOUISIANA TRANSPORTATION CONFERENCE. Louisiana Department of Transportation & Development
|
|
|
- Kory Rose
- 5 years ago
- Views:
Transcription
1 Lessons Learned Developing the Federally Mandated TAMP 2018 LOUISIANA TRANSPORTATION CONFERENCE Louisiana Department of Transportation & Development Mark Suarez P.E. Randy Goodman P.E. February 28, 2018
2 Asset Management in US (ISTEA) Intermodal Surface Transportation Efficiency Act o National Highway System (NHS) Established (TEA-21) Transportation Equity Act for the 21 st Century o FHWA Office of Asset Management Created (SAFETEA-LU) Safe, Accountable, Flexible, Efficient Transportation Equity Act: A Legacy for Users (MAP-21) Moving Ahead for Progress in the 21st Century Act (FAST Act) Fixing America s Surface Transportation
3 Federal TAMP Rules TAMP (23 CFR Part 515) Asset Management Plan oinitial TAMP Due: April 30, 2018 ofully Compliant & Implemented TAMP Due: June 30, 2019 PM2 (23 CFR Part 490) National Performance Management Measures (required 2018) o Capture Data Before: December 31 o Submit Data: Interstate: April 15 Non-Interstate: June 15 (23 CFR Part 667) In Effect: November 23, 2016
4 TAMP $$ Penalties TAMP (a) Penalties Beginning on October 1, 2019, and in each fiscal year thereafter, if a State DOT has not developed and implemented an asset management plan the maximum Federal share for National Highway Performance Program projects and activities carried out by the State in that fiscal year shall be reduced to 65 percent for that fiscal year. (applied to the entire year) Suspend all NHPP funds if 18 months after October 2, 2017, DOT has not established pavement & bridge performance targets and does not have a FHWA certified compliant TAMP (applied until compliant)
 - 23 CFR Part 490 o Must Develop Documented")

5 FHWA TAMP Certification TAMP - FHWA Certification/Recertification o Must Comply w/ 23 USC 119, 23 USC 150, 23 CFR Part 515 & 23 CRF Part 667 o Plus National Performance Measures (PM2) - 23 CFR Part 490 o Must Develop Documented Process for Developing TAMP o Must Use Documented Process to Develop TAMP o Non-Compliant if Process Not Documented or Not Used Initial Consistency Determination o Based on Plan Development & Content o Based on Plan Implementation
6 FHWA TAMP Certification FHWA Review TAMP Development Process o Written Denial w/ List of Specific Deficiencies 90 Days to Address Deficiencies & Resubmit o Written Conditional Certification w/ List of Minor Deficiencies 90 Days to Address Minor Deficiencies & Resubmit TAMP Requires Continual Recertification o Must Update TAMP & TAMP Development Process at least every 4 Years o Due 30 days prior to next FHWA Consistency Determination o Minor Technical Corrections/Revisions having No Material Impact on Accuracy/Validity do not require submissions to FHWA
7 FHWA TAMP Consistency Determination Annual Consistency Determination o No Later than August 31, 2019 o No Later than July 31 Each Year After o Determination of Consistency Based On o TAMP Content o Implementation of TAMP o Not Approval/Disapproval of Strategies or Decisions in Plan
8 TAMP Implementation Focus Points NHS Pavements & Bridges o Management Systems are now Mandated o PM2 Requires Data Quality Management Program Approved by FHWA Asset Management Objectives & Measures Performance Gap Identification Life Cycle Planning Risk Management Analysis A Financial Plan Investment Strategies
9 PM2 Interstate Pavement Penalties PM Penalties for not Maintaining Minimum Interstate System Pavement Condition Not NHS Pavements (Yet) and, transfer, from the amounts apportioned to the State DOT under 23 U.S.C. 104(b)(2) (for the Surface Transportation Program) to the apportionment of the State under 23 U.S.C. 104(b)(1), an amount equal to 10 percent of the amount of funds apportioned to the State for fiscal year 2009 under the Interstate Maintenance program for the purposes described in 23 U.S.C. 119 (as in effect on the day before the date of enactment of the MAP 21). Initially 9.2 M from STP, Plus 2% Per Year FAST Act, penalty under 23 U.S.C. 119(f)(1)(A) if Interstate pavement condition has fallen below the minimum condition level for the most recent year
10 TAMP Major Focus Points NHS Pavements & Bridges o Management Systems are now Mandated o PM2 Requires Data Quality Management Program Approved by FHWA Asset Management Objectives & Measures Performance Gap Identification Life Cycle Planning Risk Management Analysis A Financial Plan Investment Strategies
11 TAMP Major Focus Points NHS Pavements & Bridges o Management Systems are now Mandated o PM2 Requires Data Quality Management Program (c) Other Requirements Asset Management Objectives & Measures Performance Gap Identification Life Cycle Planning Risk Management Analysis A Financial Plan Investment Strategies
12 TAMP Data Requirements 23 CFR 515.7(f) The processes established by State DOTs shall include a provision for the State DOT to obtain necessary data from other NHS owners in a collaborative and coordinated effort. LADOTD Now Collects Condition Data For Local NHS (MPO) Pavements (On 2 nd Cycle) LADOTD performs all NBI Inspections on All Bridges 23 CFR 515.7(g) States DOTs shall use the best available data to develop their asset management plans.
13 General TAMP & PM2 Data Needs Data Required For Asset Inventory & Condition Risk Assessment Treatment (Work Type) Cost Revenue & Budget Projections Performance Measures & Targets Management Systems (What-If Scenarios) Future Needs (Forecast Deterioration) Communication Tools (Dash Board)
14 PM2 NHS Data Collection Rules All NHS Pavements in Inventory Direction of Mainline Highways (December 31) o Collect Interstate Annually & Report Annually o Collect Non-Interstate NHS Biennially & Report Annually o Now Optional to Report Interstate Both Directions o Full Extent not Sampling o Data reporting for HPMS 3 decimals (3 decimals = 1 thousandth of a mile = 5.28 feet) o Option 0.1 mile vs pavement change segments Continue to Force all data to 0.1 mile segment Otherwise the data must line up almost exactly for consecutive years
15 Louisiana PMS Data Collection Contracted Data Collection Since 1991 (Early Adopter) New January 2017 PMS Data Collection Contract o Changed Timeline from Fiscal Year to Calendar Year Adjusted for Fed Dec 31 Deadlines o Captures Federal Interstate & Non-Interstate NHS Data Each Year (Will Make Non-Interstate NHS Adjustment) o Captures ½ All State Maintained System PMS Each Year o Selected New 3-D Technology Option Pro crack depth now available, no depth = no crack Con potential issue with historical performance curves
16 General TAMP & PM2 Data Components Data Capture Cycles must meet requirements Timeliness data can t be out of date Accuracy more critical than ever Quality Assurance / Quality Control quality of the data must be verifiable Location most transportation data has a location component & it must be accurate Maintenance & Historical Data Access must keep data usable and available Storage you have to put it somewhere Analysis need tools & skills to analyze data
17 General TAMP & PM2 Data Needs Data Deficiencies State Will Not Have Made Significant Progress if >= 5 % Mainline Lane Miles data missing, unresolved, or invalid o Federal Funding Consequences Missing Data don t always have all needed data, even when you plan to collect it o IRI slow speeds on short section, traffic signals, stop signs, traffic volume; PSR Option o Temporary Lane Closures, accidents, stalled vehicles, etc. o Only Maintain Data of Consequence New Data Requirements Local NHS (MPOs)
18 General TAMP & PM2 Data Needs Data Entry Errors even with pick list Data Must Have a Responsible Owner Existing Data Errors data that wasn t critical may now be critical and must be accurate o Cracking Percent o Faulting Measures o Number of Lanes Data Deficiencies
19 General TAMP & PM2 Data Needs Data Interoperability and Consistency Using Indexes for Disparate Data Comparison (i.e. roughness vs rutting indexes) Linking Data Systems kill the data silos and eliminate inaccurate data redundancy Need One Source of Truth GIS ties data together and allows data viewing in a spatial way ESRI Roads & Highways potential tool to tie all the data silos together and eliminate redundancy
20 TAMP Major Focus Points NHS Pavements & Bridges o Management Systems are now Mandated o PM2 Requires Data Quality Management Program (c) Other Requirements Asset Management Objectives & Measures Performance Gap Identification Life Cycle Planning Risk Management Analysis A Financial Plan Investment Strategies
21 FHWA PM2 Pavement Condition Rating Network Level Analysis Pavement Rating - IRI, Cracking Percent, Rutting (Asphalt), Faulting (JCP) o Good = All 3 Conditions Rated Good o Poor = 2 or More Rated Poor o Fair = Not Good or Poor Significant Progress based on comparison between: o Target & Actual Condition/Performance o Baseline Condition/Performance & Actual Condition/Performance 1st Reporting Dates Interstate 2019 & Non-Interstate NHS 2021/2022 o Data Capture by December 31 st
22 Comparison of Objectives & Measures Asphalt & Composite Pavements Pavement Condition Measures Asphalt Pavement Distress Types DOTD Fatigue (Alligator) Cracking Composite Pavement Distress Types Units of Measure Sq.Ft. (DOTD Wheelpath) HPMS Fatigue Cracking HPMS Fatigue Cracking Sq.Ft. (HPMS Wheelpath) Longitudinal Cracking Longitudinal Cracking Linear Ft. Transverse Cracking Transverse Cracking Linear Ft. Patch\Patch Deterioration Patch\Patch Deterioration Sq. Ft. & Count Potholes Potholes Sq. Ft. & Count Rutting Rutting Inches IRI IRI Inches / Mile Blowups Sq. Ft. & Count 22
23 Comparison of Objectives & Measures Jointed & Continuously Reinforced Concrete Pavements Pavement Condition Measures Jointed Concrete Pavement Distress Types Continuously Reinforced Pavement Distress Types Units of Measure Longitudinal Cracking Longitudinal Cracking Linear Ft. Transverse Cracking Transverse Cracking Linear Ft Patch\Patch Deterioration Patch\Patch Deterioration Sq. Ft. & Count Blowups Blowups Sq. Ft. & Count IRI IRI Inches / Mile Faulting Inches Punchouts Sq. Ft. & Count 23
24 Louisiana Pavement Management System How It Works Per Year Funding Projections Identified (Minimum 10 Years) First Year Treatments (FHWA Work Types) Are Determined Most Efficient Treatments Are Applied Until Funding is Exhausted Pavements Not Receiving Treatments are Further Deteriorated Pavements Receiving Treatments Have Index Resets Based on Treatment Life Cycle Improvement Repeat the Process for Each Analysis Year
25 Louisiana Pavement Management System Project Level Analysis Unitless Indexes - Alligator, Random, Patch, Rut, Roughness, Transverse, Longitudinal o Faulting used for JCP - not Indexed Range from 1 to 100, with 100 = Perfect Blow Up Area & Punchout Area included as High Severity Patching Severity and Extent Deducts on Indexes
26 Louisiana Pavement Management System Indexes & Treatment Triggers Asphalt Trigger Indexes (13 Treatments) o Alligator, Random, Patch, Rut, Roughness Composite Triggers Indexes (18 Treatments) o Random, Patching, Rutting, Roughness Jointed Triggers Indexes (22 Treatments) o Transverse, Longitudinal, Patching, Roughness + Faulting CRC Triggers Indexes (6 Treatments) o Longitudinal, Patching, Roughness
27 # Asphalt Treatment Description COST PER MILE FOR 2 LANES COST PER MILE FOR EXTRA LANES 1 Microsurfacing on Interstate 74,000 34,000 2 Thin Overlay on Interstate (Cold Plane 2", put 2" back; sq.yds. Patching) 242, ,000 3 Medium Overlay on Interstate (Cold Plane 2", put 3.5" back or just 3.5" overlay, sq.yds Patching) 481, ,000 4 Structural Overlay on Interstate (7" Overlay; 700 sq.yds. Patching) 1,127, ,000 5 Microsurfacing on Arterial 74,000 34,000 6 Thin Overlay on Arterial (Cold Plane 2", put 2" back; sq.yd. Patching) 242, ,000 7 Medium Overlay on Arterial (Cold Plane 2", put 3.5" back or just 3.5" overlay, sq.yds Patching) 481, ,000 8 Structural Overlay on Arterial (5.5" Overlay; 700 sq.yds. Patching) 911, ,000 9 Polymer Surface Treatment on Collector 74,000 29, Microsurfacing on Collector 74,000 34, Thin Overlay on Collector (2" Overlay; sq.yd. Patching) 195,000 82, Medium Overlay on Collector (Cold Plane 2", put 3.5" back or just 3.5" overlay, sq.yds Patching) 354, , In Place Stabilization on Collector (In-Place Stabilization & 3" A.C.) 534, ,000 27
28 PM2 Pavement Objectives & Measures Fault Avg Fault Avg Fault Avg *FA Tied To Joints # of Joints *FA Tied To Joints Total Faults 1098 Min 0.1 inch Min 0.1 inch Min 1mm No Minimum With "0" Includes "0" faults % Faults % Real Time Post Proc. Post Proc. Post Proc. Faulting Post Proc. Miles Average Counts Percent Faulting < 0.1 Faulting Faulting > 0.15 # of 0.1 mile segments Faulting < 0.1 Faulting Faulting > % 45.0% 90.0% 100.0% 100.0% 35.0% 25.0% 10.0% 0.0% 0.0% 60.0% 30.0% 0.0% 0.0% 0.0%
29 Pavement PMS vs PM2 Conclusions PMS Can t Change to PM2 Measures o PM2 Measures = Perfectly Acceptable Network Level Measure o PM2 Measures = NOT Project Level Measures Federal Measures Have Limiting Issues w/ Respect to PMS o Federal Cracking Requirements Don t Support Project Selection (i.e. chip seals on small cracks, overlays on large cracks) o Asphalt & Composite Pavements Don t Deteriorate in the Same Way PMS Can t Predict Future PM2 Performance o Several States are Developing Cross Walk Tables o Louisiana Not Able to Use Historical Data To Do So o Really Only Matters If You Are Close to Penalty Mode

30 Percent of Lane-Miles Highway Category 30
31 Percent VMT Highway Category 31
32 32
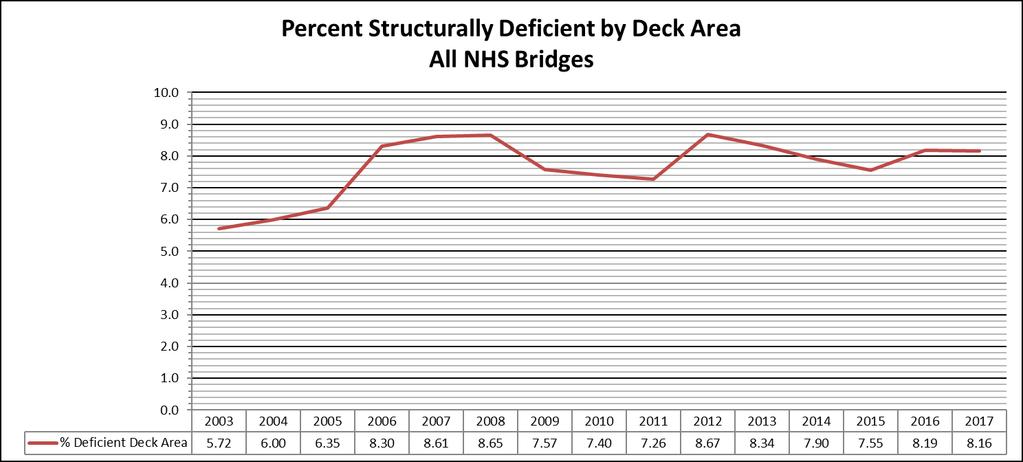
33 PM2 NHS Bridge Penalty Penalty Assessed o If >10 % of the Total Deck Area is Structurally Deficient o 3 Most Recent Years (? Average?) If NBI Data Not Reported & Cleared as of June 15, State has Not Made Significant Progress Statutory Requirement - 1 st Bridge Condition Determination in 2016 (by October 1, 2016) & in 2017 (by October 1, 2017) Required Bridge Target: May 20, 2018
34 PM2 NHS Bridge Funding Penalties PM Penalties for not maintaining bridge condition The State DOT shall obligate and set aside in an amount equal to 50 percent of funds apportioned to such State for fiscal year 2009 to carry out 23 U.S.C. 144 (as in effect the day before enactment of MAP-21) from amounts apportioned to a State for a fiscal year under 23 U.S.C. 104(b)(1) only for eligible projects on bridges on the NHS. $86M of NHPP would have to be set aside for eligible bridge projects on the NHS in Louisiana
35 FHWA Bridge Objectives & Measures PM2 Required Bridge Performance Measures Applicable to All NHS Bridges o Includes On- and Off-Ramps Connected to the NHS o Includes Bridges carrying the NHS that Cross a State Border (applies to both states) PM a Bridge will be Classified as Structurally Deficient When 1 of the NBI Items: o 58 Deck, 59 Superstructure, 60 Substructure, or 62 Culverts, Poor (SD) <= 4 o Good = All NBI Items > = 7 By Deck Area not # of bridges Component Not Element Analysis
 AgileAssets - Bridge Management System NBIAS What FHWA uses to report")
36 FHWA Bridge Objectives & Measures Currently Moving to AASHTO BrM (Bentley) o Element Level Analysis Maintaining old AASHTO PONTIS for analysis o Component Level Analysis (PM2 Rule) NBI Inspections LADOTD still capture both Component & Element Deighton dtims (Deighton's Total Infrastructure Management System) AgileAssets - Bridge Management System NBIAS What FHWA uses to report to Congress
37 Louisiana Bridge Objectives & Measures Switched from % SD by number of bridges to % Structurally Deficient by Deck Area Reason for Change o 2005 Katrina Destroyed the Twin 5.5 mile I-10 Bridge Spans from New Orleans to Slidell o Over 3.5 million square feet of deck area o 0.03% or 3 hundredths of a percent of the total number of State bridges o 2.3% of the total bridge deck area in the State
38
39 PM2 Bridge Objectives & Measures 7887 Bridges on State System (2013) 118 Bridges w/ Deck Area > 175,000 sq. ft. 1.5% of the Total Number of Bridges 47% of the Total System Deck Area Need to update to include Causeway Preservation Mega Project Budget Allocation (Scheduled $6.8 mil 2021; increasing to $52.7 mil 2028)
40 Bridge Project Data Analysis Analysis of Completed Bridge Projects Since 2009 o Identify Project Improvements to NBI Deck, Substructure & Superstructure Preliminary Findings o Significant Rehab Projects Appear to Improve the Bridge NBI Ratings o Serious Preservation & Minor Rehab Projects Appear to Maintain the Status Quo o Maintenance & General Preservation Appear to Only Slow the Decline So Worst 1 st Required to Extract Agency From Penalty Situation
41 41
42 TAMP Major Focus Points NHS Pavements & Bridges o Management Systems are now Mandated Asset Management Objectives & Measures Performance Gap Identification Life Cycle Planning Risk Management Analysis A Financial Plan Investment Strategies
43 Planned Methodology for Target Setting Desired State of Good Repair (DSGR) = Current Conditions LADOTD Targets = 10th Year Results (Maybe) o Minimum Condition 5% Poor for Interstate Pavements o Minimum Condition 10% SD by DA for NHS Bridges PM2 Requires 2-Yr and 4-Yr Targets Separately from TAMP MPOs have stated they will use LADOTD Targets for Local NHS Assets o Will Have Reassessment Time After LADOTD Sets Targets 43
44 Performance Gap Identification Asset GAP Analysis (Funding) o For NHS Pavement & Bridge Assets Versus Targets (required) o PM2 = 2 Year & 4 Year FHWA will assess agency progress towards performance targets every two years measuring against biennial reports submitted by the DOT Includes Local NHS o TAMP = 10 Year Versus Steady State (requested) o 10 Year vs Current Condition (DSGR)
45 TAMP Major Focus Points NHS Pavements & Bridges o Management Systems are now Mandated Asset Management Objectives & Measures Performance Gap Identification Life Cycle Planning Risk Management Analysis A Financial Plan Investment Strategies
46 Life Cycle Planning Extends Project LCCA Elements to Network Level Life Cycle Cost o Cost of Managing an Asset from Initial Construction to Replacement Minimum Practical Cost (New Term) o Lowest Feasible Cost to Achieve the Objective
47 Life Cycle Planning Deterioration Model Requirements o Must Identify Deterioration Model(s) used in your TAMP for NHS Pavement & Bridge Assets o Explanation of How the Selected Model(s) Provide Insight into LCP o Why a Certain Type of Management Strategy is the Most Appropriate Strategy Relative Unit Cost Data Requirement Applies only to work types; Initial construction, maintenance, preservation, rehabilitation, and reconstruction
48 TAMP Major Focus Points NHS Pavements & Bridges o Management Systems are now Mandated Asset Management Objectives & Measures Performance Gap Identification Life Cycle Planning Risk Management Analysis A Financial Plan Investment Strategies
49 49

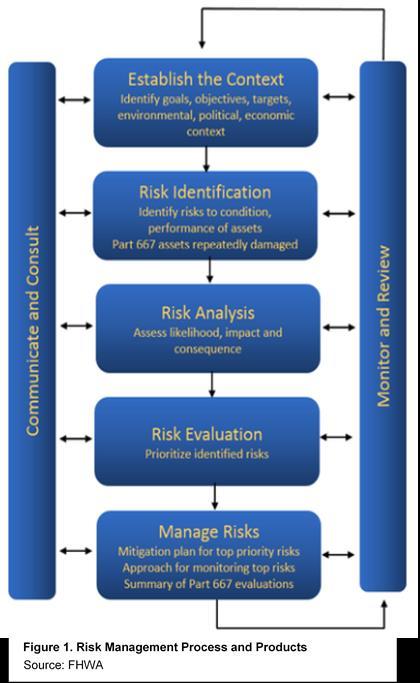
50 Risk Management Levels 50

51 Risk Matrix 51
52 Mitigation Action or Strategy to Manage Risks 2018 Project Level Mitigation Plan Owner(s) Projected Implementation Date First Step 2018 Project Level Monitoring Top Priority Risks Method To Accomplish Frequency Who Performs Status Update Details for FHWA Consistency Determination Details Date 52
53 TAMP Major Focus Points NHS Pavements & Bridges o Management Systems are now Mandated Asset Management Objectives & Measures Performance Gap Identification Life Cycle Planning Risk Management Analysis Financial Plan Investment Strategies
54 Financial Plan & Investment Strategies Move to a Ten (10) Year Financial Plan Refresh Financial Plan Annually Implement Prediction Models (lifecycle cost) Focus on Preservation & Sustainability Modify Investment Strategies As Needed Provide Transparency to Stakeholders Budgetary GAP Analysis Targets Steady State

55 Questions? If you have an opportunity to make things better and you don't, then you are wasting your time on earth. Roberto Clemente Mark Suarez, P.E. Randy Goodman, P.E. Louisiana Department of Transportation & Development (225)