ENG. MUSLEM B. KASHOB MINISTRY OF REGIONAL MUNICIPALITY AND WATER RESOURCES DEPARTMENT OF MATHEMATICAL MODELING MUSCAT, OMAN
|
|
|
- Marsha Gregory
- 5 years ago
- Views:
Transcription


1 Put your Organizati on logo here ENG. MUSLEM B. KASHOB MINISTRY OF REGIONAL MUNICIPALITY AND WATER RESOURCES DEPARTMENT OF MATHEMATICAL MODELING MUSCAT, OMAN
2 Overview Introduction Objectives Study area Geology Hydrology Hydrogeology Methdology Calibration results Conclusion and Recommendation
3 Introduction (GMS) has been initiated to Study the groundwater flow in Hawasinah catchments located at North Batinah Region. In order to build the model, geological, hydrological and hydrogeological data were collected and analyzed. Review previous studies and investigation carried out on the area of the catchment.
4 Cont., Introduction Objective of this study to : Present geology and hydrogeology analysis. Simulate and develop model using The MODFLOW (GMS) to study groundwater system. Description of the model and its calibration. Quantification of recharge to the aquifer system all over the study area. Description of existing groundwater resources. Calculate heads and water budget.
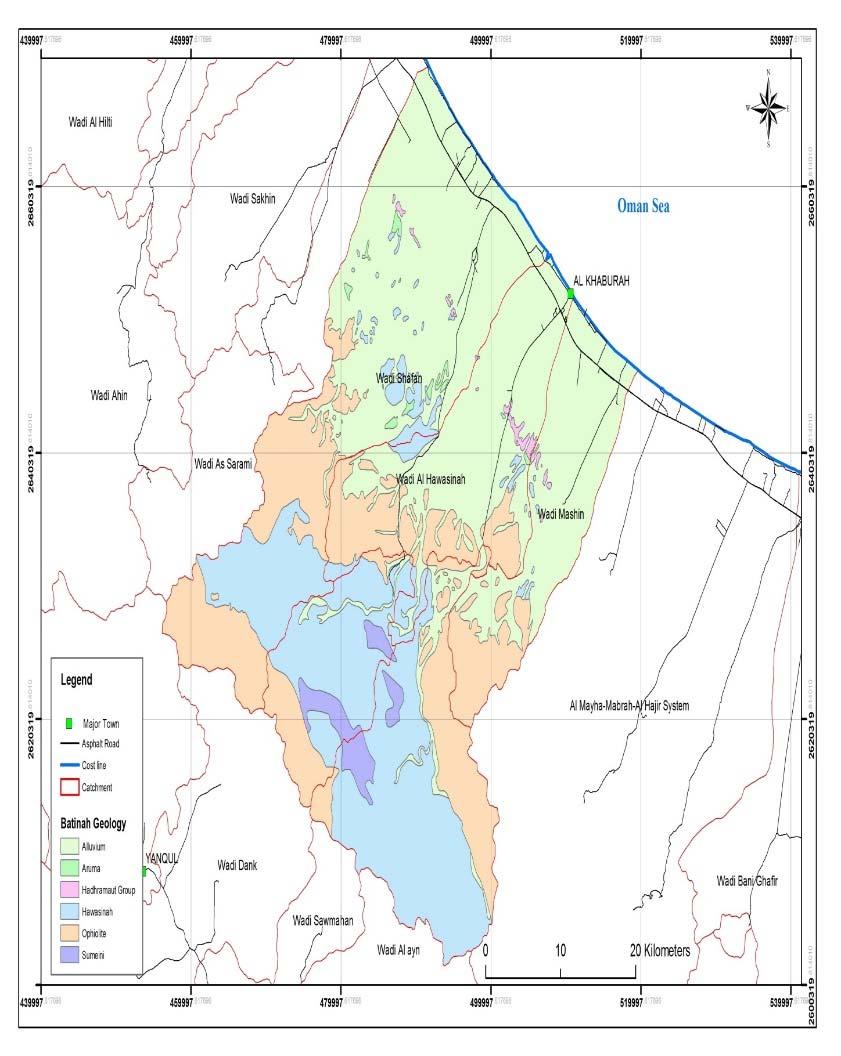
5 Study Area Hawasinah catchment area lies in the north western part of Oman (Fig.1). Three wadi basins which occupy an area of approximately 2,011 km 2. The catchments, Wadis Shafan, Hawasinah and Mashin. The total study area covers approximately 4,483 km 2.

6 STUDY AREA (FIG 1)
7 Literature Review oal Khanbashi.S. (2002) conducted a study to observe the effect of this dam on ground water recharge and quality and the extent of saline water intrusion. odr.m. El Bihery, MRMWR(2010)Carried out a study Integrated Assessment of Groundwater Resources for northern Batinah using (GMS) software.
8 Geology
9 Hydrology Total recharge has been estimated by (MacDonald,2010) for all catchments (Table 1) Catchment MacDonald(2010) Shafan East (lower) 4 Hawasinah North(lower) 11.7 Mashin(lower) 4.7
10 Hydrogeology The study area mainly consists of Tertiary to Quaternary alluvial deposits. Alluvial deposits form the principal aquifer along the Hawasinah coastal plain. poorly sorted mixture of gravel, sand, silt and clay to well sorted fine sand silts near the coast
11 Table 2 Aquifer thickness (GRC2006) Name x Y Elevatio n bot.alluv bgl alluv asl bot.fars bgl fars asl NB NB NB NB NB NB 15T NB
12 Table.3 Estimated K and S parameters (GRC, 2006) Local ID Easting Northing T K S Sy (m 2 /day) (m/day) SH SH x SH , SHTW NB x 10 4
13 Table.4 Aquifer Hydraulic parameters (After MacDonald, 1992) Boreho T K Specific Storage Specific le m 2 /day m/day capacity m 2 /day coefficient yield WS HA HA HA HATW
14 Fig. 3 Composite potentiometric level (October 2005 to June 2006) (After GRC, 2006)
15 Cont., Hydrogeology Major groundwater abstraction was Mm 3 /year withdrawn from alluvium unit in The total amount of recharge to the aquifer is 20.4 Mm 3 /year. total present abstraction is Mm 3 /day. which 93.96Mm 3 /day used for agriculture and M m 3 /day for urban uses.
16 Methodology The Hawasinah catchment alluvium and upper Fars form the main aquifer system for conceptual model Fig 4 The thickness of alluvium generally range from 10 m to 150 m. The thickness of upper fars range from 110 m to 580 m respectively. In this study a pre and a post processor (GMS) is used to interface with MODFLOW. The model has been constructed with a rectangular grid system of 725 m 258 m (UTM WGS 1984, zone 40N) fig 5
17 Fig. 4 Conceptual model No flow boundary Well field Specific head No flow No flow boundary


18 Figure.5 Model Grid Grid Dry area
19 Figure. 6 Cross sectional area Alluvium Upper Fares
20 Figure. 7 Top of aquifer system
21 Figure.8 Bottom of aquifer system
22 Table. 5 the water level measurements done in 1982 Name x y head(m) Mohamed Mosallam AD AS Khawr Al Milh AlKhaldi garage WSI JT MOHAMED SHAMIS
23 Figure.9 Computed Head vs. observed values C o m p u te d 0 Computed vs. Observed Values Head Observed
24 Calibration results The value of K has ranged between 10 m\day and 35 m\day for the alluvium. upper Fars unit attains a value of K 0.9 m/day. Figure. 10 shows that high hydraulic conductivity zones exist in middle area. the low conductivity zones exist along the south western area.
25 Figure.10 Calibrated hydraulic conductivity of alluvium (m/day)
26 Cont., Calibration results The head of Alluvium ranged from 10 m.asl at the southwest of the study area to zero level along the coast (fig 11). The head was above sea level (0.1m) at wadi Mashin southeast of the Al Khabourah town near the coast. calibrated head of upper Fars shows Groundwater flow was thus from southwest to northeast (fig12 ).
27 Cont., Calibration results Hydraulic gradient was almost symmetrical all over the study area. Drying model occurs because of its relatively shallow depth. Its proximity to the most southwest boundary margins of the model.
28 Fig. 11 Calibrated head of alluvium (m)
29 Fig. 12 Calibrated head of upper Fares (m)
30 Cont., Calibration results Inferred flow balance from the steady state model is shown in table6. A localized salt water intrusion of 7.6x 10 5 and 3.15 x 10 6 m 3 /year to the alluvium and upper Fars respectively. Such water intrusion occurs at the two areas listed earlier where groundwater level declined below sea level. An internal flow from alluvium to upper Fars and vice versa. The model estimates it as 2.8 x 10 5 m 3 /year and 3.7 x 10 5 m 3 /year respectively.
31 Table 6 Flow balance for the steady state model( m3\day) Component inflow internal flow outflow inflow from the Gulf (alluvium) 2108 inflow from the Gulf (u. Fars) recharge (alluvium) recharge (u. Fars) flow from alluvium to u. Fars flow from u. Fars to alluvium abstraction (alluvium) abstraction (u. Fars) 0.0 outflow to the Gulf (alluvium) outflow to the Gulf (u. Fars)
32 Conclusion & Recommendations The main source of recharge to the Hawasinah Catchment area is direct recharge from rainfall as well as wadi flow. It is estimated by about 20.4Mm 3 /year from both rainfall, wadi flow plus urban flow. The total amount of current abstraction is about 97.28Mm 3 /year; The hydraulic conductivity attains a moderately wide range from 10 to 35m/day for the alluvium. Its 0.9 for upper Fars.
33 Cont., Conclusion & Recommendations high hydraulic conductivity zones decreased by about 5 m/day along the southwestern side. hydraulic conductivity increased by 5 m/day at the high conductivity zone. This calibration is rather local because most of the data points exist basically in the central area.
34 Cont., Conclusion & Recommendations The Head of water range between 0.3 to 6.5 m. A localized salt water intrusion of 7.5 and 3 Mm 3 /year to the alluvium and upper Fars respectively. The abstraction from wells were 15 Mm3/year.
35 Cont., Conclusion & Recommendations Recommendations More work required for aquifer geometry. Additional data of hydraulic parameters are required. Modeling work needed in the transient state to see the effect of aquifer behavior on the long term.
36 Cont., Conclusion & Recommendations Set prediction development scenarios the effect of abstraction on the groundwater level. Model work on water quality needed to see the effect of development on groundwater quality.
37 Acknowledgments I would to thank ALLAH who helped me in my life and guided me to the right path. And then my thanks go to thank the Ministry of Regional Municipalities and Water Resources. I wish to express my gratitude Director. Salim Al Khanbashi and Dr.Midhet El-Bihery who guide me from the beginning of my study.my thank to training center of the Ministry, GIS section and Water Resources Monitoring Department. All appreciation to my friends, parents, my family brothers and sisters for their patient and understanding me over the year of study.
38 ***Thank you***