A year and a Hurricane Apart: Nutrient Loading in the St. Lucie Estuary in the Summers of 2016 and 2017
|
|
|
- Jasmine Davis
- 5 years ago
- Views:
Transcription

1 A year and a Hurricane Apart: Nutrient Loading in the St. Lucie Estuary in the Summers of 2016 and 2017 Ian Walsh October 3, 2017 / SECOORA Webinar Series This presentation could and would not happen without the expertise and hard work of Dr. Dennis Hanisak and Kristen Davis and their team. They keep IRLON funded and running, and we all benefit. Dennis and Dr. Brian Lapointe contributed their their understanding of the estuary in multiple conversations. Data are presented courtesy of Indian River Lagoon Observatory Network of Environmental Sensors fau.loboviz.com

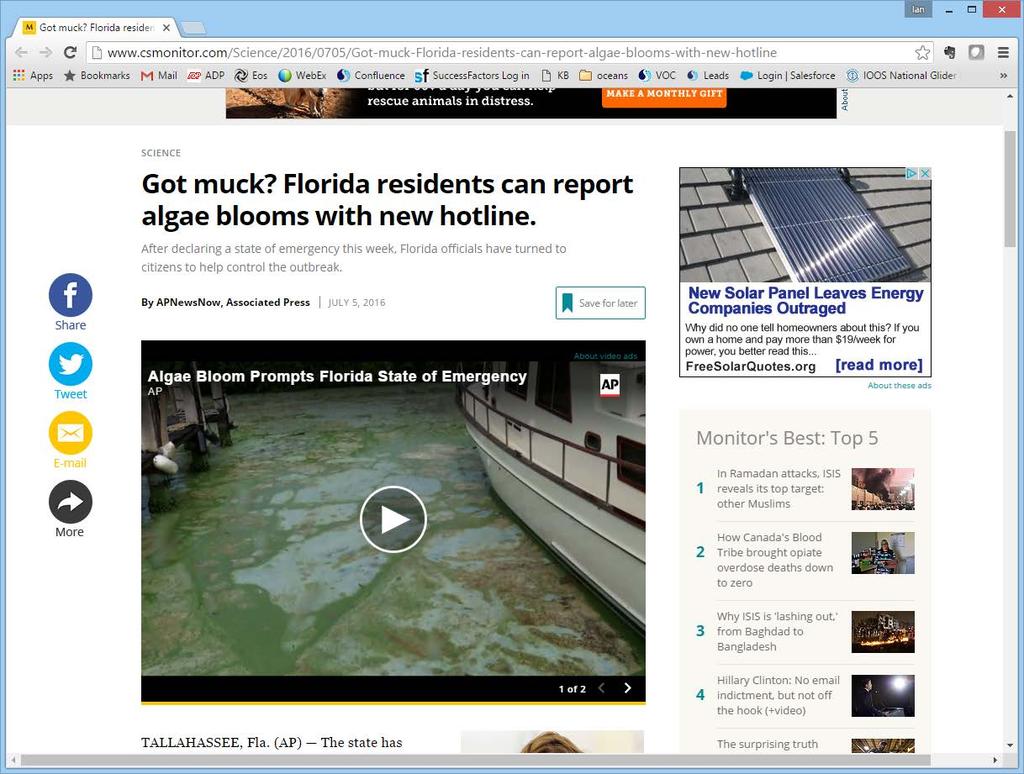
2 2016 Algal Blooms
3 What We Will Cover Today Estuaries and Biogeochemical Processes Sources IRLON sites in the St. Lucie Estuary How I got the data Nutrients in the summer of 2016: Blue green algae bloom Nutrients in the summer of 2017 September 2017: Irma

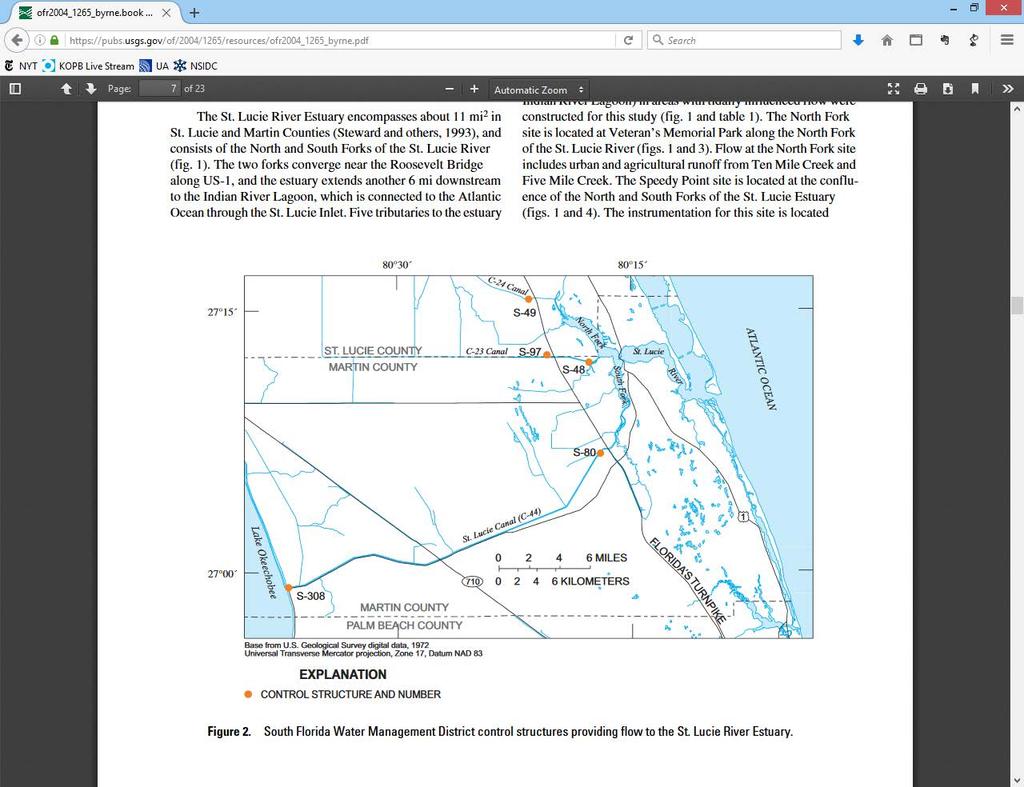
4 IRLON Locations
5 IRLON Locations An Estuary acts like a big mixing tub, with energy and materials supplied by fresh water running down hill and seawater driven by the Moon
6 Structure and Flow NF ME SLE SF SF2
7 Water Flows Down Hill SF2 NF SF ME SLE
8 Water Flows Down Hill SF2 NF SF ME SLE
9 Water Flows Down Hill SF2 NF SF ME SLE Sea Level
10 Water Flows Down Hill SF2 NF SF ME SLE High Tide Sea Level Low Tide
11 Tides and Storms change the gradient SF2 NF SF ME SLE Storm Surge High Tide Low High Tide Sea Level High Low Tide Low Tide
12 Tides and Storms change the gradient SF2 NF SF ME SLE Rainfall Outflow Runoff Storm Surge High Tide Low High Tide Sea Level High Low Tide Low Tide

13 Plants Growth: Light, Nutrients, Time oregon.html Plenty of light in Florida

14 Warm Year Round, Wet Summers

15 The ocean is salty vlfr.fr/bioargo/php/lovbio006b/lovbio006b.html

16 The surface ocean is very low in organics and nutrients vlfr.fr/bioargo/php/lovbio006b/lovbio006b.html
17 Estuary Flow Tracers Fresh Water: Colored Dissolved Organic Matter Decayed organic matter High nutrients Ocean Water Salts: Salinity Low nutrients
18 IRLON Data Access: SECOORA portal.secoora.org

19 IRLON Data Access: SECOORA portal.secoora.org

20 IRLON Data Access: SECOORA Interactive Map
21 IRLON Data Access Fau.loboviz.com

22 IRLON Data Access Fau.loboviz.com
23 LOBOviz: Downloading
24 LOBOviz: Downloading Unclick all but one site Select the data
25 LOBOviz: Downloading Set the time range
26 LOBOviz: Downloading
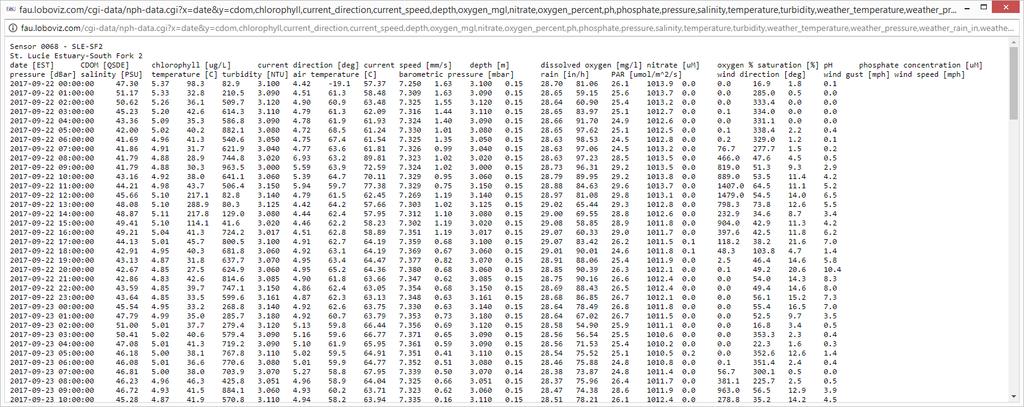
27 LOBOviz: Downloading

28 LOBOviz: Downloading Set the time range Unclick all but one site Select the data
29 2016 Algal Blooms
30 Flow Sources
31 Flow From Lake S- 308 Discharge (ft3/sec) /20 5/27 6/3 6/10 6/17 6/24 7/1 7/8 7/15

32 Three Water Sources Seawater Runoff Other Freshwater Sources Lake Okeechobee
33 Wet January: Runoff Runoff Other Freshwater Sources
34 Low Seawater Input
35 CDOM and Phosphate
36 Estuary Flow Tracers Fresh Water: Colored Dissolved Organic Matter Decayed organic matter High nutrients Ocean Water Salts: Salinity Low nutrients
37 Ocean Nutrient Concentration and Sources Salinity 35 PSU CDOM 10 ppb QSDE Phosphate < 1 um Lake Okeechobee Salinity < 1 PSU CDOM 60 ppb QSDE Phosphate 1 um Runoff Salinity 10 PSU CDOM 100 ppb QSDE Phosphate > 6 um IRLON data during this event confirms previous work

38 Previous Work

39 Previous Work

40 Previous Work
41 Nutrient Loads At the IRLON Sites Phosphate and Nitrate In Situ Data Redfield Ratios: Molar Ratio of Phytoplankton: Single cell plants in water 16 Atoms of Nitrogen (N, NO 3 ) for every atom of Phosphorus (P, PO 4 ) Blue Green Algae tend to out- compete when phosphate (PO 4 ) is abundant
42 Nutrient Dynamics
43 Nutrient Dynamics
44 Nutrient Dynamics
45 Nutrient Dynamics Nutrient Dynamics
46 Curious Spikes at the South Fork LOBO Positive correlations between Salinity CDOM Phosphate
47 Nutrient Dynamics Salinity and Phosphate Coupling
48 Nutrient Dynamics Salinity and Phosphate Coupling
49 Basin Relationships NF x ME SLE SF SF2
50 High Discharge NF x ME SLE SF SF2
51 Low Seawater Input
52 2016 Algal Blooms
53 Recommendations C- 24 Build a fine scale model of the flow around the NF/SF/ME juncture that predicts basin dynamics relative to rainfall and discharge. Consider calculating residence time in the basins as a primary factor n reducing the possibility of HABs. NF x ME Two new LOBO systems to monitor end member inputs. Also consider a LOBO to the north to monitor flow into the lake SLE 308 Consider modulating discharge with alternating periods of high and no flow that delivers water to the north end of the south fork at the start of ebb tide. Monitor the CDOM, PO4 and salinity at SF to assure that estuarine circulation is robust. SF2 SF Add phycocyanin fluorometers to all LOBOs to get early warnings of increases in the Mycrocystis populations.
54 Recommendations C- 24 NF x ME SLE 308 Consider modulating discharge with alternating periods of high and no flow that delivers water to the north end of the south fork at the start of ebb tide. Monitor the CDOM, PO4 and salinity at SF to assure that estuarine circulation is robust. SF2 SF
55 Flow From Lake 2016 S- 308 Discharge (ft3/sec) /20 6/9 6/29 7/19 8/8 8/28 9/17 10/7 10/27 11/16
56 Summary Live data from IRLON drives understanding of the estuary Discharges from Lake Okeechobee alter estuarine circulation Higher freshwater residence time and excess phosphate leads to blooms
57 S- 308 Discharge (ft3/sec) /15 6/4 6/24 7/14 8/3 8/23 9/12 REMARKS - Flow regulated by control structure 308 gates and lock at Lake Okeechobee. Flow frequently reverses during and after periods of heavy rainfall by pumpage into the canal from agricultural lands in the Everglades (negative figures indicate reverse flow towards Lake Okeechobee).
58 June- July 2017 Salinity - CDOM Relationship Salinity (PSU) SF2 SF NF ME SLE CDOM (ppb QSDE)
59 June- July 2017 CDOM - Phosphate Relationship 35 SF2 SF NF ME SLE Phosphate (um) CDOM (ppb QSDE)
60 June- July Phosphate Concentration SF2 SF NF ME SLE Phosphate (um) /25 6/4 6/14 6/24 7/4 7/14 7/24 Date
61 June- July 2016 Phosphate Concentration Phosphate (um) SF2 SF NF ME SLE 5 0 6/4 6/9 6/14 6/19 6/24 6/29 7/4 7/9 7/14 7/19 Date
62 June- July 2017 Salinity - CDOM Relationship Salinity (PSU) SF2 SF NF ME SLE CDOM (ppb QSDE)
63 Summer 2017 Higher nutrient concentrations did not lead to HAB event Residence Time Tidal flushing is more important than nutrient loading
64 S- 308 Discharge (ft3/sec) /15 6/4 6/24 7/14 8/3 8/23 9/12 REMARKS - Flow regulated by control structure 308 gates and lock at Lake Okeechobee. Flow frequently reverses during and after periods of heavy rainfall by pumpage into the canal from agricultural lands in the Everglades (negative figures indicate reverse flow towards Lake Okeechobee).
65 September 2017 Salinity - CDOM Relationship Salinity (PSU) SF2 SF NF ME SLE CDOM (ppb QSDE)
66 September 2017 CDOM - Phosphate Relationship 35 SF2 SF NF ME SLE Phosphate (um) CDOM (ppb QSDE)
67 Last Week
68 June- July 2017
69 Last Week