CATCHMENT AREA TREATMENT PLAN
|
|
|
- Aron Albert Houston
- 5 years ago
- Views:
Transcription
1 CATCHMENT AREA TREATMENT PLAN 1 NEED FOR CATCHMENT AREA TREATMENT It is a wellestablished fact that reservoirs formed by dams on rivers are subjected to sedimentation. The process of sedimentation embodies the sequential processes of erosion, entrainment, transportation, deposition and compaction of sediment. The study of erosion and sediment yield from catchments is of utmost importance as the deposition of sediment in reservoir reduces its capacity, and thus affecting the water availability for the designated use. The eroded sediment from catchment when deposited on streambeds and banks causes braiding of river reach. The removal of top fertile soil from catchment adversely affects the agricultural production. Thus, a welldesigned Catchment Area Treatment (CAT) Plan is essential to ameliorate the abovementioned adverse process of soil erosion. Soil erosion may be defined as the detachment and transportation of soil. Water is the major agent responsible for this erosion. In many locations, winds, glaciers, etc. also cause soil erosion. In a hilly catchment area as in the present case erosion due to water is a common phenomenon and the same has been studied as a part of the Catchment Area Treatment (CAT) Plan. The Catchment Area Treatment (CAT) plan highlights the management techniques to control erosion in the catchment area. Life span of a reservoir in case of a seasonal storage dams is greatly reduced due to erosion in the catchment area. The catchment area considered for treatment of Lower Orr Irrigation project is 1843 sq.km. The subwatersheds in the catchment area of considered for the present study is given in Figure1. In the present study `Silt Yield Index (SYI), method has been used. In this method, the terrain is subdivided into various watersheds and the erodibility is determined on relative basis. SYI provides a comparative erodibility criteria of catchment (low, moderate, high, etc.) and do not provide the absolute silt yield. SYI 1
2 method is widely used mainly because of the fact that it is easy to use and has lesser data requirement. Moreover, it can be applied to larger areas like subwatersheds, etc. 2
3 Figure.1: Drainage Map for Lower Orr Irrigation Project 2 APPROACH FOR THE STUDY Various thematic maps have been used in preparation of the CAT plan. Due to the spatial variability of site parameters such as soils, topography, land use and rainfall, not all areas contribute equally to the erosion problem. Several techniques like manual overlay of spatially indexmapped data have been used to estimate soil erosion in complex landscapes. Geographic Information System (GIS) is a computerized resource data base system, which is referenced to some geographic coordinate system. In the present study, real coordinate system has been used. The GIS is a tool to store, analyze and display various spatial data. In addition, GIS because of its special hardware and software characteristics, has a capacity to perform numerous functions and operations on the various spatial data layers residing in the database. GIS provides the capability to analyze large amounts of data in relation to a set of established criteria. In order to ensure that latest and accurate data is used for the analysis, satellite data has been used for deriving land use data and ground truth studies too have been conducted. The various steps covered in the study are as follows: Data acquisition Data preparation Output presentation The above mentioned steps are briefly described in the following paragraphs. 3
4 2.1 Data Acquisition The requirement of the study was first defined and the outputs expected were noted. The various data layers of the catchment area used for the study are as follows: Soil Map Land use Classification Map Current Management Practices Catchment Area Map. 2.2 Data Preparation The data available from various sources was collected. The ground maps, contour information, etc. were scanned, digitized and registered as per the requirement. Data was prepared depending on the level of accuracy required and any corrections required were made. All the layers were georeferenced and brought to a common scale (real coordinates), so that overlay could be performed. A computer programme was used to estimate the soil loss. The formats of outputs from each layer were firmed up to match the formats of inputs in the program. The grid size to be used was also decided to match the level of accuracy required, the data availability and the software and time limitations. The format of output was finalized. Ground truthing and data collection was also included in the procedure. For the present study landsat, path 145 row 045 digital satellite data was used for interpretation & classification. The classified land use map of the catchment area is shown in Figure2. The land use pattern of the catchment area is summarized in Table1. 4
5 Table13.1: Landuse pattern of the catchment area Category Open Vegetation Forest cover Scrub Agricultural Land River/ Water body Settlements Total Area (ha) Percentage Digitized contours from toposheets were used for preparation of Digital Elevation Model (DEM) of the catchment area and to prepare a slope map. The first step in generation of slope map is to create surface using the elevation values stored in the form of contours or points. After marking the catchment area, all the contours on the toposheet were digitized (100 m interval). The output of the digitization procedure was the contours as well as points contours in form of x, y & z points. (x, y location and their elevation). All this information was in real world coordinates (latitude, longitude and height in meters above sea level). A Digital Terrain Model (DTM) of the area was then prepared, which was used to derive a slope map. Various layers thus prepared were used for Modeling. Software was prepared to calculate the soil loss using input from all the layers. 2.3 Output Presentation The result of the modeling was interpreted in pictorial form to identify the areas with high soil erosion rates. The primary and secondary data collected as a part of the field studies were used as an input for the model. 5
6 Figure.2 Classified Imagery of the Lower Orr Irrigation Project 3. ESTIMATION OF SOIL LOSS USING SILT YIELD INDEX (SYI) METHOD The Silt Yield Index Model (SYI), considering sedimentation as product of erosivity, erodibility and arial extent was conceptualized in the All India Soil and Land Use Survey (AISLUS) as early as 1969 and has been in operational use since then to meet the requirements of prioritization of smaller hydrologic units. The erosivity determinants are the climatic factors and soil and land attributes that have direct or reciprocal bearing on the unit of the detached soil material. The relationship can be expressed as: Soil erosivity = f (Climate, physiography, slope, soil parameters, land use/land cover, soil management) Silt Yield Index The Silt Yield Index (SYI) is defined as the Yield per unit area and SYI value for hydrologic unit is obtained by taking the weighted arithmetic mean over the entire area of the hydrologic unit by using suitable empirical equation. Prioritization of Watersheds/Subwatersheds: The prioritization of smaller hydrologic units within the vast catchments are based on the Silt Yield Indices (SYI) of the smaller units. The boundary values or range of SYI values for different priority categories are arrived at by studying the frequency distribution of SYI values and locating the suitable breaking points. The watersheds/ subwatersheds are subsequently rated into various categories corresponding to their respective SYI values. 6
7 The application of SYI model for prioritization of sub watersheds in the catchment areas involves the evaluation of: a) b) c) d) Climatic factors comprising total precipitation, its frequency and intensity, Geomorphic factors comprising land forms, physiography, slope and drainage characteristics, Surface cover factors governing the flow hydraulics and Management factors. The data on climatic factors can be obtained for different locations in the catchment area from the meteorological stations whereas the field investigations are required for estimating the other attributes. The various steps involved in the application of model are: Preparation of a framework of subwatersheds through systematic delineation Rapid reconnaissance surveys on 1:50,000 scale leading to the generation of a map indicating erosionintensity mapping units. Assignment of weightage values to various mapping units based on relative siltyield potential. Computing Silt Yield Index for individual watersheds/sub watersheds. Grading of watersheds/sub watersheds into very high, high medium, low and very low priority categories. The area of each of the mapping units is computed and silt yield indices of individual sub watersheds are calculated using the following equations: a. Silt Yield Index SYI = (Ai x Wi ) x 100 ; Aw Where Ai = Wi = n = Aw = where i = 1 to n Area of the unit (EIMU) Weightage value of the mapping unit No. of mapping units Total area of subwatershed. The SYI values for classification of various categories of erosion intensity rates are given in Table2. 7
8 Table2: Criteria for erosion intensity rate Priority categories Very high Medium Low Very Low 13.4 SYI Values > <1000 WATERSHED MANAGEMENT AVAILABLE TECHNIQUES Watershed management is the optimal use of soil and water resources within a given geographical area so as to enable sustainable production. It implies changes in land use, vegetative cover, and other structural and nonstructural action that are taken in a watershed to achieve specific watershed management objectives. The overall objectives of watershed management programme are to: increase infiltration into soil; control excessive runoff; Manage & utilize runoff for useful purpose. Following Engineering and Biological measures have been suggested for the catchment area treatment. 1. Engineering measures 2. Nallah Bunding Contour Bunding Angle iron barbed wire fencing Biological measures Development of nurseries Plantation/afforestation Pasture development Social forestry The basis of site selection for different biological and engineering treatment measures under CAT are given in Table3. Table3: Basis for selection of catchment area treatment measures Treatment measure Basis for selection Social forestry, fuel wood and Near settlements to control tree felling fodder grass development 8
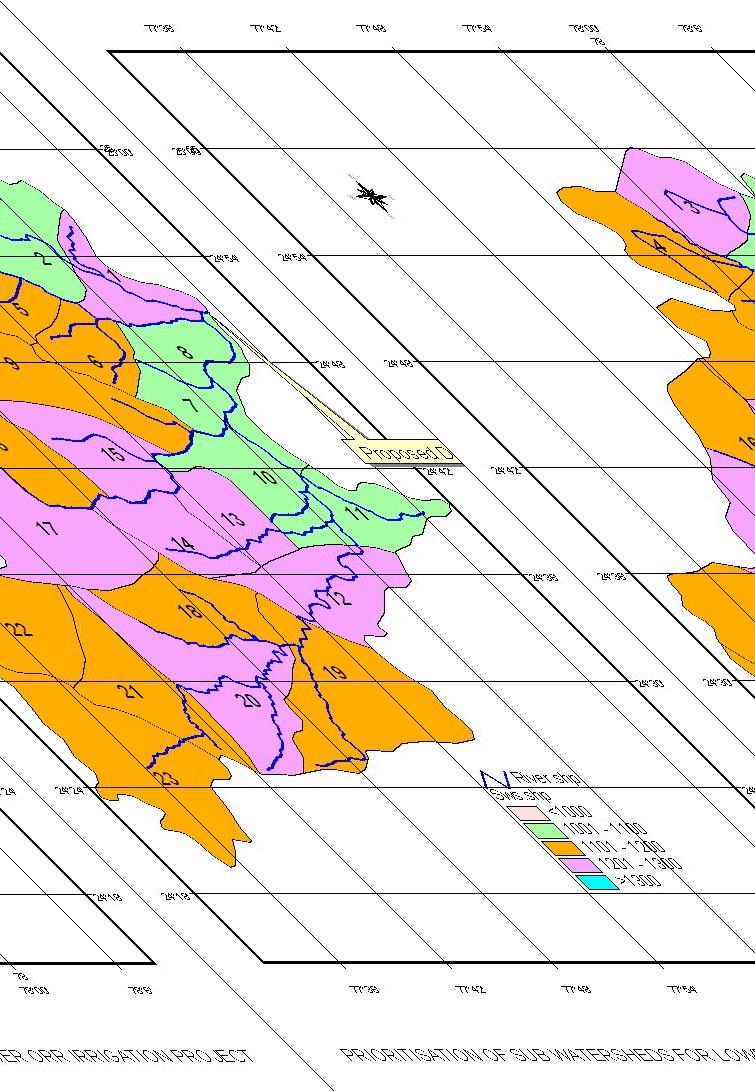
9 Contour Bunding Pasture Development Afforestation Control of soil erosion from agricultural fields. Open canopy, barren land, degraded surface Open canopy, degraded surface, high soil erosion, gentle to moderate slope In the vicinity of afforestation work to protect it from grazing etc. Nala bunding work consists of constructing bunds of suitable dimensions across the nala or gullies to hold the maximum runoff water to create flooding of the upstream area temporarily for some days or weeks, with surplusing arrangements at suitable intervals to drain the water. Centrally located points for better supervision of proposed afforestation, minimize cost of transportation of seedling and ensure better survival. Barbed wire fencing Nallah Bunding Nursery 5 CATCHMENT AREA TREATMENT MEASURES The erosion category of subwatersheds in the catchment area as per a SYI index is given in Table4. The details are shown in Figure3. The area under different erosion categories are given in Table5. Table4: Erosion intensity categorization as per SYI classification Watershed number W1 W2 W3 W4 W5 W6 W7 W8 W9 W10 W11 W12 W13 W14 W15 W16 W17 W18 W19 W20 Area SYI values Category Low Medium Medium Medium Low Low Medium Low Low Medium Medium
10 W21 W22 W23 Total Medium 1160 Medium 1170 Medium Table5: Area under different erosion categories Category Low Medium Total Area (ha) Percentage
11 12
12 Figure3: Prioritisation of Sub Watersheds for Lowe Orr Irrigation Project The objective of the SYI method is to prioritize subwatershed in a catchment area for treatment. The total area under high erosion category in various dams is to be treated as a part of the project cost. The various measures suggested for catchment area treatment are depicted in Figure4. 13
13 14
14 Figure4: Catchment Area Treatment Measures for Lower Orr Irrigation Project 6 COST ESTIMATES FOR CAT PLAN 6.1 Biological Treatment Measures The cost required for Biological Treatment Measures is Rs million. The details are given in Table 6. Table6: Cost estimate for Catchment Area Treatment of Lowe Orr Irrigation Project Biological Measures S. No. Item Rate/unit (Rs.) (including maintenance cost) Target Physical Gap Plantation Pasture Development Social forestry Nursery development Maintenance of nursery Barbed wire fencing Watch and ward for 3 years for 30 persons Total 45,000/ha 15,000/ha 70,000/ha 3,00,000/no. 2,70,000/no no 25 no. 100,000/km 5000/ manmonth 30 km 1080 man months Financial (Rs. million) Forest Protection An amount of Rs million has been earmarked for implementation of various Forest Protection measures. The details are given in Table7. Table7: Cost summary for Forest Protection measures S. No. 1 Component/Item No. Unit Rate (Rs. million) Fire protection 15 Total Cost (Rs. million) 4.0
15 measures Distribution of Nonconventional Energy and Fuel Saving Devices in catchment area on a costsharing basis, such as, LPG, Pressure cookers and Solar devices Total Lumpsum Silt Observation Site A silt observation site for regular monitoring of silt load coming in river has been suggested. This would ensure monitoring efficacy of implementation various treatments measures suggested as in CAT plan. Monitoring would be undertaken for a period of 10 years including 5 years for CAT plan implementation period. An amount of Rs million has been earmarked for this purpose. The details are given in Table8. Table8: Cost earmarked for establishing Silt Observation points S. No Parameter Cost (Rs. million) Cost of one laboratory 0.5 One observation hut at each site 0.5 Cost for hiring services one person at (Average 1.91 salary Rs 10,000/ for next 10 years) considering 10% escalation per year Total 2.91 Engineering Treatment Measures The cost required for Engineering Treatment Measures is Rs million. The details are given in Table 9. Table9: Cost estimate for Catchment Area Treatment of Lower Orr Irrigation Project Engineering Measures S. No. Item Rate (Rs.) Unit Physical 1. Contour Bunding 15000/ha ha Target Financial (Rs. million) 45.0
16 2. Nallah Bunding Total (B) ,000 No. 30 No Monitoring and Evaluation Monitoring and evaluation is very essential for the various types of activities in CAT plan on daily, monthly and annual basis for proper execution of planned works. M & E studies including impact evaluation studies should be scheduled for the later years of the CAT Plan implementation calendar. Indicators for Monitoring impact of CAT Plan would include: Change in silt load. Survival of plantations Changes in landuse [private holdings] Changes in mananimal conflicts. Trend of fire incidences in vulnerable areas. An amount of Rs million has been earmarked for Monitoring and Evaluation. 7. COST ESTIMATE The cost required for implementation of various measures is Rs million. The details are given in Table 10. Table10: Cost earmarked for implementation of CAT plan S.No Activity Biological Treatment Measures Forest Protection measures Silt observation Engineering Treatment Measures Monitoring and Evaluation Total 16 Amount (Rs. million) , say, Rs million