Appendix H State Route 52 Corridor Study
|
|
|
- Peregrine Butler
- 5 years ago
- Views:
Transcription
1 Appendix H State Route 52 Corridor Study City of Santee Mobility Element Draft Program Environmental Impact Report July 2017


2
3 THIS PAGE INTENTIONALLY LEFT BLANK
4 State Route 52 Corridor Study Prepared for: City of Santee Prepared by: WSP Parsons Brinckerhoff
5 State Route 52 Corridor Study Acknowledgements State Route (SR) 52 Corridor Study Technical Working Group (TWG) California Department of Transportation (Caltrans) District 11 City of El Cajon City of La Mesa City of San Diego City of Santee HomeFed Corporation San Diego Association of Governments (SANDAG) San Diego Metropolitan Transit System (MTS) City of Santee Staff Minjie Mei, Principal Traffic Engineer SANDAG Staff Rachel Kennedy, Senior Regional Planner Elisa Arias, Principal Regional Planner Mike Calandra, Senior Transportation Modeler Limeng Yu, Associate Transportation Modeler Caltrans District 11 Staff Chris Schmidt, Branch Chief, Multimodal Planning Jacob Armstrong, Development Review Branch Chief Maurice Eaton, Chief, Travel Modeling and Forecasting Branch HomeFed Corporation Jeff O Connor John P. Keating (LLG Traffic Engineer)
6 Consultant Team WSP Parsons Brinckerhoff Joe De La Garza Seth Torma Lorraine Ahlquist Melissa Estrada Miriam Wai-Kwan Jim Nirupa Kannan Rex Plummer Ali Seyedmadani Chris Wahl MJE Marketing Kristen Byrne James McIntosh
7 Table of Contents EXECUTIVE SUMMARY... ES-1 TECHNICAL WORKING GROUP... TWG INTRODUCTION Purpose Background Existing and Future Traffic Volumes Existing Land Use Planned Projects Problem Statement ALTERNATIVES DEVELOPMENT Study Corridor Multi-Modal Improvements Roadway Improvements Transit Improvements Active Transportation Improvements Transportation Demand Management Improvements Future Considerations Alternatives No- Alternative Alternatives Alternative 1 (Operational) Alternative 2 (Ultimate) Alternative 3 (Minimal) Alternative 4 (Shoulder Running) TECHNICAL STUDIES Traffic Analysis Traffic Volume Development Existing Traffic Volumes Future Volumes (Traffic Forecasting) Traffic Analysis Methodology Intersection Analysis Roadway Analysis Freeway Operations Analyses (Using Microsimulation) Existing Conditions Freeway Intersections Roadways Engineering Feasibility Basis for the Analysis/Methodology Alternatives Planning Level Cost Estimates Environmental Constraints Anticipated Environmental Approvals i
8 Environmental Technical Studies Biology Section 4(f) Evaluation Cultural Resources Hazardous Waste Visual Resources Water Quality Noise Air Quality Anticipated Permits ALTERNATIVES EVALUATION Methodology Screening Analysis Consistency with the Regional Plan Near Term Implementation Environmental Impacts Capital Costs Vehicle Miles Traveled Person Throughput Reliability Mode Share Improvements to Transit and HOV Mobility Congestion Relief Summary of Results PUBLIC OUTREACH Summary of Efforts Webpage and Social Media Public Workshops Summary of Comments FUNDING STRATEGIES Tolling Analysis Methodology Traffic Forecasts Toll Fees Toll Revenue Calculations Toll Revenue Adjustments Estimated Adjusted Net Toll Revenue Bonding Capacity Estimate Potential Funding Sources Local Revenues State Revenues Federal Revenues NEXT STEPS Caltrans Project Development Process ii
9 7.2 Project Delivery Methods Project Phasing Strategies Phasing by Segment Phasing by Improvement Hybrid Approach to Phasing CONCLUSION List of Figures Figure 1-1. Communities along SR Figure 2-1. Study Corridor Figure 2-2. Alternative 1 (Operational) Figure 2-3. Alternative 2 (Ultimate) Figure 2-4. Alternative 3 (Minimal) Figure 2-5. Alternative 4 (Shoulder Running) Figure 3-1. Aimsun Study Area Intersections Figure 3-2. Simulation Modeling Process Figure 3-3. Microsimulation Study Area Network Figure 4-1. Capital Costs Figure 4-2. Regional VMT, 2035 No Figure 4-3. Project VMT, Figure 4-4. Person Throughput, Figure 4-5. Regional Trips by Mode, Figure 4-6. Mode Shifts, Compared to No- Alternative Figure 4-7. Freeway under Capacity, Figure 4-8. Daily Hours of Congested Conditions, Figure 4-9. Daily Minutes of Congested Conditions, Figure 5-1. Daily Webpage Comment Tool Figure 5-2. Public Workshops Figure 5-3. Number of Comments by Topic Figure 5-4. Percent of Comments by Topic Figure 6-1. Estimated Toll Revenue: Managed Lanes (2016$) Figure 6-2. Estimated Toll Revenue: Toll Road (2016$) Figure 6-3. Estimated Toll Revenue: Managed Lane I-805 to I-15 Segment (2016$) Figure 6-4. Estimated Toll Revenue: Managed Lane I-15 to SR 125 Segment (2016$) Figure 6-5. Estimated Toll Revenue: Toll Road I-805 to I-15 Segment (2016$) Figure 6-6. Estimated Toll Revenue: Toll Road I-15 to SR 125 Segment (2016$) Figure 7-1. Caltrans Project Development Process iii
10 List of Tables Table 1-1. Traffic along SR Table 2-1. Multi-modal Improvements/Alternatives for State Route Table 3-1. Existing Freeway Conditions: AM Peak Average Travel Times Table 3-2. Existing Freeway Conditions: PM Peak Average Travel Times Table 3-3. Existing Intersection Conditions Table 3-4. Existing Roadway Conditions Table 3-5. Planning Level Capital Cost Estimate (2016$) for Alternative Table 3-6. Planning Level Capital Cost Estimate (2016$) for Alternative 1 with Re-Stripe and Hanging Bike Bridge Option Table 3-7. Planning Level Capital Cost Estimate (2016$) for Alternative Table 3-8. Planning Level Capital Cost Estimate (2016$) for Alternative Table 3-9. Planning Level Capital Cost Estimate (2016$) for Alternative 3 with Hanging Bike Bridge Option Table Planning Level Capital Cost Estimate (2016$) for Alternative Table Planning Level Capital Cost Estimate (2016$) for MM Improvements Table 4-1. AM Peak Travel Time: WB SR 52, WB Mast Blvd, and NB I Table 4-2. PM Peak Travel Time: EB SR Table 4-3. Person-Hours of Delay Saved Table 4-4. Summary of Arterial Roadway V/C Ratios, Table 4-5. Summary of Arterial Roadway V/C Ratios, Table 4-6. Screening Results: Alternatives Compared to No- Alternative Table 6-1. SR 52 Ultimate Project Funding Required Table 6-2. Toll Operations & Maintenance Costs (2016$) Table 6-3. Estimated Toll Revenue, 2025 to 2050 (2016$) Table 6-4. Estimated Total Toll Revenue Range, 2025 to 2050 (2016$) Appendices Appendix A: Traffic Analysis (Aimsun Anaylsis Results, Synchro Analysis Results, Existing Travel Time, Peak Hour Volume Adjustments Related to West Hills High School) Appendix B: SR52 Mini-PEAR Appendix C: SR52 Toll Revenue Calculations (Toll Revenue, Bonding Calculations) Appendix D: San Diego Forward: the Regional Plan Appendix A Excerpt Appendix E: SR52 Public Outreach Appendix F: SR52 Existing Peak Hour Intersection Counts (Existing Counts) Appendix G: SR52 Caltrans Review Comment Letter iv
11 THIS PAGE INTENTIONALLY LEFT BLANK v
12 Executive Summary EXECUTIVE SUMMARY The SR 52 Corridor Study identifies and evaluates short-term (5 to 15 years) and lowcost improvements for SR 52, between Interstate (I-) 805 and SR 67, that would improve safety, efficiency, reliability, and accessibility, while reducing congestion and providing flexibility. The City of Santee initiated the study, as existing traffic conditions on SR 52 directly affect the city, with input and support provided by the TWG comprised of the Cities of El Cajon, La Mesa, Santee, and San Diego, Caltrans, HomeFed Corporation (Fanita Ranch), SANDAG, and MTS. SR 52 is an east-west freeway located in San Diego County that traverses various City of San Diego communities and the City of Santee, connecting East County to employment centers in west and north San Diego County, similar to I-8. It also connects to I-5, I-805, SR 163, I-15, and SR 67. The current SANDAG regional transportation plan, San Diego Forward: The Regional Plan (the Regional Plan) (SANDAG, 2015), includes improvements on SR 52, specifically the addition of two managed lanes (MLs) and freeway-to-freeway ML connectors by the year This study is an attempt to find interim solutions before the implementation of improvements by Caltrans and SANDAG. The study developed multi-modal (MM) improvement alternatives, including roadway, transit, active transportation (AT), and transportation demand management (TDM). The study developed and evaluated four build alternatives, which included a mix of general purpose (GP) lanes, auxiliary (AUX) lanes, and truck climbing (TC) lanes, as well as the ML improvements listed in the Regional Plan. The study provided a traffic analysis, assessed engineering feasibility, and examined potential environmental constraints for the build alternatives. A preliminary capital cost estimate was developed for the four build alternatives, shown in the table below. The study also identified potential anticipated environmental approvals, technical studies, and permits for the project. Planning Level Capital Cost Estimate (2016$) Alternatives*** Description Capital Cost 2016$ (Millions) Alternative 1 Construct AUX lanes (three areas), a TC lane, and GP lanes $149/$47 Alternative2* Alternative 3 Construct AUX lanes (three areas), a TC lane, GP lanes, MLs, and freeway-to-freeway ML connectors Construct a TC lane (two options-with hanging bike lane/bridge widening) $763** $30/$34 (two options) Alternative 4 Construct a TC lane and shoulder running lanes $69 * This alternative was included to assess the use of tolling to advance the ML improvements in the Regional Plan. ** Partial funding (for the ML improvements) has been identified in the Regional Plan. *** Excludes the $20 million (2016$) for non-roadway MM improvements. ES-1
13 Executive Summary Screening criteria were developed based on the purpose of and issues identified for the study corridor, and in consideration of criteria developed by SANDAG to support the visions and goals of the Regional Plan. Screening criteria included: Consistency with the Regional Plan, Near Term Implementation, Environmental Impacts, Capital Costs, Vehicle Miles Traveled, Person Throughput, Reliability, Mode Share, Improvements to Transit and High-Occupancy Vehicle (HOV) Mobility, and Congestion Relief. The build alternatives were evaluated against the No- Alternative using the screening criteria. Screening Results: Alternatives Compared to No- Alternative Criterion Alternative 1 Alternative 2 Alternative 3 Alternative 4 1 Consistency with the Regional Plan 2 Near Term Implementation 3 Environmental Impacts 4 Capital Costs 5 VMT 6 Person Throughput 7 Reliability 8 Mode Share 9 Improvements to Transit and HOV Mobility 10 Congestion Relief Better No Change Worse than No- from No- than No- The study provided a tolling analysis to assess toll revenue that could be generated through the implementation of MLs or a toll only option for the two added travel lanes. Based on the analysis, the ML option could generate revenues of up to $187 million and the toll only option could generate up to $254 million. These amounts would be bonded against and based on typical bond rates and terms this could result in $132 million and $179 million respectively. They could be part of a capital funding strategy to advance implementation of Alternative 2 prior to As part of the study, public outreach was conducted to provide and gather information about the corridor and the alternatives. This included two open house style public ES-2
14 Executive Summary meetings, a presentation, and a public comment period that included an online comment tool. A range of comments were received, most concerning freeway capacity. The study is an initial step in implementing the SR 52 Corridor Project and demonstrates that any of the improvements/alternatives would improve existing and future conditions prior to The study was conducted with the understanding that implementation of the improvements depends upon available funding. For the next study or project report, the build alternatives for the SR 52 Corridor Project could be broadened or narrowed, by revising, repackaging, or phasing the MM improvements. ES-3
15 Executive Summary THIS PAGE INTENTIONALLY LEFT BLANK ES-4
16 Technical Working Group TECHNICAL WORKING GROUP For the SR 52 Corridor Study, a TWG was formed. The TWG met monthly to discuss, guide, and ultimately provide support for the study. The steps and milestones of the study were reviewed and commented on by the TWG. The TWG played a key role in the development of the proposed improvements. The key stakeholders of the TWG included: City of Santee City of El Cajon City of La Mesa City of San Diego Caltrans HomeFed Corporation SANDAG MTS The effort and contributions of the TWG are greatly appreciated and hereby acknowledged. TWG-1
17 Technical Working Group THIS PAGE INTENTIONALLY LEFT BLANK TWG-2
18 Chapter 1.0 Introduction 1.0 INTRODUCTION This chapter presents the purpose of the study and provides background on SR Purpose The purpose of this study is to identify short-term and low-cost improvements for SR 52, to improve safety, efficiency, reliability, and accessibility, while reducing congestion and providing flexibility. The City of Santee initiated the study, as existing traffic conditions on SR 52 directly affect the city, with input and support provided by the TWG comprised of the Cities of El Cajon, La Mesa, Santee, and San Diego, Caltrans, HomeFed Corporation, SANDAG, and MTS. However, these traffic impacts affect more than the City of Santee; therefore, a comprehensive study is needed to identify feasible solutions for SR 52. Additionally, the City of Santee recognizes opportunities to enhance the city by developing undeveloped parcels and redeveloping underutilized parcels. To attract investment in the city, enhance property values, and improve the overall quality of life, the traffic problem on SR 52 must be relieved. Moreover, SANDAG s growth forecasts show substantial growth in East County, with increasing traffic demand for the SR 52 Corridor. To this end, HomeFed is partnering with the City of Santee and others to identify and fund potential improvements for the public good. 1.2 Background SR 52, an east-west freeway, is located in the Mid-City and East County areas of San Diego County, traversing the City of San Diego in the west and the City of Santee in the east. SR 52 connects to the following north-south freeways: I-5, I-805, SR 163, I-15, SR 125, and SR 67. SR 52 is approximately 17 miles in length, and generally is comprised of four to six general purpose lanes, with AUX lanes at certain locations to facilitate traffic entering and exiting the freeway. Between Mast Boulevard and Santo Road, the westbound SR 52 shoulder includes a two-way bike path. The primary purpose of SR 52 is to provide mobility to/from East County. I-8, which is located south of SR 52, serves East County and is heavily traveled as well. Existing and Future Traffic Volumes SR 52 currently operates at Level of Service (LOS) C to E, with heavy congestion between I-15 and Mast Boulevard during the PM eastbound commute, and between Cuyamaca Street and the summit during the AM westbound commute. If additional improvements are not made, the condition is forecast to worsen to LOS F in the future. Under existing conditions, SR 52 experiences a directional split during the AM and PM peak hours (i.e., 7:00 to 9:00 a.m. and 4:00 to 6:00 p.m.). The directional split in the AM peak is generally consistent throughout the corridor, with between 65 and 74% of the 1-1
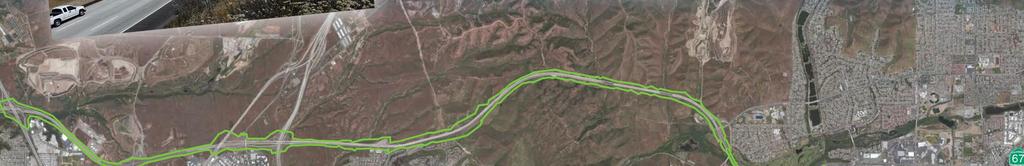
19 Chapter 1.0 Introduction total traffic moving in the westbound direction. The directional split in the PM peak is more evident in the central and eastern portions of the corridor, with 68% of all traffic heading eastbound between I-15 and SR-67. The PM directional split is less distinct on the western end of the corridor, where between 41 and 51% of all traffic is in the eastbound direction between I-805 and I-15. The bottlenecks for eastbound are: west of I-15 (1.4-mile queue), Santo Road (1.6-mile queue), and Mast Boulevard (2-mile queue). A westbound SR 52 bottleneck exists east of Mast Boulevard, where five lanes merge to 2 lanes with a 2.5 mile queue in the AM. Existing (2010) and forecast (2040) traffic along SR 52 is shown in Table 1-1. As shown in the table, future growth forecasts show an increase in traffic along SR 52 by 74% between Mast Boulevard and SR125 and by 30% between I-5 and I-805. Additionally, since 2010, traffic between I-805 and I-15 as well as between Mast Boulevard and I-15 has increased by 10 and 24%, respectively. Table 1-1. Traffic Volumes along SR 52 I-5 to I-805 I-805 to I-15 I-15 to Mast Blvd Mast Blvd to SR 125 SR 125 to SR 67 AADT 2010: Total 2040: GP Lanes 2040: MLs 2040: Total 92, ,100 96,500 85,300 72, , , , , ,300 N/A 13,500 19,000 13,900 N/A 120, , , , ,300 AADTT 2010: Total 2040: Total 3,000 3,800 3,000 2,200 1,900 4,000 6,000 4,400 3,400 3,300 Source: State Route 52 Transportation Concept Report (Caltrans, 2015) Note: AADT = annual average daily traffic, AADTT = annual average daily truck traffic Existing Land Use SR 52 traverses diverse communities (i.e., various City of San Diego communities and the City of Santee), shown in Figure 1-1, which contain various land uses. These land uses are significant, as they determine travel patterns. SR 52 begins just west of I-5, south of the University City community and north of the Clairemont Mesa community, in San Clemente Canyon. The University City community, also known as the Golden Triangle, is a dense population and employment center that 1-2

20 Chapter 1.0 Introduction includes the University of California San Diego, regional shopping centers, regional hospitals, research centers, and corporate headquarters. In the Clairemont Mesa community, the predominant land use is residential and commercial. At I-805, SR 52 exits San Clemente Canyon and travels past both SR 163 and I-15, along the southern edge of Marine Corps Air Station (MCAS) Miramar and north of the Kearny Mesa and Tierrasanta communities. MCAS Miramar is an approximate 23,000- acre military base and airfield where people work and live. The Kearny Mesa community functions as an industrially based employment center, with office and industrial uses, but also includes Montgomery Field (an airfield) and limited residential uses. The Tierrasanta community is comprised of residential uses and Mission Trails Regional Park (an open space park that covers approximately one-half of the community), with some commercial and light industrial uses. East of I-15, SR 52 ascends the Mission Trails Summit (1,194 feet) north of the summit of Fortuna Mountain in Mission Trails Regional Park, and then descends past the East Elliott community towards the City of Santee. The East Elliott community, which includes the SR 52 crossing of the San Diego River, mostly is designated for long-term open space use. The City of Santee features residential and commercial uses, is bisected by the San Diego River, and contains a large percentage of undeveloped land. Additionally, SR 52 serves two landfills. The Miramar Landfill is located north of SR 52 between I-805 and SR 163. The Sycamore Landfill is located north of SR 52 at Mast Boulevard. Figure 1-1. Communities along SR
21 Chapter 1.0 Introduction Planned Projects The Regional Plan, adopted by the SANDAG Board on October 9, 2015, lists the capital projects and improvements planned for the San Diego region for the next 35 years. The Regional Plan includes the following improvements (i.e., Phased Revenue Constrained Projects): Addition of two MLs on SR 52 from I-805 to I-15 Addition of two reversible MLs on SR 52 from I-15 to SR 125 Addition of two GP lanes on SR 52 from Mast Boulevard to SR 125 Addition of ML connectors at I-15/SR 52 (west to north and south to east) Addition of ML connectors at I-805/SR 52 (west to north and south to east) These improvements would ease forecast traffic conditions. Between SR 163 and I-15, eastbound SR 52 would greatly benefit from the MLs, which could alleviate merging bottleneck traffic at Santo Road and Mast Boulevard. Additionally, future transit service (i.e., bus rapid transit [BRT]) on SR 52 is planned for 2050, using the MLs. 1.3 Problem Statement Based on existing and future conditions, the following problem statement has been developed. SR 52 is a major east-west freeway serving the City of San Diego and cities and communities in East County. Current levels of congestion, particularly during the AM and PM peak periods, have affected the reliability of service on this freeway, with implications for automobile, bus, and freight trips. Congestion on SR 52 has a ripple effect on surrounding roadways, including I-805, SR 125, and local arterials, degrading conditions and adding to overall congestion in the region. These conditions are expected to worsen in the future as population and employment grow and the reliability of SR 52 will continue to deteriorate unless improvements are implemented. Most improvements for SR 52 are not planned until 2050; however, short-term improvements are needed to address current and continually worsening congestion issues. 1-4
22 Chapter 2.0 Alternatives Development 2.0 ALTERNATIVES DEVELOPMENT This chapter describes the alternatives developed for this study. The alternatives include a variety of multi-modal (MM) improvements, which cover a range of transportation modes, facilities, technologies, and programs. 2.1 Study Corridor The study corridor is defined as SR 52 from I-805 to SR 67, but also includes segments of I-805 and I-15 (i.e., where ML connectors are planned), as shown in Figure Multi-Modal Improvements The MM improvements include the following: roadway, transit, AT, and TDM improvements. Some of these MM improvements extend beyond the study corridor and into the City of Santee, providing greater land use-transportation connectivity. For example, while roadway improvements would expand capacity, TDM improvements, like new park-and-ride lots, could alter commuter travel patterns (e.g., shift drive alone modes to carpool modes). Collectively, MM improvements provide the greatest improvements for SR 52. The MM improvements are discussed in detail below. Roadway Improvements Roadway improvements are limited to freeways. For additional details, see Section Transit Improvements Transit improvements are intended to improve transit efficiency and access. Bus-on-Shoulder Transit Operations On SR 52, from I-805 to Mission Gorge Road, bus-on-shoulder transit operations could be implemented during AM and PM peak periods. This would allow transit buses to use the shoulder when speeds in the main lanes drop to a certain level (e.g., 35 miles per hour). To accomplish this, the shoulders would be improved, where required, and signage indicating the legal use of the shoulder by transit buses only would be installed. Use of the shoulder as a low-speed bypass of congested freeways offers a low-cost, safe, innovative, and easily implementable strategy for improved transit service. SANDAG implemented the Freeway Transit Lane Demonstration Project in 2005, a 1- year pilot project featuring bus-on-shoulder transit operations along I-805 and SR 52, and plans to implement another bus-on-shoulder transit project along I-805 in the near future. The Freeway Transit Lane Demonstration Project received high marks for efficiency, safety, and innovation; helped buses maintain on-time performance during rush hours; and provided commuters with a viable travel option (up to 70% of riders estimated travel time savings of 5 minutes or more). 2-1
 could be implemented at eight signalized")
23 Chapter 2.0 Alternatives Development Figure 2-1. Study Corridor Transit Signal Priority On Mission Gorge Road, from Cuyamaca Street to the eastbound SR 52 off-ramp, transit signal priority (TSP) could be implemented at eight signalized intersections, reducing the dwell time for transit buses at these intersections. Current Bus Service Currently, Route 870 provides bus service between the El Cajon Transit Center, Santee Trolley Square, and Kearny Mesa in a peak hour, bi-directional loop, using SR 52 between the City of Santee and Kearny Mesa. In conjunction with bus-on-shoulder transit operations and the completion of the I-805 MLs North Project, this route could be modified to include stops in University City (i.e., at University Town Center), a major employment center. Coordination with MTS would be required. Future Rapid BRT Service The Regional Plan includes Rapid Route 890, which would provide rapid BRT service from El Cajon to Sorrento Mesa via SR 52. With the implementation of MLs on SR 52 prior to 2050, this route could commence operation prior to 2050 as well. Coordination with SANDAG and MTS would be required. 2-2
24 Chapter 2.0 Alternatives Development Improved Access to Transit ( First-/Last-Mile Connections) Currently, Santee Trolley Square includes a transit hub that serves the Trolley Orange Line and several bus routes, including Route 870. First- and last-mile bicycle facilities could be implemented to connect the surrounding neighborhoods to Santee Trolley Square. Additionally, along Mission Gorge Road (to Santee Town Center), existing bus stops could be enhanced with shelters. Active Transportation Improvements AT improvements are intended to support human-powered transportation (i.e., biking) by expanding the regional bike network. Bike Connections to Santee Trolley Square Bike connections could be provided along two corridors: Cuyamaca Street from Mission Gorge Road to north of Mast Boulevard San Diego River from Father Junipero Serra Trail to Lakeside baseball park These bike facilities would be classified consistent with regional and local plans. Safety enhancements for cyclists, such as bike boxes and bicycle signals, could be examined at key intersections along arterial roads. Transportation Demand Management Improvements TDM improvements are intended to encourage transportation alternatives (e.g., carpool, vanpool, transit, and telework) for commuters who drive alone each day. Local Targeted TDM Programming The SANDAG icommute Program could be used to reach employers in top destinations (i.e., the City of El Cajon, Sorrento Valley, Kearny Mesa, Mira Mesa, Downtown San Diego, and Mission Valley) and employees in the City of Santee. The program provides resources, incentives, and subsidies for employers and employees, including carpool and vanpool matching/formation and guaranteed ride home. Local policies or ordinances requiring developers to incorporate TDM into large-scale residential developments developing residential TDM programs (i.e., land use decisions that support alternative/high-occupancy vehicle modes) could be adopted. These residential developments could provide community-based transportation services, such as shuttles, first-mile/last mile solutions, and park-and-ride lots. Park-and-Ride Lots Strategically located and appropriately sized park-and-ride lots could be provided. Potential opportunities include: City of Santee undeveloped parcels: south side of Mission Gorge Road (east of the Mission Gorge Road/Fanita Drive intersection and immediately west of Forester Creek). 2-3
25 Chapter 2.0 Alternatives Development Caltrans right-of-way: south side of Mast Boulevard (immediately west of W. Hills Parkway), south side of Buena Vista Avenue (immediately east of Cuyamaca Street), west side of Cottonwood Avenue (immediately north of SR 52), south side of Mission Gorge Road (immediately east of SR 125 off-ramp), and underneath the SR 52/SR 67 junction. Additionally, at existing businesses and/or shopping centers, including Santee Town Center, opportunities to lease parking spaces could be explored. In the City of Santee, existing park-and-ride lots are located at Mission Gorge Road/Big Rock Road (36 spaces) and 8805 North Magnolia Avenue (22 spaces). A robust network of park-and-ride lots in and around the City of Santee is crucial to supporting carpool and vanpool formation. Vanpools Vanpools bring five or more people together to share the cost of getting to and from work in a van or other large vehicle. The SANDAG Vanpool Program, which provides vanpool matching and a vanpool subsidy for vehicle leases, could be publicized on the City of Santee website. Future Considerations Transportation System Management (TSM) improvements is a new concept intended to reduce travel time, improve reliability, and enhance safety by providing comprehensive system management of the study corridor. This technology was considered a potential viable option but not analyzed in this study or included in the cost estimate. The City of Melbourne in Australia deployed such a system but no city in this country has done so at this point. Potential Benefits of Managed Freeway/Enhanced Technology The concept of a managed freeway uses intelligent transportation system (ITS) management tools and dynamic demand management tools for managing the freeway. It provides a comprehensive package of strategies to manage freeway access and demand. Integrated data collection sensors and advanced system management tools monitor and control real time traffic conditions. In theory, the overall system management control would synchronize the flow of vehicles entering the freeway to those already on the freeway, thereby providing real time demand management that would maximize overall efficiency. Some components of the managed freeway are deployed in the San Diego region and some of the dynamic capabilities are utilized on the I-15 MLs. Components could include the following: Extensive vehicle detection and data collection New ramp meters and coordinated dynamic ramp metering Lane-use management, including variable speed limits and variable lane control Incident detection and closed circuit television surveillance 2-4
26 Chapter 2.0 Alternatives Development Traveler information Dedicated communications infrastructure to be a connection from the corridor field elements to the Caltrans Transportation Management Center Additional study and analyses beyond the scope of this project are necessary to determine the validity and benefit of TSM and whether it is feasible for SR Alternatives The alternatives developed for this study include one No- Alternative and four build alternatives. The alternatives were developed based on 2035 traffic volume forecast, prior to 2050 when the ML improvements listed in the Regional Plan would be implemented. No- Alternative The No- Alternative was developed to analyze the effect of each build alternative against a no build approach. The No- Alternative assumes the Revenue Constrained Projects listed in the Regional Plan for 2035, including: MLs on I-5 Four toll lanes (SR 11) and the Otay Mesa East Port of Entry from SR 125 to Mexico MLs on I-15/SR 15 Two MLs on SR 78 from I-5 to I-15 Two MLs on SR 94 from I-5 to I-805 Six toll lanes (SR 241) from Orange County to I-5 MLs on I-805 Two lanes on SR 76 Two lanes on SR 67 ML connectors at: I-5/SR 78, I-5/I-805, I-15/SR 78, SR 15/SR 94, SR 15/I-805, and I-805/SR 94 Freeway connectors at: SR 11/SR 905/SR 125, I-5/SR 56, I-5/SR 78, and SR 94/SR 125 Various transit facilities, AT projects, and arterial projects However, one Revenue Constrained Project listed in the current Regional Plan for 2035 was not included: two GP lanes on SR 52 from Mast Boulevard to SR 125. At the start of this study, the currently approved Regional Plan was not adopted and these GP lanes in the study corridor were not included in the previous Regional Transportation Plan. They are identified in the 2050 Regional Transportation Plan: Our Region, Our Future (SANDAG, 2011a) as part of a larger improvement for
27 Chapter 2.0 Alternatives Development Under the No- Alternative, none of the projects listed in the Regional Plan for 2035 (see above) would be implemented in the study corridor. Alternatives The four build alternatives were developed using the No- Alternative as a base, with additional MM improvements. The build alternatives would include the same set of transit, AT, and TDM improvements (see Section 2.2 for more details), but a different set of roadway improvements, as shown in Table 2-1 and described below. Table 2-1. Multi-modal Improvements/Alternatives for State Route 52 Multi-modal Improvements Roadway Improvements Alternative 1 Alternatives Alternative 2 SR 52: 2 GP lanes from Mast Blvd to SR 125 * X X SR 52: EB AUX lane from Spring Canyon bridge to Mast Blvd X X SR 52: WB AUX lane from Convoy St to I-805 X X I-805: NB AUX lane from SR 52 to north of Governor Dr Alternative 3 Alternative 4 SR 52: WB TC lane from Mast Blvd to crest of hill X X X X SR 52: 2 (reversible) MLs from I-805 to SR 125 * I-805/SR 52 ML Connector * I-15/SR 52 ML Connector * SR 52: 2 shoulder running lanes from I-805 to SR 125 Transit Improvements Bus-on-shoulder Transit Operations X X X X Transit Signal Priority X X X X Bus/Bus Rapid Transit Service X X X X Improved Access to Transit ( First-/Last-Mile Connections) Active Transportation Improvements X X X X X X X X X Bike Connections to Santee Trolley Square X X X X Transportation Demand Management (TDM) Improvements Local Targeted TDM Programming X X X X Park-and-ride Lots X X X X Vanpools X X X X Note: * This improvement is included in the Regional Plan X 2-6
28 Chapter 2.0 Alternatives Development Alternative 1 (Operational) Alternative 1 (Operational) includes the following roadway improvements (shown in Figure 2-2): GP Lanes o 2 GP lanes on SR 52 from Mast Boulevard to SR 125 (6 GP lanes total) AUX Lanes o Eastbound (EB) AUX lane on SR 52 from Spring Canyon bridge to Mast Boulevard o Westbound (WB) AUX lane on SR 52 from Convoy Street to I-805 o Northbound (NB) AUX lane on I-805 from SR 52 to north of Governor Drive TC Lanes o WB TC lane on SR 52 from Mast Boulevard to crest of hill Alternative 2 (Ultimate) Alternative 2 (Ultimate) includes the following roadway improvements (shown in Figure 2-3): GP Lanes o 2 GP lanes on SR 52 from Mast Boulevard to SR 125 (6 GP lanes total) AUX Lanes o Eastbound (EB) AUX lane on SR 52 from Spring Canyon bridge to Mast Boulevard o Westbound (WB) AUX lane on SR 52 from Convoy Street to I-805 o Northbound (NB) AUX lane on I-805 from SR 52 to north of Governor Drive TC Lanes o WB TC lane on SR 52 from Mast Boulevard to crest of hill MLs o 2 (reversible) MLs on SR 52 from I-805 to SR 125 ML Connectors o I-805/SR 52 ML connector: west to north, south to east o I-15/SR 52 ML connector: west to north, south to east 2-7
29 Chapter 2.0 Alternatives Development Alternative 3 (Minimal) Alternative 3 (Minimal) includes the following roadway improvements (shown in Figure 2-4): TC Lanes o WB TC lane on SR 52 from Mast Boulevard to crest of hill Alternative 4 (Shoulder Running) Alternative 4 (Shoulder Running) includes the following roadway improvements (shown in Figure 2-5): TC Lanes o WB TC lane on SR 52 from Mast Boulevard to crest of hill Shoulder Running Lanes o 2 shoulder running lanes (for all vehicles during peak periods) on SR 52 from I-805 to SR

30 Chapter 2.0 Alternatives Development Figure 2-2. Alternative 1 (Operational) 2-9

31 Chapter 2.0 Alternatives Development Figure 2-3. Alternative 2 (Ultimate) 2-10
32 Chapter 2.0 Alternatives Development Figure 2-4. Alternative 3 (Minimal) 2-11


33 Chapter 2.0 Alternatives Development Figure 2-5. Alternative 4 (Shoulder Running) 2-12
34 Chapter 3.0 Technical Studies 3.0 TECHNICAL STUDIES This chapter presents the traffic analysis, engineering feasibility, planning level cost estimates, and environmental constraints developed for this study. It also includes a description of the method of future forecasting of traffic volumes. 3.1 Traffic Analysis This section discusses the methods used for traffic analysis and presents existing and future traffic conditions. For future traffic conditions, the SANDAG Series 12 Regional Travel Demand Forecast Model with updates included from the City of Santee as part of their General Plan Update was used as the basis. It was used since it had the most complete and current information from the City. The model was then used to develop future volumes for An Aimsun microsimulation model was used to analyze travel time for the future scenarios. Traffic Volume Development Existing Traffic Volumes Peak Hour Intersection Volumes Existing peak hour turn movement volume data was collected between 7/21/2015 and 8/5/2015 at each of the intersections within the study area. The traffic counts were collected during the summer, which may result in lower traffic volumes because schools are not in session. Existing counts were compared to other available counts obtained during the school year and adjusted, where necessary to reflect higher school related volumes. See the appendix for more information. Peak hour count volumes were then balanced between interchange ramps to within 15 vehicles. Roadway Segment Volumes Roadway segment volumes were taken directly from the SANDAG Series 12 model for both existing and future No and analysis scenarios. Freeway Volumes Freeway volume data was obtained from Caltrans. The freeway volume data is available from 9/23/2015 to 10/2/ Future Volumes (Traffic Forecasting) Regional Travel Demand Forecast Model The SANDAG Series 12 Regional Travel Demand Forecast Model is used to forecast future conditions. As part of their General Plan update, the City of Santee developed a more detailed regional forecast model with updated land use and transportation network information for the year 2035 for the City of Santee. This model was used as a basis for future volume development. Using this model as a starting point, our staff coordinated with the City of Santee, El Cajon and the City of San Diego to determine any cumulative development projects and transportation network improvements. Our staff then coordinated with SANDAG 3-1
35 Chapter 3.0 Technical Studies modeling staff to ensure these projects were represented in the 2035 regional forecast model. Future Turning Movement Volume Development Future turn movement volumes were developed by applying a two-step process to existing peak hour volumes. The process is as follows: 1. Determining Model Growth: By comparing the peak hour volumes in the 2013 and 2035 No models, we determined the volume growth at each interchange. For example, if the 2035 No model shows 1,200 AM peak hour volumes on a freeway ramp and the 2013 model shows 800 on the same ramp, then the model AM peak hour volume growth on that ramp is 400 vehicles. 2. Applying Model Growth to Existing Count Volumes: The resulting volume growth from 2013 to 2035 was then added to existing balanced peak hour turn movement volumes to produce the final 2035 No volumes. In the same example, if an existing peak hour ramp volume is 1,000, then future volume would be approximately 1,400 vehicles, which is then carried back through the intersections to ensure volumes balance within +/- 10%. Traffic Analysis Methodology Intersection Analysis Intersection delay and level of service (LOS) analysis was performed using the Synchro 8.0 software suite. Synchro is a macrosimulation traffic software based on procedures outlined in the Highway Capacity Manual (HCM). At each intersection the number of lanes (turn and through), length of the turn pockets, the traffic signal timing and phasing information is input into Synchro based on field review and signal timing sheets obtained from Caltrans. The study area for the intersection analysis includes the following SR 52 on- and offramp intersections: Convoy Street Kearny Villa Road Santo Road Mast Boulevard Mission Gorge Road Fanita Drive Cuyamaca Street Magnolia Avenue These intersections are shown in Figure
36 Chapter 3.0 Technical Studies Figure 3-1. Aimsun Study Area Intersections Roadway Analysis Arterial roadway capacity analysis was performed using SANTEC/ITE guidelines based on a volume-to-capacity (V/C) ratio. Daily arterial roadway volumes were taken directly from the SANDAG Series 12 model and compared to the capacity of each respective arterial roadway Freeway Operations Analyses (Using Microsimulation) Freeway operations within the study area were evaluated using a microsimulation model (Aimsun) of the study corridor. For this study, the following alternatives were included: 2012 Existing (Weekday AM and Weekday PM Baseline used to compare to existing observed field conditions) 2035 Alternative 1 (Weekday AM and Weekday PM) 2035 Alternative 3 (Weekday AM and Weekday PM) 2035 Alternative 4 (Weekday AM and Weekday PM) The freeway travel time was simulated for peak hour conditions: 7:00 to 8:00 a.m. during the weekday AM and 5:00 to 6:00 p.m. during the weekday PM. The peak hours were selected based on existing conditions. In addition, to estimate existing congested conditions better in the simulation, the network was seeded for one-hour prior to the peak hour, thus more accurately reflecting peak hour conditions. Microsimulation Study Area The study area for the freeway analysis includes the following: SR 52 mainline from I-805 to SR 67 SR 52 on-/off-ramps in the study corridor Freeway-to-freeway connectors in/adjacent to the study corridor Mast Boulevard from SR 52 on-/off ramps to Carlton Hills Boulevard 3-3

37 Chapter 3.0 Technical Studies Mast Boulevard/West Hills Parkway signalized intersection Simulation Model Development There are a number of traffic-specific microsimulation software packages that are available to prepare analysis. Aimsun, a robust microsimulation software, was chosen as the preferred package due to its regional use with SANDAG. SANDAG uses it along I-15 for the ICM project and is also being used to develop a region wide mesoscopic simulation model including all of the signalized intersections in the region. Aimsun also works with data imported directly from GIS and specifically the SANDAG Traffic Demand Model network files. Aimsun can be used for microsimulation as well as mesoscopic simulations. The Aimsun modeling process is shown in Figure 3-2. Additionally, the steps used to develop the network are described below. Figure 3-2. Simulation Modeling Process Series 12 Regional Travel Demand Model Conversion/Extraction Base Simulation Model Error Check Validation Existing Conditions Model Future Model (No-) Future Model (Alternatives) 3-4
, provided in.shp format, was entered. Then, the data (i.e., 206 links) was reviewed.")
38 Chapter 3.0 Technical Studies Base Simulation Model The network is composed of a set of one-way links connected to each other through nodes. To build the existing conditions model/network, data from the SANDAG Series 12 Model (Year 2012), provided in.shp format, was entered. Then, the data (i.e., 206 links) was reviewed. Adjustments or corrections were made after the.shp model network was imported into the Aimsun model, to ensure model runs without errors. These included adjusting all of the connections of travel lanes from link to link and at all merge and diverge points on the freeway and all turning movements at the study intersection. Figure 3-3 shows the Base Model network in Aimsun. Figure 3-3. Microsimulation Study Area Network The following was reviewed and/or adjusted within the model: Geometry, Speed, and Control o Basic network connectivity to ensure that all links and connectors necessary are present o Link geometry, such as link lengths, lane geometries, and link types o Free-flow speed coding, such as desired speed decisions and reduced speed areas o Coding and placement of traffic control devices (i.e., one signalized intersection at the Mast Boulevard/West Hills Parkway intersection) Vehicular Demand o Base year traffic volumes from the SANDAG Series 12 Model, at all network entry points as well as the volume splits at each decision points along the study corridor, were entered into the model. Origin-Destination matrix was not used for this study. The simulation is 3 hours to allow the network to load sufficiently. The distribution of the 3-hour peak period volumes were built by applying a percentage of the peak hour volumes for each of the 3 hours within the peak period. The distribution of peak 3-5
39 Chapter 3.0 Technical Studies period volumes were based on review of distribution patterns from existing freeway counts. Error Check Inputs into the existing conditions model/network were double-checked. Additionally, initial model runs were performed to review vehicle movements through the corridor. Minor adjustments were made, as necessary. Validation The base model/network was reviewed along the freeway and Mast Boulevard and compared to existing field conditions. Travel time and queuing were compared to existing conditions. To compare travel time with existing conditions, typical travel times from Google maps were used. Key hot spots for travel time were: AM Peak: WB SR 52 o SR 67 to Mast Boulevard (on-ramp merge point) o I-15 to I-805 PM Peak: EB SR 52 o I-15 to Mast Boulevard Adjustments were made in the model to better match existing conditions. Adjustment examples include: Driver reactions at freeway merge points (e.g., sensitivity of drivers/vehicles on the freeway to merging traffic from ramps, driver awareness of up-coming ramps, etc.) Freeway grades which would affect vehicle acceleration and speed (i.e., a 4% grade was coded for westbound SR 52 between Mast Boulevard and the top of the hill) Trucks were not allowed on the fast lanes on the freeway This was an iterative process until satisfactory travel time was observed in the model runs. Multiple model runs were done to check average travel times and queues. Existing Conditions Model Simulation After the simulation was validated, the existing conditions model/network was considered complete. Five model runs were completed and average travel times for the peak hour were reported for the following segments: AM Peak: WB SR 52 o SR 67 to Mast Boulevard o Mast Boulevard to I
40 Chapter 3.0 Technical Studies o I-15 to I-805 AM Peak: WB Mast Boulevard o Carlton Hills Boulevard to SR 52 AM Peak: NB I-805 o SR 52 to Nobel Drive PM Peak: EB SR 52 o I-805 to I-15 o I-15 to Mast Boulevard o Mast Boulevard to SR 67 Future Simulation Model (No-) To build this model, the existing conditions model was used as a base. The 2035 No- volumes from the SANDAG model were then input into the model. Five model runs were completed and average travel times were reported for the same study area segments listed previously for the existing conditions model. Future Simulation Model (Alternatives except Alternative 2) The Future No- model was used as a base for each of the proposed alternatives except Alternative 2. Then each model was updated to reflect the proposed improvements for its respective alternative. The 2035 volumes for each alternative derived from the specific SANDAG model runs were input accordingly. Five model runs of each alternative were completed and average travel times were reported for the same study area segments listed previously for the existing conditions model. Ramp metering at Mast Boulevard/SR 52 westbound on-ramp was assumed with improvements proposed on the freeway and on-ramp at Mast Boulevard during the AM peak period. The assumed ramp metering discharge rate was based on the typical ramp metering discharge rates of 1,950 vehicles per hour, utilized by Caltrans for a 2-lane ramp with two cars per green operation. Existing Conditions Freeway In the AM peak, SR 52 is congested in the westbound direction between SR 67 and the hill past Mast Boulevard, as well as between I-15 and I-805. Due to SR 52 conditions in the AM peak, Mast Boulevard also experiences a long delay in the westbound direction from Carlton Hills Boulevard to SR 52. In the PM peak, eastbound SR 52 traffic backs up from Convoy Street to the San Diego River bridge due to the bottleneck at the two-lane San Diego River bridge. Average travel times for the AM and PM peaks are summarized in Table 3-1 and Table 3-2, respectively. 3-7
41 Chapter 3.0 Technical Studies Table 3-1. Existing Conditions: AM Peak Average Travel Times WB SR 52 WB Mast Blvd NB I-805 SR 67 to Mast Blvd Mast Blvd to I-15 I-15 to I-805 Total Carlton Hills Blvd to SR 52 SR 52 to Nobel Dr Average (min) Free Flow (min) Note: Average travel times based on average results from five Aimsun model runs. Free Flow travel times are from Google Maps, 2016 Table 3-2. Existing Conditions: PM Peak Average Travel Times EB SR 52 I-805 to I- 15 I-15 to Mast Blvd Mast Blvd to SR 67 Total Average (min) Free Flow (min) Note: Average travel times based on average results from five Aimsun model runs. Free Flow travel times are from Google Maps, Intersections A summary of existing intersection conditions is provided in Table 3-3. As shown in this table, all study area intersections operate at LOS D or better, except for Mast Boulevard at Sycamore Canyon Landfill that operates at LOS E during the AM peak hour. Table 3-3. Existing Intersection Conditions Existing AM Existing PM # Intersection Name Control Type Average Delay HCM LOS Average Delay HCM LOS 1 Convoy St & SR 52 EB Ramps Signalized 28.8 C 47.1 D 2 Convoy St & SR 52 WB Ramps Signalized 31.2 C 44.2 D 3 Kearny Villa Rd & SR 52 WB Ramps Signalized 17.2 B 17.9 B 4 Kearny Villa Rd & SR 52 EB Ramps Signalized 7.3 A 29.2 C 5 Santo Rd & SR 52 EB Ramps Two-way Stop 11.5 B 10.7 B 6 Santo Rd & SR 52 WB Ramps One-way Stop 9.0 A 9.1 A 7 Mast Blvd & SR 52 EB Ramps Signalized 14.1 B 16.5 B 8 Mast Blvd & SR 52 WB Ramps Signalized 24.3 C 9.9 A 3-8
42 Chapter 3.0 Technical Studies 9 Mast Blvd & Sycamore Canyon Landfill Signalized 56.0 E 42.7 D 10 Mission Gorge Rd & SR 52 EB Off Ramp Signalized 6.5 A 8.1 A 11 Mission Gorge Rd & SR 52 WB On Ramp Signalized 2.8 A 1.1 A 12 Fanita Dr & SR 52 EB On Ramp Uncontrolled 0.0 A 0.0 A 13 Fanita Dr & SR 52 WB Off Ramp One-way Stop 23.0 C 13.8 B 14 Cuyamaca St & SR 52 EB Ramps Signalized 16.3 B 30.4 C 15 Cuyamaca St & SR 52 WB Ramp Signalized 6.7 A 8.8 A 16 Magnolia Ave & SR 52 EB Off Ramp Signalized 10.1 B 17.1 B 17 Magnolia Ave & SR 52 EB On Ramp/SR 67 On Ramp Signalized 11.2 B 8.7 A Note: The HCM calculations for level of service has limitations when it comes to representing operations accurately when there are downstream constrained conditions. At the noted locations, there exists conditions that do not allow the intersections operations to be fully represented (i.e. the level of service may be worse than is reported.) Roadways Arterial roadway segments connecting to SR 52 were analyzed under existing conditions where the daily traffic volume is compared to the roadway capacity volume thresholds. A summary of existing roadway conditions is provided in Table 3-4. As shown in this table, all arterial roadway segments operate under capacity (80% or less) under existing conditions. Table 3-4. Existing Roadway Conditions Segment Existing Conditions Street From To Length (Miles) Capacity 1,2 ADT V/C Ratio LOS Magnolia Ave EB SR 52 WB SR ,000 Off-Ramp On-Ramp 24,276 61% C Kearny Villa Rd EB SR 52 WB SR ,000 Ramps Ramps 25,894 65% C Santo Rd EB SR 52 WB SR ,000 Ramps Ramps 5,275 18% A Fanita Dr Mission EB SR ,000 Gorge Rd On-Ramp 9,169 23% A Convoy St EB SR 52 WB SR ,000 Ramps Ramps 15,978 40% B Cuyamaca St EB SR 52 WB SR ,000 Ramps Ramps 24,622 49% B Mast Blvd EB SR 52 WB SR ,000 Ramps Ramps 13,423 34% A WB SR 52 West Hills ,000 Ramps Pkwy 26,154 65% C Mission Gorge EB SR 52 WB SR ,000 Rd Off-Ramp On-Ramp 18,423 46% A WB SR 52 SR ,000 On-Ramp 20,982 42% B 3-9
43 Chapter 3.0 Technical Studies SR 125 Fanita Dr ,000 37,600 75% C Notes: LOS E capacities taken from Table 2 in the SANTEC / ITE Guidelines for Traffic Impact Studies (TIS) in the San Diego Region. SANTEC/ITE, Roadway classifications obtained from the City of Santee General Plan 2020 (City of Santee, 2003) for roadways within the City of Santee. Classifications for roadways within the City of San Diego were obtained from the mobility element of each respective community plan. 3-10
44 Chapter 3.0 Technical Studies 3.2 Engineering Feasibility For the engineering review, high-level project footprints were developed for and Caltrans freeway design standards were applied to each alternative. As this study is a high-level planning effort, the project footprints are very conservative and do not assume design exceptions besides those that would be critical to each alternative. Based on the highlevel project footprint, potential right-of-way and environmental impacts were identified. During the process to review the engineering feasibility of the alternatives, options for the existing bike lane over the Spring Canyon and Oak Canyon Bridges were investigated. Basis for the Analysis/Methodology In order to review the engineering feasibility of the alternatives, high-level concepts were used to determine the footprint and subsequent engineering concerns along the corridor. The limits of the alternatives were reviewed with the TWG and formed the basis for the review of potential right-of-way impacts as well as engineering challenges for each of the alternatives. No engineering drawings were developed, but the high-level concepts provided the limits to sufficiently determine future improvements necessary to implement the alternatives. This study utilized the existing information described below: Centerline data, topo, existing/proposed bridge locations in digital format from Caltrans As-built bridge plans from Caltrans Commercially available digital aerial imagery Proposed auxiliary lane locations from SANDAG/Caltrans Previously developed studies from Caltrans Alternatives The alternatives reviewed are described in this section, in order of increasing magnitude of work. All of the alternatives would include MM improvements related to first and last mile connectivity, bicycle amenities, and TDM. Additionally there is emerging technology that provides for more coordinated and efficient transportation corridors. Some of this technology exists along the I-15 Integrated Corridor Management (ICM) system, while other technology is being utilized in other transportation corridors around the world. The following alternatives do not specifically detail the type of technology that may be available during the time of the alternative s implementation, but is seen as a typical improvement that can be included to enhance the alternative s performance. Alternative 3 (Minimal): This alternative includes the addition of a 12-foot westbound truck-climbing lane on SR 52 from Mast Boulevard to just west of the crest of the hill (approximately 2.5 miles). In the existing condition, this alternative would add a westbound TC lane from Mast Boulevard to the summit. In order to minimize retaining walls and the grading required 3-11
45 Chapter 3.0 Technical Studies for this option, the majority of the freeway widening required is assumed to occur in the median. The two bridges over Spring Canyon and Oak Canyon would be widened to add one lane only in the westbound direction in the median side. Through the use of geometry and striping transitions, the new pavement in the median would be aligned to the existing pavement on either side of the improvements. Critical to the addition of a TC lane is the widening of the Spring Canyon and Oak Canyon bridges. In an effort to provide solutions that would be low-cost and feasible alternatives, an evaluation was done to look at multiple options to provide the additional lane on the freeway by modifying the existing westbound bike lane. The options evaluated included, cantilever the bike lane from the existing bridges using traditional concrete, cantilever the bike lane from the existing bridges using lightweight materials, and hanging the bike lane under the existing bridge s overhangs. Alternative potential bike routes were also explored if the bike lane was removed completely. The study s structural analysis identified a number of challenges with each option. Based on our structural analysis it was determined that the existing bridges were constructed to near their loading capacity and does not allow for additional loading to the structure without significant retrofit of the superstructure, columns and footings. One of the remaining options for the bike lane is to hang a bi-directional bike lane under the bridges and allow for one-way bike traffic controlled by a signal. This would be the lowest cost option and may require the minimal retrofit to the existing structures. This would allow for the existing bike lane to be relocated to the hanging bike lane and the added width currently used for the bike lane on the bridge could be used for the fourth westbound travel lane (i.e., TC lane). The potential costs associated with this option as part of this Alternative 3 are included in the cost section below. Breaking this Alternative into smaller phases provides an opportunity to implement portions of the improvements when funds are available. Phase 1 could include the construction of a TC lane from Mast Boulevard to Spring Canyon Bridge and could cost $6 million, and Phase 2 could entail the construction of the bridges and completion of the TC lane to the crest of the hill, with a cost of $28 million. Alternative 4 (Shoulder Running): This alternative allows for the use of shoulders for all vehicles during the peak period. It is assumed that the inside shoulder in each direction would be removed, replaced and widened to 12-feet, where required (approximately 10 miles, east and westbound), with a pavement structural section corresponding to the freeway lanes. This shoulder replacement would extend the entire length of SR 52, i.e. from I-805 to SR 125. The outside shoulders would remain available for emergencies. The San Diego River bridges would be re-striped to utilize the existing shoulder and minor drainage modification would be required. In addition to the shoulder removal/replacement, the TC lane described in Alternative 3 would be included. 3-12
46 Chapter 3.0 Technical Studies Alternative 1 (Operational Improvements): The major improvements proposed in the alternative include; Addition of a 12-foot lane in each direction between SR 125 and Mast Boulevard Widening of the San Diego River Bridge in the median to the ultimate condition Addition of a 12-foot eastbound auxiliary lane from just west of the Spring Canyon Bridge to Mast Boulevard Addition of a 12-foot westbound auxiliary lane from Convoy Street to just east of the I-805 which would merge into the existing lane that begins just east of the I- 805 Addition of a 12-foot northbound auxiliary lane on I-805 from SR 52 to north of Governor Drive Widening of the I-805 northbound bridge over Governor Drive by 12-feet Widening of the I-805 northbound bridge over railroad tracks by 12-feet This alternative builds on the improvements described in both Alternatives 3 and 4. The westbound TC lane and widening of Spring Canyon and Oak Canyon bridges would be included in this alternative as well. However, under Alternative 1, the shoulders would be used only for bus-on-shoulder transit operations. One option under this alternative would be to re-stripe the San Diego River bridges to utilize the existing shoulder as travel lanes and minor drainage modification would be required. Alternative 2 (Ultimate Improvements): This alternative includes all of the future planned ultimate improvements to the corridor that are included in the Regional Plan as well as the improvements outlined in the Alternative 3 and Alternative 1. The major improvements proposed in the alternative include; MLs (2 lanes) along SR 52 from I-805 to I-15 MLs (2 lanes, reversible) along SR 52 from I-15 to SR 125 Addition of 2 freeway lanes along SR 52 from Mast Boulevard to SR 125 ML connectors at SR 52 and I-15 (West to North and South to East) ML connectors at SR 52 and I-805 (West to North and South to East) Addition of a 12-foot eastbound AUX lane from just west of the Spring Canyon Bridge to Mast Boulevard Addition of a 12-foot westbound AUX lane from Convoy Street to just east of the I-805, which would merge into the existing lane that begins just east of the I-805 Addition of a 12-foot northbound AUX lane on I-805 from SR 52 to north of Governor Drive 3-13
47 Chapter 3.0 Technical Studies Widening of the I-805 northbound bridge over Governor Drive by 12 feet Widening of the I-805 northbound bridge over railroad tracks by 12 feet 3-14
48 Chapter 3.0 Technical Studies 3.3 Planning Level Cost Estimates A preliminary Rough Order of Magnitude cost estimate was developed for the project based on the engineering assumptions and evaluation, in accordance with the Caltrans Project Development Procedures Manual (PDPM). Table 3-5 through Table 3-11 show the costs associated with each alternative. Earthwork Based on observations noted during field visits and commercially available software (Google Maps - Street view), a rough estimate of cuts and fills was developed to calculate the earthwork quantities. Pavement Structural Section For each alternative the extent and width of any additional lanes and shoulder replacement are per the description established based on the limits of the improvements. A structural section of 0.90 Jointed Plain Concrete Pavement, 0.25 Hot Mix Asphalt over 0.65 of Class 2 Aggregate Base was assumed for construction or replacement of freeway lanes and shoulders. For ramp pavement, a structural section of 0.50 of Hot Mix Asphalt over 0.65 of Class 2 Aggregate Base was assumed. Retaining Walls and Barriers The same assumptions made for the earthwork quantities were extended to identify the locations and heights of retaining walls. At several locations, the widening of the freeway on the outside would be impacted by presence of steep existing cuts on either side of the freeway, requiring the construction of retaining walls. Therefore, at most locations, in order to minimize earthwork and retaining wall costs, the pavement construction was assumed to be located within the existing median. Environmental Mitigation Environmental impacts are not identified in this early stage of the project. However, some costs for environmental mitigation are included due to the project impacts within the San Diego River area and potential for biological and wetland impacts. Percentage Costs Due to the preliminary stage of the project, for items such as Traffic and Lighting, Utilities, Drainage and Water Quality, Stage Construction and Minor Items, percentages of the calculated costs were applied, based on prior experience and projects. Structure - Bridges This item includes the widening of the following bridges Spring Canyon Bridge: For Alternatives 3 and 4, this bridge would be widened for the addition of the westbound TC lane. It is assumed that the bridge would be widened by 12 feet in the median in the westbound direction. A cost of $350 per square foot is assumed. 3-15
49 Chapter 3.0 Technical Studies Oak Canyon Bridge: For Alternatives 3 and 4, this bridge would be widened for the addition of the westbound TC lane. It is assumed that the bridge would be widened by 12 feet in the median in the westbound direction. A cost of $350 per square foot is assumed. San Diego River Bridge: Under Alternative 1, this bridge would be widened in the median to the ultimate condition, 54 feet wide. A cost of $350 per square foot is assumed. I-805 Bridges over Governor Drive and railroad tracks: Under Alternative 1, these bridges are widened by 12-feet in the northbound direction. Due to the difficult construction conditions over live traffic, a cost of $400 per square foot is assumed. Right-of-Way Most of the improvements within the SR 52 corridor are within the existing median area and within existing right-of-way when on the outside. Therefore, no right-of-way costs are assumed at this time. Additionally, there are radio (KFMB) transmission towers that are on the north and south side of the freeway, east of the Mast Boulevard interchange. Although no widening of the freeway outside of the right of way is anticipated, the transmission wires that connect between the towers may be affected by the improvements in the area. Contingency Based on the Caltrans PDPM, a 30 to 50% range is recommended for projects at this stage in the design process. A contingency of 40% is used for this project. Unit Costs The unit costs and bridge costs used for the individual line items are the unit costs identified from the Caltrans Costs database and further refined based on recent unit costs from the Mid-Coast Corridor Transit Project which includes many freeway and bridge sections. 3-16
50 Chapter 3.0 Technical Studies Table 3-5. Planning Level Capital Cost Estimate (2016$) for Alternative 1 Summary of Items Cost 1 Earthwork $5,982,000 2 Pavement Structural Section $14,271,000 3 Retaining Walls $5,121,000 Subtotal (for items 6-10) $25,374,000 4 Environmental Mitigation $1,350,000 5 Traffic and Lighting (including Electrical, $761,000 Signing and Striping); 3% 6 Drainage and Water Quality; 5% $1,269,000 7 Stage Construction; 5% $1,269,000 8 Minor Items - 10% $2,537,000 9 Mobilization - 10% $2,537,000 Mainline Roadway Subtotal $35,097, Contingencies -40% $14,039, Structures - Bridges $61,800,000 Total Capital Construction Cost $110,936, Preliminary Design - 5% $5,547, Final Design - 10% $11,094, Project Management - 5% $5,547, Construction Management - 12% $13,312, Professional liability - 2.5% $2,773,000 Total Project Cost $149,209,
51 Chapter 3.0 Technical Studies Table 3-6. Planning Level Capital Cost Estimate (2016$) for Alternative 1 with Re-stripe and Hanging Bike Bridge Option Summary of Items Cost 1 Earthwork $2,680,000 2 Pavement Structural Section $10,650,000 3 Retaining Walls $2,560,000 Subtotal (for items 6-10) $15,890,000 4 Environmental Mitigation $1,350,000 5 Traffic and Lighting (including Electrical, $790,000 Signing and Striping); 3% 6 Drainage and Water Quality; 5% $790,000 7 Stage Construction; 5% $790,000 8 Minor Items - 10% $1,590,000 9 Mobilization - 10% $1,590,000 Mainline Roadway Subtotal $22,790, Contingencies -40% $9,120, Structures - Bridges $3,150,000 Total Capital Construction Cost $35,060, Preliminary Design - 5% $1,750, Final Design - 10% $3,510, Project Management - 5% $1,750, Construction Management - 12% $4,210, Professional liability - 2.5% $880,000 Total Project Cost $47,160,
52 Chapter 3.0 Technical Studies Table 3-7. Planning Level Capital Cost Estimate (2016$) for Alternative 2 Item Limits Capital Cost 2014$ 1 (Millions) Capital Cost 2016$ 2 (Millions) 2 ML I-805 to I-15 $91 $93 2 ML (Reversible) I-15 to SR 125 $298 $304 2 GP Lanes Mast Boulevard to SR 125 $76 $78 ML Connector SR 52 and I-15 (West to North and South to East) $130 $133 ML Connector SR 52 and I-805 (West to North and South to East) $91 $93 Sub-Total Ultimate Regional Plan $700 Alternative 1 (Operational) Improvements I-805 (AUX Lane SR 52 to Nobel Drive) n/a $63 SR 52 (AUX Lane Convoy St to I-805) SR 52 ( TC Lane Mast Blvd to crest of hill) SR 52 (AUX Lane Spring Canyon Bridge to Mast Blvd) Notes: 1 Capital Costs 2014$, the Regional Plan 2 Capital Costs 2016$, escalated from 2014$ the Regional Plan TOTAL $
53 Chapter 3.0 Technical Studies Table 3-8. Planning Level Capital Cost Estimate (2016$) for Alternative 3 Summary of Items Cost 1 Earthwork $1,460,000 2 Pavement Structural Section $5,963,000 3 Retaining Walls $2,556,000 Subtotal (for items 5-9) $9,979,000 4 Environmental Mitigation $350,000 5 Traffic and Lighting (including Electrical, Signing and Striping); 3% $299,000 6 Drainage and Water Quality; 5% $499,000 7 Stage Construction; 5% $499,000 8 Minor Items - 10% $998,000 9 Mobilization - 10% $998,000 Mainline Roadway Subtotal $13,622, Contingencies -40% $5,449, Structures - Bridges $6,300,000 Total Capital Construction Cost $25,371, Preliminary Design - 5% $1,269, Final Design - 10% $2,537, Project Management - 5% $1,269, Construction Management - 12% $3,045, Professional liability - 2.5% $634,000 Total Project Cost $34,125,
54 Chapter 3.0 Technical Studies Table 3-9. Planning Level Capital Cost Estimate (2016$) for Alternative 3 with Hanging Bike Bridge Option Summary of Items Cost 1 Earthwork $1,460,000 2 Pavement Structural Section $5,963,000 3 Retaining Walls $2,556,000 Subtotal (for items 5-9) $9,979,000 4 Environmental Mitigation $350,000 5 Traffic and Lighting (including Electrical, Signing and Striping); 3% $299,000 6 Drainage and Water Quality; 5% $499,000 7 Stage Construction; 5% $499,000 8 Minor Items - 10% $998,000 9 Mobilization - 10% $998,000 Mainline Roadway Subtotal $13,622, Contingencies -40% $5,449, Structures - Bridges $3,157,000 Total Capital Construction Cost $22,228, Preliminary Design - 5% $1,111, Final Design - 10% $2,223, Project Management - 5% $1,111, Construction Management - 12% $2,667, Professional liability - 2.5% $556,000 Total Project Cost $29,896,
55 Chapter 3.0 Technical Studies Table Planning Level Capital Cost Estimate (2016$) for Alternative 4 Summary of Items Cost 1 Earthwork $2,860,000 2 Pavement Structural Section $14,124,000 3 Retaining Walls $2,556,000 Subtotal (for items 5-9) $19,540,000 4 Environmental Mitigation $350,000 5 Traffic and Lighting (including Electrical, Signing and Striping); 10% $1,954,000 6 Drainage and Water Quality; 5% $977,000 7 Stage Construction; 5% $977,000 8 Minor Items - 10% $1,954,000 9 Mobilization - 10% $1,954,000 Mainline Roadway Subtotal $27,706, Contingencies -40% $11,082, Structures - Bridges $12,630,000 Total Capital Construction Cost $51,418, Preliminary Design - 5% $2,571, Final Design - 10% $5,142, Project Management - 5% $2,571, Construction Management - 12% $6,170, Professional liability - 2.5% $1,285,000 Total Project Cost $69,157,000 Table Planning Level Capital Cost Estimate (2016$) for MM Improvements 1 Summary of Items Bicycle facilities/first and Last Mile Improvements Cost $5,000,000 2 Ramp metering $1,000,000 3 Transit improvements $1,000,000 Total Project Cost $7,000,
56 Chapter 3.0 Technical Studies 3.4 Environmental Constraints This review of environmental constraints considers available information about resources to examine the potential effects of implementing the build alternatives described in Chapter 2.0. Currently, there is no preferred alternative. As such, this review considers the range of build alternatives, which are collectively referred to as the project in this section. This review identifies the anticipated environmental approvals (e.g., the required environmental document type), identifies the environmental technical studies that likely will be required to support the project, and provides a preliminary list of permits that could be required. Following the Caltrans Mini-Preliminary Environmental Analysis Report (Mini-PEAR), this review provides preliminary environmental scoping, focusing on those environmental issues most likely to affect project scope, schedule, and costs. Further environmental review will be conducted as the project progresses (e.g., during the Project Approval and Environmental Document phase). For this study, the Mini- PEAR is provided in Appendix B. This review is not an environmental document, does not contain substantial environmental analysis, and does not meet state or federal requirements for any form of environmental review process or approval. Anticipated Environmental Approvals The project is within the existing Caltrans right-of-way. For the California Environmental Quality Act, an Initial Study/Mitigated Negative Declaration is anticipated. For the National Environmental Policy Act, a Routine Environmental Assessment/Finding of No Significant Impacts (EA/FONSI) is anticipated. Because the size and location of the project would likely result in substantial public interest, Caltrans may elect to prepare an Environmental Impact Statement rather than an EA. During future phases, Caltrans will determine the appropriate environmental document type. Environmental Technical Studies The project would require the completion of several technical studies. For key environmental issues, this section provides a brief summary of currently available information and the general scope of the anticipated technical studies. During future phases, Caltrans will determine the necessary technical studies Biology The ordinary high water mark delineates the limits of the Waters of the United States located at stream courses and drainage ways within the project area, and fall under the jurisdiction of the U.S. Army Corps of Engineers (ACOE), and as such will require a CWA (Clean Water Act) Section 404 Nationwide Permit from the ACOE and accompanying Section 401 Water Quality Certification from the Regional Water Quality Control Board (RWQCB). Work within the riparian zone or below the top of the bank in the San Diego River will also require a Section 1602 Streambed Alteration Agreement from the California Department of Fish & Wildlife (CDFW). In addition, locations adjacent to stream-courses as well as other areas within the project vicinity may meet 3-23
57 Chapter 3.0 Technical Studies the ACOE three-parameter (hydrology, soil, and vegetation) definition of a wetland. Impacts to wetlands will also require the above permits. Impacts to perennial or seasonal waters or wetlands with the project area may require Section 7 Consultation at the discretion of the United States Fish & Wildlife Service (USFWS) to address impacts to any federally-listed species. If Caltrans cannot perform vegetation removal outside of the bird nesting season (March 15th to September 1st, surveys and nest searches will be performed by qualified biologist for sensitive and migratory bird species within the construction area prior to construction activities). If active nests are found, any work that will impact said nests shall be halted, and Caltrans shall follow the (Migratory Bird Treaty Act (MBTA) procedures Section 4(f) Evaluation Evaluation and consultation should be conducted at the early phase to identify potential 4(f) resources defined as publicly owned public parks, recreation areas, or refuges. If 4(f) resources exist within the project area and cannot be avoided, additional evaluation and approvals will be required by Caltrans Cultural Resources State and Federal legislation require governmental agencies to consider the impacts of proposed projects on historic and archaeological resources before undertaking a project. Federal legislation, which protects historic and archaeological resources, includes Section 106 of the National Historic Preservation Act of 1966 (NHPA, as amended) and the Section 4(f) of the U.S. Department of Transportation Act. Section 5024 and of the Public Resources Code provide for the management and protection of stateowned historic properties and historical resources. Assembly Bill 52 amended CEQA to identify a Tribal Cultural Resource (TCR) as a new, separate, and distinct resource to be analyzed under the California Environmental Quality Act (CEQA). The additions to CEQA mandate clear timelines for consultation with California Native American tribes. The consultation timelines established however, occur later in the project development process. The project area is not considered to be archeological sensitive, however, a record search will be done once the area of potential effect (APE) is determined. Also a historical review (>50 years old) will be conducted for structures or features to identify if an evaluation by an architectural historian will be required. If resources exist within the area of disturbance, and cannot be avoided, higher level evaluations would be required for archaeological, architectural, 4(f) and paleontological resources Hazardous Waste The review for potential hazardous waste impacts involve the following: 1. A review of the project plans and aerial mapping; 2. Discussions with the design engineer; 3-24
58 Chapter 3.0 Technical Studies 3. A review of previous site investigation work that has occurred in the vicinity of this project; 4. A review of databases specific to hazardous materials. Based on this review, the potential for hazardous waste exists with respect to the following: 1) Lead-contaminated soil may exist within and near the right-of-way due to the historical use of leaded gasoline, leaded airline fuels, waste incineration, etc. The areas of primary concern in relation to highway facilities are soils along routes with historically high vehicle emissions due to large traffic volumes, congestion or stop and go situations. Since a large amount of excess soil relinquishment is likely to occur, an Aerially Deposited Lead (ADL) site investigation will be required. This site investigation will determine if hazardous soils exist and what actions, if any, will need to occur during construction. 2) If any of the bridges were built in 1971, the potential for asbestos exists and a site investigation will be required to confirm the presence of asbestos in the bridge. 3) Hazardous levels of lead and chromium are known to exist in the yellow color traffic stripes. Since these traffic stripes will be grinded off along with the roadway, the levels of lead and chromium will become non-hazardous. These grindings (which consist of the roadway material and the yellow color traffic stripes) shall be removed and disposed of in accordance with the Standard Special Provision B (Residue Containing High Lead Concentration Paints) which requires a Lead Compliance Plan (LCP). Non-hazardous levels of lead are known to exist in the white traffic striping. As such, these grindings shall be removed ad disposed of in accordance with the same specifications. 4) All existing and previous uses will be part of the record search. Including but not limited to known contaminants and waste; contaminated properties (such as Miramar landfill and Miramar Air Field); and special provisions will be evaluated based on the resource study area for both direct and indirect effects. Since construction of the proposed project cannot avoid disturbing soils or impacting the bridge structure, a Site Investigation (SI) is required Visual Resources A Visual Impact Assessment (VIA) should be considered for every project that has the potential to change the visual environment. The level of assessment for the VIA can range from no formal analysis to a complex analysis and is determined by many factors such as: numbers of viewer groups affected; existence of scenic resources; degree and totality of the proposed changes in the visual environment; local concerns or project controversy; and cumulative impacts along the transportation corridor. 3-25
59 Chapter 3.0 Technical Studies In order to establish the need and level of study for a VIA, a preliminary evaluation is performed to determine if the project will cause any physical changes to the environment. Projects that replace or rehabilitate existing facilities (e.g., pavement overlay, striping, sign replacement), and do not constitute a change in character to those facilities, will not require a formal analysis. This project will require a preliminary evaluation that includes activities such as conducting a site visit to inventory the scenic resources of the project site, estimating potential changes to that character, and identifying viewer groups and public concerns or opposition to the proposal. The intent of the screening is to formally document the level of VIA required for the project or merely utilize the screening analysis as the scenic resource evaluation should no scenic resources be identified. It is not anticipated that the additions of AUX lanes or MLs will have a significant visual impact on the urban area. However, project features, such as retaining walls, noise walls, and significant bridge widening to the recently designated Scenic Highway would require a more detailed analysis during the technical and environmental phase Water Quality Caltrans has a Statewide National Pollutant Discharge Elimination System (NPDES) Permit (NPDES No. CAS000003) issued by the State Water Resources Control Board. This permit regulates the storm water and non-storm water discharges associated with construction activity, discharges associated with normal maintenance and operations of Caltrans facilities (also known as a Municipal Storm Water Permit), and it also serves as a State of California Waste Discharge Requirement. The permit requires Caltrans to comply with the requirements of the Statewide Construction General Permit (Order DWQ). During construction, compliance with the permit requires the appropriate selection and deployment of both structural and non-structural Best Management Practices (BMPs) that achieve the performance standards of Best Available Technology economically achievable/best Conventional Pollutant Control Technology (BAT/BCT) to reduce or eliminate storm water pollution Noise This project is considered a Type 1 project as defined in 23 Code of Federal Regulations (CFR) 772. As such, the following criteria are the specific indicators that this project will require a Noise Study Report since this project proposes: The addition of an AUX lane, except for when the AUX lane is a turn lane; or Restriping existing pavement for the purpose of adding a through traffic lane or an AUX lane; To determine if the project will result in a noise impact that requires consideration of abatement, the following will be identified at a later phase: Identify Land Uses in the Project Area - Identify existing land uses in the project area and identify the appropriate Activity Category as defined in 23 CFR 772 for 3-26
60 Chapter 3.0 Technical Studies each land use type. Include undeveloped land for which a building permit has been issued. Determine Existing Noise Levels at Receptors - Existing noise levels are determined based on noise monitoring. The Technical Noise Supplement (TeNS) provides information on how to conduct noise measurements for this purpose. Model Future Noise Levels with the Project - The Traffic Noise Modeling (TNM) predicts traffic noise levels based on projected worst hour traffic volume (the traffic volume and speed conditions that produce the highest hourly noise level), traffic mix (percentage of truck traffic), ground type, and the distance between projected traffic and of the receptors. Determine if Traffic Noise Impacts are Identified - A noise impact occurs when: 1) there is a substantial noise increase between design-year build conditions and existing conditions or; 2) the design-year build traffic noise level approaches or exceeds the Federal Highway Administration (FHWA) noise abatement criteria (NAC). Noise analysis for projects under CEQA centers on whether the project or the proposed noise abatement would result in significant adverse environmental effects. Whether an increase in future noise level would result in a significant effect for purposes of CEQA is determined by comparing the existing noise level (or baseline environmental setting) to the predicted noise level with project. The CEQA noise analysis is completely independent of the 23 CFR 772 noise analysis, which is centered on noise abatement criteria. Under CEQA, the assessment entails looking at the setting of the noise impact and then how large or perceptible any noise increase would be in the given area. Key considerations include: the uniqueness of the setting, the sensitive nature of the noise receptors, the magnitude of the noise increase, the number of residences affected, and the absolute noise level. Proposed noise abatement may also have the potential to result in significant adverse environmental effects if the abatement negatively affects other environmental resources, such as designated scenic highways, historic sites, or endangered species Air Quality The primary legislation that governs federal air quality regulations is the Clean Air Act Amendments of 1990 (CAAA-1990). The act delegates primary responsibility for clean air to the U.S. Environmental Protection Agency (EPA). The EPA develops rules and regulations to preserve and improve air quality and delegates specific responsibilities to state and local agencies. There may be several distinct air quality analyses or studies performed in support of the project development process. For this project, a technical report will be required to summarize the studies, outline conformity information, and provide other needed information for the environmental document. 3-27
61 Chapter 3.0 Technical Studies Anticipated Permits Caltrans will define and confirm the permits required, as the project advances though the project development process. For biological resources (e.g., endangered species) and work in jurisdictional areas, such as jurisdictional waters and vegetation removal, the following resource agency permits and approvals would be required: Section 404 Permit from the ACOE Section 401 Water Quality Certification from the RWQCB 1602 Streambed Alteration Agreement from the CDFW Section 7 Consultation and Concurrence from USFWS 3-28
62 Chapter 4.0 Alternatives Evaluation 4.0 ALTERNATIVES EVALUATION This chapter presents the alternatives evaluation, including the development of criteria to screen the alternatives and the screening analysis. 4.1 Methodology The following criteria were developed by the project team and the TWG, based on the purpose and issues identified for the corridor study and in consideration of criteria developed by SANDAG to support the visions and goals of the Regional Plan. Ten criteria were developed for the screening analysis. The first two criteria Consistency with the Regional Plan and Near Term Implementation were used for initial screening, followed by evaluation of the remaining alternatives using the remaining criteria. The ten criteria are listed below. Consistency with the Regional Plan This criterion assessed consistency with the Regional Plan, including if projects listed in the Regional Plan would be precluded. Near Term Implementation This criterion assessed project operation within 10 to 15 years, including the consideration of regulatory requirements for clearance and estimated construction duration. Environmental Impacts This criterion assessed project environmental impacts. Key focus on impacts to ecosystems/biological resources. Other impacts included air quality and greenhouse gas (GHG) emissions. Capital Costs This criterion assessed project capital costs. Vehicle Miles Traveled This criterion, derived from the SANDAG model, calculated vehicle miles traveled (VMT). Person Throughput This criterion, derived from the SANDAG model, calculated the number of people served within the corridor. Multiplied the number of daily vehicles by vehicle occupancy (one, two, or three persons for MLs and one person for GP lanes). Reliability This criterion assessed consistency or dependability in travel time. Alternatives that provide improvements geared towards traffic management, transit, carpool, or even improvements at congested choke points can preserve trip reliability. Mode Share This criterion, derived from the SANDAG model, calculated mode share (for the drive alone, carpool, transit, walk, and bike modes) for regional trips, and assessed if the project would shift trips from the drive alone mode to other modes. Improvements to Transit and HOV Mobility This criterion assessed improvements to transit and HOV mobility. 4-1
63 Chapter 4.0 Alternatives Evaluation Congestion This criterion, derived from the SANDAG and Aimsun models, calculated the following: o Freeway Under Capacity. Percent of GP lanes operating at LOS E or better. o Travel Time. The average travel time on freeway and Mast Boulevard roadway segments in the peak direction. Freeway and roadway segments included the following: AM Peak: WB SR 52 SR 67 to Mast Boulevard Mast Boulevard to I-15 I-15 to I-805 AM Peak: WB Mast Boulevard Carlton Hills Boulevard to SR 52 AM Peak: NB I-805 SR 52 to Nobel Drive PM Peak: EB SR 52 I-805 to I-15 I-15 to Mast Boulevard Mast Boulevard to SR 67 Average peak period travel time for each of the freeway and roadway segments listed above was derived using the methodology described in Section , for the No- Alternative, Alternative 1, Alternative 3, and Alternative 4. o Daily Hours of Congested Conditions. Number of daily hours of congested conditions in the eastbound and westbound directions. Caltrans PeMS data were used to determine existing peak hours. The data identifies existing hours of congested conditions in the corridor using speed information from loop detectors embedded in the freeway. The existing hours of daily congestion were determined to be 3 hours during the a.m. peak period and 3.5 hours during the p.m. peak period. By comparing each future alternative to the existing condition segment by segment we developed a scaling factor that can be applied to the existing hours of daily congestion to derive future hours of daily congestion. The scaling factor is based on the weighted product of the length of the segment and the volume to capacity ratio for that segment. F = L x (v/c) F Scaling factor L Segment Length 4-2
64 Chapter 4.0 Alternatives Evaluation v/c Volume to capacity ratio The weighted sum of these factors provides an index that can be compared to each alternative. For example, in the existing am peak hour 69,200 feet of the freeway operate at v/c or better. The weighted product is 55,300 (69,200 X 0.799). 12,000 feet of the freeway operate between and The weighted product is 10,800. The same calculation is performed for the entire corridor. In this case the sum of all of the weighted products is 136,100. This factor gives us a measure of congestion for existing a.m. peak conditions that can be compared to future alternatives. Similar factors were calculated for each alternative including the No Alternative. When the factor for an alternative is compared to that of the existing condition the resulting ratio is used as a proxy to indicate how much more or less congestion will be experienced by the future alternative as compared to existing conditions. The resulting factors range from 0.8 (less congestion than existing conditions) to 1.07 (more congestion than existing conditions). o Person-Hours of Delay Saved in the Highest One Hour Peak. The number of person-hours of delay (PHD) saved along key highway and arterial segments during the peak hour. Alternatives 1, 3, and 4 were evaluated as part of this analysis, to determine their effectiveness compared to the No- Alternative. This analysis was done through the microsimulation to determine future travel times, Alternative 2 was not evaluated, as it is assumed to be the most effective alternative in terms of PHD saved. Freeway conditions are analyzed for the peak hour and peak direction: westbound for AM peak hour and eastbound for PM peak hour. Travel time is estimated using microsimulation modeling. Changes in travel time for Alternatives are compared to the No- Alternative. The travel time saved is then multiplied by the peak hour volume for each respective alternative to calculate the number of vehicle-hours saved, which is then converted to person hours by multiplying by the average vehicle occupancy (AVO) rate. The AVO rate is derived directly from regional travel demand model data. This methodology is summarized as follows: = 4-3
65 Chapter 4.0 Alternatives Evaluation o Arterial LOS. Percent of arterial roadways operating at a V/C ratio of 80% or less (LOS E). In the absence of daily volume counts, daily roadway volumes from the SANDAG model were used. Daily model volumes were compared to the LOS E capacity for each roadway type 1 to calculate the V/C ratio for each roadway segment. As detailed above, four parameters (VMT, Person Throughput, Mode Share and Congestion) were derived from the SANDAG model (i.e., the SANDAG Series 12 Model). The SANDAG Series 12 Regional Travel Demand Forecast Model is used to forecast future conditions and it included updates per the City of Santee General Plan update as well as updated land use and transportation network information for the year 2035 based on any cumulative development projects and programmed transportation network improvements. For this study the following model runs were developed using the modified SANDAG Series 12 model: 2035 No- Alternative Model Run This model represents conditions in 2035 with no SR 52 Corridor Study improvements. The future forecast volumes from this model were used for the No as well as Alternative 3 (Minimal). This model was used as a basis for comparing with all of the study alternatives. The volumes from this model run were also used for Alternative 3 (Minimal) based on the assumption that the improvements of this scenario are not significant enough to affect the region wide model Alternative 1 Model Run This model represents the Alternative 1 (Operational) conditions. The future forecast volumes from this model were used for Alternative 1 (Operational) as well as Alternative 4 (Shoulder Running). The regional model cannot simulate shoulder running lanes specifically, therefore an available model was necessary to use for analysis. Alternative 1 is the most similar to Alternative 4 of the available model runs. Alternative 1 represents more general purpose lane capacity than No, similarly to Alternative 4; build Alternative 1 does not provide managed lanes as Alternative 2 does and neither does Alternative Alternative 2 Model Run This model represents the Alternative 2 (Ultimate) and the future forecast volumes are used from this model in the evaluation of this Alternative. 4.2 Screening Analysis Consistency with the Regional Plan The Regional Plan includes the following projects in the study corridor by 2050: two MLs on SR 52 from I-805 to SR 125, ML connectors (west to north and south to east) at SR 52/I-805 and SR 52/I-15, and two GP lanes on SR 52 from Mast Boulevard to SR LOS E capacities from Table 2 in the SANTEC / ITE Guidelines for Traffic Impact Studies (TIS) in the San Diego Region (SANTEC/ITE, 2000) 4-4
66 Chapter 4.0 Alternatives Evaluation Under the No- Alternative, 2050 Regional Plan projects would not be precluded; therefore, this alternative would be consistent with the Regional Plan. Compared to the No- Alternative, Alternatives 1 to 4 also would be consistent with the Regional Plan (i.e., 2050 Regional Plan projects would not be precluded). Near Term Implementation Under the No- Alternative, no projects would be constructed in the study corridor (see Section for more details). Compared to the No- Alternative, Alternatives 1 and 3 would include nearterm project implementation (i.e., within 10 to 15 years) in the study corridor. Alternative 3 could be constructed prior to, or as a first phase of, Alternative 1. Compared to the No- Alternative, Alternatives 2 and 4 could include nearterm project implementation (i.e., within 10 to 15 years) in the study corridor, depending upon funding or regulatory approval. Alternative 2 could include near-term project implementation if toll usage/funding is sufficient to advance construction. Alternative 2 is the most costly of all the build alternatives (see Section 4.2.4). Alternative 4 could include near-term project implementation if regulatory agencies approve use of the shoulder running lanes (i.e., by all vehicles during peak periods). As the owner-operator of SR 52, Caltrans must approve use of the shoulder running lanes. Additionally, coordination with the California Highway Patrol, for issues related to safety, could be required. Environmental Impacts Under the No- Alternative, no projects would be constructed. Compared to the No- Alternative, Alternatives 1 to 4 could have environmental effects. Alternatives 1 to 4 would require an expansion of the Spring Canyon and Oak Canyon bridges, resulting in potential effects on ecosystems/biological resources. Alternatives 1, 2, and 4 would increase VMT (See Section 4.2.5), resulting in potential effects on air quality and GHG emissions. Alternatives 1 and 2 would require an expansion of the San Diego River bridge, resulting in potential effects on ecosystems and biological resources. 4-5
67 Chapter 4.0 Alternatives Evaluation Capital Costs Under the No- Alternative, no projects would be constructed (i.e., there would be no capital costs). Compared to the No- Alternative, all of the build alternatives would have capital costs. The build alternatives would have different costs for roadway improvements, but, when packaged with other MM improvements, the same costs ($7 million) for nonroadway improvements (i.e., transit, AT, and TDM improvements), which are included/shown in Figure 4-1. Alternative 4 roadway improvement costs ($69 million) include shoulder running lanes. Alternative 3 roadway improvement costs ($34 million) include expansion of the Spring Canyon bridge, expansion of the Oak Canyon bridge, and a TC lane. Alternative 1 roadway improvement costs ($149 million) include the following: the improvements listed for Alternative 3, expansion of the San Diego River bridge, and auxiliary lanes (at three different locations). Alternative 2 roadway improvement costs ($763 million) include the following: the improvements listed for Alternative 1, two MLs, and ML connectors. Alternative 2 would have the highest total costs ($770 million). In comparison, Alternatives 4, 3, and 1 would have lower total costs ($76, $41, and $156 million, respectively). 4-6
68 Chapter 4.0 Alternatives Evaluation Figure 4-1. Capital Costs $700 $600 $500 Million $400 $300 $763 $200 $100 $0 No- Alternative $149 $34 $69 $7 $7 $7 $7 Alternative 1 Alternative 2 Alternative 3 Alternative 4 Roadway Improvements Non-roadway Improvements 4-7
69 Chapter 4.0 Alternatives Evaluation Vehicle Miles Traveled Under the No- Alternative, the corridor VMT the VMT of trips originating within the study corridor (in both directions) would be 4,573,000 or 4% of the regional VMT (see Figure 4-2). The corridor VMT represents the daily vehicle trips on SR 52 with origins and destinations throughout the region. Compared to the No- Alternative, none of the build alternatives would reduce VMT. The project VMT, which is the corridor VMT plus any changes to the regional VMT, is shown in Figure 4-3. Alternative 3 would have the same VMT Alternative 2 would increase regional VMT by 9,000 or 0.2% Alternative 1 and Alternative 4 would increase regional VMT by 54,000 or 1.2% Figure 4-2. Regional VMT, 2035 No 4,573,000 4% 109,384,000 96% Corridor VMT Other VMT 4-8
70 Chapter 4.0 Alternatives Evaluation Figure 4-3. Project VMT, ,600,000 4,590,000 4,580,000 4,570, % +1.2% +0.2% 4,560,000 4,550,000 4,540,000 4,530,000 4,520,000 4,510,000 Change to Regional VMT (Compared to No- Alternative) Corridor VMT 4,500,000 No- Alternative Alternative 1 Alternative 2 Alternative 3 Alternative 4 4-9
71 Chapter 4.0 Alternatives Evaluation Person Throughput The No- Alternative would serve 4,665,000 people within the corridor. Compared to the No- Alternative, Alternative 1, Alternative 2, and Alternative 4 would provide an increase in the number of people served (see Figure 4-4). Alternative 2 would provide the greatest increase in person throughput, serving 5,094,000 people within the corridor. This is due to the MLs, which accommodate HOVs (vehicles with two or more persons) and provide additional capacity. Alternative 1 and Alternative 4 would provide the second greatest increase in person throughput, serving 4,889,000 people within the corridor. Alternative 3 was assumed to have the same person throughput as the No- Alternative as a conservative estimate because no model run was conducted to this alternative. Therefore Alternative 3 is likely to have higher Person Throughput than No in actuality. Figure 4-4. Person Throughput, ,000,000 4,665,000 4,889,000 5,094,000 4,665,000 4,889,000 4,000,000 3,000,000 2,000,000 1,000,000 0 No- Alternative Alternative 1 Alternative 2 Alternative 3 Alternative
72 Chapter 4.0 Alternatives Evaluation Reliability Compared to the No- Alternative, all of the build alternatives would increase reliability by providing roadway improvements at one congested choke point (i.e., westbound TC lane from Mast Boulevard to the crest of the hill). When packaged with other MM improvements (i.e., transit improvements), there would be an additional increase in reliability for all of the build alternatives. Additionally, Alternatives 1, 2, and 4 would provide additional roadway improvements that would further increase reliability. Alternative 2 would provide the greatest increase in reliability, as it would have the following additional improvements: o Improvements at other congested choke points o MLs available to transit, HOVs, and other vehicles willing to pay a fee Alternative 4 would provide the second greatest increase in reliability, as it would have the following additional improvement: o Shoulder running lanes during peak periods Alternative 1 would provide the third greatest increase in reliability, as it would have the following additional improvement: o Improvements at other congested choke points 4-11
73 Chapter 4.0 Alternatives Evaluation Mode Share Compared to the No- Alternative, all of the build alternatives would have mode share similar to regional mode share percentages (i.e., there would be no noticeable change). For the 21,000,000 regional daily trips, for all of the alternatives, regional mode share would be as follows: 53% drive alone trips, 43% carpool trips, less than one percent transit trips, three percent walk trips, and less than one percent bike trips (see Figure 4-5). Compared to the No- Alternative, there would be a shift in modes in the corridor under Alternatives 1, 2, and 4 (see Figure 4-6). Alternative 2 would provide the greatest shift from the drive alone mode to other modes (i.e., 3,400 fewer drive alone trips and 3,800 additional carpool trips), due to the construction of the MLs. Alternative 1 and Alternative 4 would not provide any shifts from the drive alone mode; however, under these alternatives, there would be an additional 100 carpool trips from other modes. There would be no shift in modes under Alternative 3. There would be a mode shift under Alternative 2 3,400 fewer drive alone trips and 3,800 additional carpool trips due to the construction of the managed lanes. 4-12
74 Chapter 4.0 Alternatives Evaluation Figure 4-5. Regional Trips by Mode, ,000,000 71,200 71,100 71,100 71,200 71, , , , , , , , , , ,800 15,000,000 9,040,000 9,040,100 9,043,800 9,040,000 9,040,100 10,000,000 5,000,000 11,162,000 11,162,000 11,158,600 11,162,000 11,162,000 Bike Walk Transit Carpool 0 No- Alternative Alternative 1 Alternative 2 Alternative 3 Alternative 4 Drive Alone 4-13
75 Chapter 4.0 Alternatives Evaluation 4,000 Figure 4-6. Mode Shifts, Compared to No- Alternative 3,000 2,000 1,000 +3, ,000-2,000-3,000-3,400 Drive Alone Carpool Transit Walk Bike -4,000 Alternative 1 Alternative 2 Alternative 3 Alternative
76 Chapter 4.0 Alternatives Evaluation Improvements to Transit and HOV Mobility Compared to the No- Alternative, Alternatives 1 to 4, when packaged with other MM improvements, would provide improvements to transit (i.e., bus on shoulder on SR 52 and TSP on Mission Gorge Road). Under Alternative 4, these improvements could be reduced slightly, as both vehicles (e.g., single-occupancy vehicles [SOVs] and HOVs) and buses would use shoulder running lanes during peak periods. Additionally, Alternative 2 would provide improvements to HOV mobility, as it would have the following roadway improvement: Transit, HOVs, and other vehicles willing to pay a fee can utilize the MLs. 4-15
77 Chapter 4.0 Alternatives Evaluation Congestion Relief This criterion considered five measures of congestion relief: freeway under capacity, travel time, daily hours of congested conditions, person-hours of delay saved, and arterial LOS. For this criterion, travel time is the only measure derived using the Aimsun model all other measures were derived using the SANDAG model. Alternative 4 would provide the greatest amount of overall congestion relief, due to the shoulder running lanes that would operate from Mission Gorge Drive to I-805 during peak periods only. Alternative 2 would provide the second greatest amount of overall congestion relief, due to the number of roadway improvements, including MLs. Alternative 1 and Alternative 3 would provide congestion relief benefits as well. The five measures are discussed below. Freeway under Capacity Under the No- Alternative, the GP lanes would operate under capacity (i.e., have a V/C ratio less than 10%) at 52% during the AM peak hour (PH) and 53% during the PM PH. Compared to the No- Alternative, Alternatives 1 to 4 would increase the percentage of GP lanes operating under capacity during the AM and PM PHs (see Figure 4-7). Alternative 4 would provide the greatest increase, due to the shoulder running lanes that would operate from Mission Gorge Drive to I-805 during peak periods only. Alternative 2 would provide the second greatest increase, due to a number of roadway improvements throughout the corridor, including an expansion of the San Diego River bridge (from four to six GP lanes). Additionally, this alternative would provide MLs, relieving congestion on the GP lanes by shifting traffic to the MLs. Alternative 1 would provide the third greatest increase, due to roadway improvements in the corridor, including an expansion of the San Diego River bridge (from four to six GP lanes). Alternative 3 would provide the fourth greatest increase. 4-16
78 Chapter 4.0 Alternatives Evaluation Figure 4-7. Freeway under Capacity, % 90% 80% 70% 48% 47% 24% 26% 12% 22% 29% 33% 11% 5% 60% 50% 40% 30% 20% 10% 52% 53% 76% 74% 88% 78% 71% 67% 89% 95% Greater than 100% Less than 100% 0% AM PH PM PH AM PH PM PH AM PH PM PH AM PH PM PH AM PH PM PH No- Alternative Alternative 1 Alternative 2 Alternative 3 Alternative 4 Notes: AM PH = AM peak hour; PM PH = PM peak hour 4-17
79 Chapter 4.0 Alternatives Evaluation Travel Time Based on microsimulation AM peak travel times for WB SR 52, WB Mast Boulevard, and NB I-805 are summarized in Table 4-1. For SR 52 segments, AM and PM peak travel times are summarized in Table 4-1 and Table was not evaluated in the microsimulation since it is the ultimate regional project and consistent with regional policies for managed lanes. As the ultimate regional project, 2 provides managed lanes in addition to all of the improvements included the other alternatives. Therefore it provides the most capacity along the corridor of all of the alternatives and is assumed that 2 would operate very well. Compared to the No- Alternative, Alternative 1, Alternative 3, and Alternative 4 would reduce travel time in the AM peak period on WB SR 52 and WB Mast Boulevard (see Table 4-1). On SR 52 (as shown in Table 4-1 and Table 4-2): Of the alternatives analyzed Alternative 1 would provide the greatest reduction in travel time in both the AM and PM peak periods. Of the alternatives analyzed Alternative 4 would provide the second greatest reduction in travel times in both the AM and PM peak periods. Table 4-1. AM Peak Travel Time: WB SR 52, WB Mast Blvd, and NB I-805 WB SR 52 WB Mast Blvd NB I-805 Alternative No- Alternative Alternative 1 Alternative 3 Alternative 4 SR 67 to Mast Blvd Mast Blvd to I-15 I-15 to I- 805 Total Carlton Hills Blvd to SR 52 SR 52 to Nobel Dr
80 Chapter 4.0 Alternatives Evaluation Alternative Table 4-2. PM Peak Travel Time: EB SR 52 I-805 to I- 15 I-15 to Mast Blvd EB SR 52 Mast Blvd to SR 67 Total No- Alternative Alternative Alternative Note: Alternative 3 was excluded, as it does not include roadway improvements on EB SR 52 Daily Hours of Congested Conditions Under the No- Alternative, there would be approximately 3.15 and 3.75 hours of congestion per day in the westbound and eastbound directions, respectively. Compared to the No- Alternative, all of the build alternatives would reduce daily hours of congestion (see Figure 4-8). Figure 4-9 shows the same data in minutes of congested conditions. Alternative 4 would provide the greatest reduction (in both directions), due to the shoulder running lanes that would operate from Mission Gorge Road to I-805 during peak periods only. Alternative 2 would provide the second greatest reduction (in both directions), due to a number of roadway improvements throughout the corridor, including an expansion of the San Diego River bridge (from four to six GP lanes). Additionally, this alternative would provide MLs, relieving congestion on the GP lanes by shifting traffic to the MLs. Alternative 1 and Alternative 3 would each provide reductions (in both directions) as well. 4-19
81 Chapter 4.0 Alternatives Evaluation Figure 4-8. Daily Hours of Congested Conditions, No- Alternative Alternative 1 Alternative 2 Alternative Alternative 4 Westbound Eastbound Figure 4-9. Daily Minutes of Congested Conditions, Minutes No- Alternative Alternative 1 Alternative 2 Alternative Alternative 4 Westbound Eastbound 4-20
82 Chapter 4.0 Alternatives Evaluation Person-Hours of Delay Saved in the Highest One Hour Peak Although not shown in Table 4-3, Alternative 2 is assumed to be the most effective for improving Person-Hours of delay saved. It was not analyzed in the microsimulation model, since modeling the ultimate conditions would involve a more detailed model that is out of the scope of the project. It assumes that since the ultimate would provide for the most robust system of managed lanes and other freeway improvements, it would provide the greatest benefit. As shown in Table 4-3, Alternative 1 would provide the second greatest total savings at 2,939 person-hours saved in the AM peak and 3,812 person-hours saved in the PM peak. Alternative 4 would provide 2,709 person-hours saved in the AM peak and 364 person-hours saved in the PM peak. Of the three build alternatives, Alternative 3 would provide 2,217 person-hours saved. Table 4-3. Person-Hours of Delay Saved AM Peak Hour PM Peak Hour SR 52 WB Mast Blvd I-805 NB SR 52 EB Person- Hours SR 67 to Mast Mast Blvd to I-15 I-15 to I-805 Carlton Hills Blvd to SR 52 to Nobel SR 67 to Mast Mast Blvd to I-15 I-15 to I-805 Saved 1,2 Blvd SR 52 Dr Total Blvd Total No Alternative 2216 (420) (340) 2, ,812 Alternative (23) (247) , Alternative (196) ,709 3 (992) Alternative 4 Notes: Person-Hours Saved are compared to the No- Alternative 2 Numbers in parenthesis represent a decrease in person-hours saved as a result of an increase in travel time 4-21
83 Chapter 4.0 Alternatives Evaluation Arterial LOS Under the No- Alternative, of the arterial roadway segments analyzed, approximately 90% (1.24 miles) would operate under capacity (80% or less). Additionally, approximately 10% (0.15 miles) would operate at a level approaching capacity (between 81 and 100%) at the following location: Mission Gorge Road between SR 125 and Fanita Drive Compared to the No- Alternative, there would be no changes under Alternatives 1 to 4 (see Table 4-4). Table 4-5 provides a more in-depth summary of arterial roadway V/C ratios by segment. As shown in Table 4-5, Mission Gorge Road between SR 125 and Fanita Drive would be the only arterial roadway segment operating at a level approaching capacity, under all of the alternatives. V/C Ratio Table 4-4. Summary of Arterial Roadway V/C Ratios, 2035 Length (Miles) No- Alternative Alternative 1 Alternative 2 Alternative 3 Alternative 4 0% to 80% % to 100% %
84 Chapter 4.0 Alternatives Evaluation Table 4-5. Summary of Arterial Roadway V/C Ratios, 2035 Segment Length Capacity 1,2 V/C Ratio Street From To (Miles) No- Alternative Alternative 1 Alternative 2 Alternative 3 Alternative 4 Magnolia Ave EB SR 52 WB SR ,000 74% 74% 74% 74% 74% Off-Ramp On-Ramp Kearny Villa Rd EB SR 52 WB SR ,000 74% 75% 74% 74% 75% Ramps Ramps Santo Rd EB SR 52 WB SR ,000 18% 17% 18% 18% 17% Ramps Ramps Fanita Dr Mission EB SR ,000 37% 35% 34% 37% 35% Gorge Rd On-Ramp Convoy St EB SR 52 WB SR ,000 40% 41% 42% 40% 41% Ramps Ramps Cuyamaca St EB SR 52 WB SR ,000 68% 68% 67% 68% 68% Ramps Ramps Mast Blvd EB SR 52 WB SR ,000 47% 46% 45% 47% 46% Ramps Ramps Mast Blvd WB SR 52 West Hills ,000 71% 72% 71% 71% 72% Ramps Pkwy Mission Gorge EB SR 52 WB SR ,000 53% 51% 53% 53% 51% Rd Off-Ramp On-Ramp Mission Gorge WB SR 52 SR ,000 47% 46% 49% 47% 46% Rd On-Ramp Mission Gorge Rd SR 125 Fanita Dr ,000 93% 92% 92% 93% 92% Notes: 1 LOS E capacities from Table 2 in the SANTEC / ITE Guidelines for Traffic Impact Studies (TIS) in the San Diego Region (SANTEC/ITE, 2000) 2 Roadway classifications obtained from the City of Santee General Plan 2020 (City of Santee, 2003) for roadways within the City of Santee. Classifications for roadways within the City of San Diego were obtained from the mobility element of each respective community plan. 4-23
85 Chapter 4.0 Alternatives Evaluation 4.3 Summary of Results The results of the screening analysis are summarized in Table 4-6. This table shows the results of each build alternative, compared to the No- Alternative. Based on the screening analysis, Alternative 2 performs the best. Alternatives 1 and 4 are second in performance, followed by Alternative 3 (third in performance). Table 4-6. Screening Results: Alternatives Compared to No- Alternative Criterion Alternative 1 Alternative 2 Alternative 3 Alternative 4 1 Consistency with the Regional Plan 2 Near Term Implementation 3 Environmental Impacts 4 Capital Costs 5 VMT 6 Person Throughput 7 Reliability 8 Mode Share 9 Improvements to Transit and HOV Mobility 10 Congestion Relief Better No Change Worse than No- from No- than No- 4-24
86 Chapter 4.0 Alternatives Evaluation THIS PAGE INTENTIONALLY LEFT BLANK 4-25

87 Chapter 5.0 Public Outreach 5.0 PUBLIC OUTREACH 5.1 Summary of Efforts The WSP Parsons Brinckerhoff team led public outreach efforts to provide and gather information about the study, including the alternatives. The outreach effort provided an opportunity to gain a local perspective about the study relating to the improvements, existing conditions (e.g., congestion hot-spots ), and any other observations related to the study corridor. The outreach efforts also provided an opportunity to build consensus between local residents, jurisdictions, businesses, and others members of the public, offering additional perspective beyond that of the TWG. The public outreach plan consisted of the following three components: Webpage and social media Public workshops Webpage The webpage consisted of an interactive Google map that allowed public comments to be submitted both electronically and geographically, as shown in Figure 5-1. A total of 98 online comments were received. The webpage was promoted through electronic messages ( s/newsletter) that was distributed to community organizations and other interested parties along the corridor. The webpage was live and open for comments from September 15, 2015 to March 22, Figure 5-1. Daily Webpage Comment Tool and Social Media and social media updates were used to notify the public about the study and public workshops. A comprehensive distribution list, which included local community groups and interested members of public, was maintained and was used for the 5-1
88 Chapter 5.0 Public Outreach notifications. There were 105 people on the notification list. An example is provided in Appendix E. Public Workshops Two public workshops (shown in Figure 5-2) were held to discuss the study. The first workshop was held at Santee City Hall on February 22, 2016 and the second workshop was held at the Tierrasanta Recreation Center on March 3, The purpose of the workshops was to provide an opportunity for interested stakeholders to learn about the alternatives and provide input on solutions to best improve mobility in the study corridor. The meeting began with a presentation, then transitioned to an open house format, where attendees were allowed to view detailed boards and discuss the alternatives with City of Santee and WSP Parsons Brinckerhoff staff. SANDAG staff also was on hand to provide input and assist in answering questions. Workshop materials included the following: Study overview and purpose Existing conditions in the study corridor Framework and criteria for evaluating solutions High level concepts of each alternative Next steps in study process Overview of workshop and input we are seeking Public input was collected at the various stations, including the E-comment station that included laptops connected to the online comment tool webpage. The stations included large boards with concept maps to illustrate the proposed improvements. Participants were able to review information presented in stations regarding each improvement concept and were asked to share any comments, suggestions, or opinions they have on sticky notes. A total of 43 comments were collected at the public workshops. The first workshop garnered an article published in the San Diego Union Tribune. The second workshop was attended by three local news representatives (i.e., KUSI, CBS, NBC), who reported the study during the evening news on the day of the workshop. 5-2


89 Chapter 5.0 Public Outreach Figure 5-2. Public Workshops Note: From top to bottom: Public Workshop #1 and Public Workshop #2 5.2 Summary of Comments The public comment period was open from September 15, 2015 to March 22, A total of 141 comments were received, with the majority of comments submitted through the webpage. The comments are summarized below and provided in Appendix E. The comments were grouped into nine topics, with many comments covering multiple topics. Figure 5-3 and Figure 5-4 show the resulting analysis of the comments and the breakdown of the comments into specific topics. As expected, the Freeway Capacity topic received the highest number of comments and the highest percentage of comments. Under the Misc topic, comments discussed areas outside of the study corridor (e.g., SR 67), identified specific locations for the multi-modal improvements (e.g., park-and-ride lots and variable message signs), and discussed other topics (e.g., funding and staggered school times). 5-3
90 Chapter 5.0 Public Outreach 60 Figure 5-3. Number of Comments by Topic Figure 5-4. Percent of Comments by Topic 1% 2% 18% 10% 13% Carpool Lanes Trucks Local Road Capacity Bridge Capacity 5% Freeway Capacity 13% Transit Ramp Meters 31% 7% Active Transportation Misc 5-4
91 Chapter 6.0 Funding Strategies 6.0 FUNDING STRATEGIES This chapter identifies funding strategies to implement or advance improvements in the study corridor that would improve SR Tolling Analysis The Regional Plan includes ML and ML connector projects on SR 52, noted as having capital costs of $610 million (2014$) (see Appendix D). These projects are listed as revenue constrained projects and are planned to be built by TransNet II (TransNet extension approved in 2004) has assigned $71 million (2015$) towards the ML improvements, as noted in the potential funding measure Expenditure Plan. 2 Table 6-1 shows the SR 52 projects in the Regional Plan and the total unfunded amount that could be funded by toll revenue. This section looks at the possibility of advancing the ML project or implementing a toll road project, using the adjusted net toll revenue to fund either project prior to The adjusted net toll revenue is the amount of potential funding that could be used to support financing (i.e., toll revenue bonds). This analysis is based on an understanding that all potential toll revenue is directly related to future traffic volumes, which could be influenced by future technologies, like the deployment of autonomous vehicle technology. Table 6-1. SR 52 Ultimate Project Funding Required Capital Cost TransNet II Item Limits Capital Cost (2014$) 1 (2016$) 2 Funds (2016$) 3 2 ML I-805 to I-15 $91,000,000 $93,000,000 2 ML (Reversible) ML Connector ML Connector I-15 to SR 125 $298,000,000 $304,000,000 SR 52 and I-15 (West to North and South to East) SR 52 and I-805 (West to North and South to East) $130,000,000 $133,000,000 $71,000,000 $91,000,000 $93,000,000 $42,000,000 TOTAL $622,200,000 $113,000,000 TOTAL UNFUNDED $509,200,000 1 Capital Cost (2014$) from the Regional Plan 2 Capital Cost (2016$) escalated from the Regional Plan (2014$) 3 TransNet II Funds (2016$) escalated from 2015$ SANDAG Board of Directors Meeting Agenda, April 29, The Expenditure Plan as presented at the April 29, 2016 SANDAG Board of Directors Meeting. 6-1
92 Chapter 6.0 Funding Strategies Methodology To estimate toll revenue, a regional travel demand model (i.e., the SANDAG Series 12 Model) was used. Based on WSP Parson Brinckerhoff s previous experience involving the use of travel demand models and toll optimization models (e.g., RapidTOM) for conceptual level toll revenue forecasting, on projects such as the SR 78 Corridor Study, it has been shown that revenue forecasts generally are within an order of magnitude of +/- 20 to 25% using a regional travel demand model or +/- 5 to 10% using a toll optimization model (e.g., RapidTOM), compared to actual revenue. The use of the regional travel demand model was deemed sufficient for the level of analysis and revenue projections required for this study since results would fall within an acceptable range and therefore analysis by a toll optimization model, such as RapidTom, was not used. As such, the estimated adjusted net toll revenue provided in Section notes that toll projection values have a margin of error within +/- 20%. This section describes the methodology used to estimate toll revenue, including the model runs developed, as well as the toll fees, toll revenue calculations, and toll revenue adjustments used. The toll fees and toll revenue adjustments used for this study are consistent with regional documents related to tolling, including the SR 78 Corridor Study (SANDAG, 2012), based on the experience of SANDAG operating the I-15 Express Lanes and information derived from other toll facility operations Traffic Forecasts The SANDAG Series 12 Model was used to generate traffic forecasts, which were then used to estimate toll revenue. From the SANDAG Series 12 Model, the following model runs were developed: 2025 ML Model Run 2035 Toll Only (TO) Model Run 2050 ML Model Run Each model run provided traffic volumes for the specified year and toll facility. 3 The 2035 TO Model Run is the only model run that includes the implementation of a toll road instead of the planned MLs, representing the maximum amount of possible toll revenue Toll Fees The following toll fees, from the SR 78 Corridor Study and the 2050 Regional Travel Demand Model Documentation (SANDAG, 2011), were assumed: $0.26 per mile in the peak period and $0.10 per mile in the off-peak period. Additionally, it was assumed that toll fees would be collected for 250 days per year (i.e., 5-day weekdays and 50 weeks). 3 The Regional Plan contains two types of toll facilities: 1) MLs that charge a fee for use by single occupancy vehicles (SOVs) and 2) toll roads where tolls are charged for all vehicles using the facility. 6-2
93 Chapter 6.0 Funding Strategies Toll Revenue Calculations For all model runs except the 2035 TO Model Run, daily toll revenue was calculated as follows: Daily Toll Revenue (Peak Periods) = ML SOVs x ML Miles x $0.26 Daily Toll Revenue (Off-Peak Period) = ML SOVs x ML Miles x $0.10 where: ML SOVs = Daily SOVs on a ML link ML Miles = Length of the ML link For the 2035 TO Model Run, the daily toll revenue calculations were similar to those shown above except, instead of ML SOVs or daily SOVs on ML link, all daily vehicles (e.g., SOVs and HOVs) on the TO link would be charged toll fees, during both peak and off-peak periods. For the ML option, toll revenue per year was interpolated between the 2025 and 2050 data points based on the 2025 ML Model Run and the 2050 ML Model Run, respectively. For the toll road option, the toll revenue per year was then adjusted based on the 2035 TO Model Run. In Section 6.1.2, the estimated adjusted net toll revenue is presented for two scenarios: 25 Years (2025 to 2050) using MLs 25 Years (2025 to 2050) using a Toll Road Toll Revenue Adjustments Toll revenue adjustments were made to account for revenue leakage, toll ramp up factors, and toll operations and maintenance (O&M) costs. The estimated adjusted net toll revenue includes these adjustments. Revenue Leakage Revenue leakage includes tolls that are not paid, as well as any users that are exempt from paying tolls, such as enforcement and emergency vehicles. To account for revenue leakage, toll revenue was reduced by 15% (for MLs) or 10% (for toll road). A higher rate was used for MLs because enforcement is more complex (i.e., HOVs are exempt from paying tolls). Toll Ramp up Factors Toll ramp up factors were assumed, which allow users to become comfortable with using the toll facilities (e.g., obtain FasTrak transponders). In Year 1 (2025), 85% of users were assumed. In Year 2 (2026), 95% of users were assumed. Years following assumed 100% of users. Toll O&M Costs Toll O&M costs include the following: 6-3
94 Chapter 6.0 Funding Strategies Highway O&M Costs include roadway maintenance related to flexible pavement, drainage, cleaning, and other standard roadway maintenance activities performed by Caltrans. Approximately 25 lane miles (20 miles for MLs and 5 miles for ML connectors) were assumed. Enforcement and Toll Collection Equipment Costs include violation enforcement systems (e.g., camera-based automatic license plate recognition) and automatic vehicle identification systems (e.g., communication with each vehicle to charge a fee). Toll Collection Backend Operating Costs include toll processing, technical services, telecommunications, administration, marketing, transaction costs, banking fees, credit card fees, and violation enforcement processing. Toll Equipment Maintenance Costs include maintenance costs for toll equipment, such as variable message signs. Currently, the regional practice is to use tolls collected from a toll facility to operate and maintain the toll facility and to help provide transit service in the corridor. Toll O&M costs are shown in Table 6-2. Toll revenue was reduced by $691,000 per year to account for toll O&M costs. Table 6-2. Toll Operations & Maintenance Costs (2016$) Category Units Cost Highway O&M Costs Per lane mile per year $5,657 Enforcement and Toll Collection Equipment Costs Per year $113,141 Toll Collection Backend Operating Costs Per trip per year $1.13 Toll Equipment Maintenance Costs Per year $260,224 TOTAL Per year $691,000 Estimated Adjusted Net Toll Revenue Over the course of 25 years (2025 to 2050), the estimated adjusted net toll revenue is approximately $156 million using MLs and $212 million using a toll road, as shown in Figure 6-1 and Figure
95 Chapter 6.0 Funding Strategies Figure 6-1. Estimated Toll Revenue: Managed Lanes (2016$) $8,000,000 $7,000,000 $6,000,000 $5,000,000 $4,000,000 $3,000,000 $156 Million $2,000,000 $1,000,000 $ Figure 6-2. Estimated Toll Revenue: Toll Road (2016$) $10,000,000 $9,000,000 $8,000,000 $7,000,000 $6,000,000 $5,000,000 $4,000,000 $212 Million $3,000,000 $2,000,000 $1,000,000 $- 6-5
96 Chapter 6.0 Funding Strategies A breakdown of the estimated adjusted net toll revenue, by ML and toll road segment, is provided in Table 6-3, as well as Figure 6-3 to Figure 6-6. Table 6-3. Estimated Toll Revenue, 2025 to 2050 (2016$) Managed Lanes Toll Road I-805 to I-15 I-15 to SR 125 Total I-805 to I-15 I-15 to SR 125 Total Total Unadjusted $46,610,000 $127,750,000 $174,360,000 $67,350,000 $162,810,000 $230,150,000 Toll Revenue 1 Total Revenue Leakage $30,000 $90,000 $120,000 $20,000 $60,000 $80,000 Total Toll O&M Costs $6,610,000 $11,350,000 $17,960,000 $6,610,000 $11,350,000 $17,960,000 Total Adjusted Net Toll Revenue 1, 2, 3 $39,970,000 $116,310,000 $156,280,000 $60,720,000 $151,400,000 $212,110,000 1 Includes ramp up factors (Years 1 and 2) 2 Includes revenue leakage (15% for MLs and 10% for toll road) 3 Includes toll O&M costs The estimated total toll revenue range is provided in Table 6-4 taking into consideration of the margin of error of +/- 20%. Although this estimated total toll revenue may not fully fund toll facilities in the study corridor, it could be leveraged into additional funds. Table 6-4. Estimated Total Toll Revenue Range, 2025 to 2050 (2016$) Managed Lanes Toll Road Lower Range Upper Range Lower Range Upper Range TOTAL $125,024,000 $187,536,000 $169,688,000 $254,532,000 Bonding Capacity Estimate Toll revenue bonds are typical financial instruments that allow for the use of toll revenues to be used to pay for infrastructure improvements. In this case, the construction of the ML or Toll Road improvements to the corridor would be financed and secured through bond issuance paid for by the projected ML and Toll revenues. Typically the rates for these instruments are 3.5% to 4.5% and the terms are 20 to 25 years. In order to estimate the amount that could be financed, a calculation was done showing the loan payments over the life of the 25 year loan and including a 2% escalation in revenues per year due to inflation. This increase per year would help pay down the loan. The total projected 25 year ML and Toll revenues were used as the basis for the calculation. Table 6-5 shows the possible bonding capacity available for 6-6
 Total (2025-2050) Term/Rate Total Managed Lanes $156,000,000 25 yr/3.5% $131,700,000 Toll Road $212,000,000 25 yr/3.")

97 Chapter 6.0 Funding Strategies construction of the ML and Toll road improvements based on a term of 25 years at 3.5% annual interest rate. Table 6-5. Estimated Bonding Capacity (2016$) Total ( ) Term/Rate Total Managed Lanes $156,000, yr/3.5% $131,700,000 Toll Road $212,000, yr/3.5% $179,000,000 Table 6-6 shows the difference between the potential bonding capacity and the total estimate for the construction of the improvements. Table 6-6. Estimated Difference in Construction Dollars (2016$) Total Funds Needed $509,200,000 1 Total Bonding Capacity $179,000,000 Total Difference $330,200,000 Note: 1 See Table 6-1 for total ultimate project costs Figure 6-3. Estimated Toll Revenue: Managed Lane I-805 to I-15 Segment (2016$) $2,500,000 $2,000,000 $1,500,000 $1,000,000 $40 Million $500,000 $- 6-7
 $6,000,000 $5,000,000 $4,000,000 $3,000,000 $2,000,000 $116 Million $1,000,000 $- Figure 6-5.")
98 Chapter 6.0 Funding Strategies Figure 6-4. Estimated Toll Revenue: Managed Lane I-15 to SR 125 Segment (2016$) $6,000,000 $5,000,000 $4,000,000 $3,000,000 $2,000,000 $116 Million $1,000,000 $- Figure 6-5. Estimated Toll Revenue: Toll Road I-805 to I-15 Segment (2016$) $3,500,000 $3,000,000 $2,500,000 $2,000,000 $61 Million $1,500,000 $1,000,000 $500,000 $- 6-8