Dr. Claudette Spiteri
|
|
|
- Helen Candice Flynn
- 5 years ago
- Views:
Transcription


1 Dr. Claudette Spiteri
2 1. General context Indicators MSFD & indicators 2. Indicator development Process Pan European Regional Seas National Content Descriptors Criteria Indicators Monitoring parameters Environmental Targets Maritime Indicators 3. Shortcomings 4. Way forward
3 What is an indicator? is a measure, generally quantitative, that can be used to illustrate and communicate complex environmental phenomena in a simple manner, including trends and progress over time.. EEA Guide Core Set of Indicators, General Context
4 Address clearly the policy question Measurement Accurate Simple to measure Existing data Available at reasonable cost/benefit ratio Responsive to changes in environment and anthropogenic activities Tightly linked in time & space cause-effect Sensitive detection vs background Responsive early-warning Specific response primarily to human pressure 1. General Context
5 5

6 Marine Strategy Framework Directive (MSFD) adopted in July 2008 EU s legal instrument for the protection of our seas development of Marine Strategies/Action Plans by MS a coordination exercise across Europe ecosystem-based approach to managing human activities achieving or maintaining GES Good Environmental Status is the environmental status of marine waters where these provide ecologically diverse and dynamic oceans and seas which are clean, healthy and productive General Context
7 Member States sharing a marine region...shall cooperate to ensure that... the measures required to achieve...this Directive...are coherent and coordinated across the marine region...

8 The EU shares the responsibility for the management of the regional seas with non-eu countries such as the12 countries in the Mediterranean Sea and 4 countries in the Black Sea..
9 Water Framework Directive (WFD, 2000/60/EC) Habitats Directive (HD, 92/43/EEC) Birds Directive (BD, 2009/147/EC) Nitrates Directive (ND, 91/676/EEC) Dangerous Substances Directive (as amended 2006/11/EC) Shellfish Waters Directive (2006/113/EC) Bathing Waters Directive (2006/7/EC) MSFD establishes a regulatory structure that is intended to bind together a broad range of EU secondary legislation, regional and internal agreements..

10 MSFD management cycle GES 1. General Context
11 Good environmental status shall be determined at the level of the marine region or subregion... on the basis of the qualitative descriptors in Annex I. For each qualitative descriptor, there are a number of defined criteria for assessing progress towards GES and related indicators (COM Decision 2010/477/EU)

12 Human Pressures Pressurerelated criteria State-related criteria Impact-related criteria
13 ` ` Marine Strategy Framework Directive Directive 2008/56/EC of the European Parliament and of the council of 17 June 2008 establishing a framework for community action in the field of marine environmental policy Task group reports on criteria & methodological standards for MSFD descriptors
14 Marine Strategy Framework Directive Directive 2008/56/EC of the European Parliament and of the council of 17 June 2008 establishing a framework for community action in the field of marine environmental policy Task group reports on criteria & methodological standards for MSFD descriptors Commission Decision of 1 September 2010 on criteria and methodological standards on good environmental status of marine waters (2010/477/EU) Commission Staff Working Paper on Relationship between the initial assessment of marine waters and the criteria for good environmental status (SEC(2011)1255) 1. General Context
15 Overall assessment of marine regions Aggregation 3 Assessment of 11 descriptors Aggregation 2 Assessment of 29 criteria Aggregation 1 Assessment of 56 indicators 2. Indicator Development Modified from Krause et al., 2011
16 Descriptor Criteria Indicators 1. Biodiversity Non-indigenous species Commercially exploited fish and shellfish Food webs Eutrophication Seafloor integrity Hydrographical conditions Contaminants Contaminants in fish and other seafood Marine Litter Energy/Noise Indicator Development Comm. Decision 2010/477/EU
17 Comm. Decision 2010/477/EU Descriptor 1 Biological diversity is maintained. The quality and occurrence of habitats and the distribution and abundance of species are in line with prevailing physiographic, geographic and climate conditions. Criteria 1.1 Species distribution Indicators Distributional range Distributional pattern Area covered by the species (for sessile/benthic species) 1.2 Population size Population abundance and/or biomass 1.3. Population condition 1.4. Habitat distribution Population demographic characteristics Population genetic structure, where appropriate Distributional range Distributional pattern. 2. Indicator Development
18 Comm. Decision 2010/477/EU Descriptor 4 All elements of the marine food webs, to the extent that they are known, occur at normal abundance and diversity and levels capable of ensuring the long-term abundance of the species and the retention of their full reproductive capacity. Criteria 4.1. Productivity (production per unit biomass) of key species or trophic groups 4.2. Proportion of selected species at the top of food webs 4.3. Abundance/distribution of key trophic groups/species Indicators Performance of key predator species using their production per unit biomass (productivity) Large fish (by weight) Abundance trends of functionally important selected groups/species
19 Comm. Decision 2010/477/EU Descriptor 5 Human-induced eutrophication is minimised, especially adverse effects thereof, such as losses in biodiversity, ecosystem degradation, harmful algal blooms and oxygen deficiency in bottom waters. Criteria 5.1 Nutrients levels 5.2 Direct effects of nutrient enrichment 5.3 Indirect effects of nutrient enrichment Indicators Nutrients concentration in the water column Nutrient ratios (silica, nitrogen and phosphorus), where appropriate Chlorophyll concentration in the water column Water transparency related to increase in suspended algae, where relevant Abundance of opportunistic macroalgae Species shift in floristic composition such as diatom to flagellate ratio Abundance of perennial seaweeds and seagrasses Dissolved oxygen, i.e. changes due to increased organic matter decomposition and size of the area concerned
20 Comm. Decision 2010/477/EU Descriptor 8 Concentrations of contaminants are at levels not giving rise to pollution effects Criteria 8.1. Concentration of contaminants 8.2. Effects of contaminants Indicators Concentration of the contaminants measured in the relevant matrix (such as biota, sediment and water) in a way that ensures comparability with the assessments under Directive 2000/60/EC Levels of pollution effects on the ecosystem components concerned, having regard to the selected biological processes and taxonomic groups where a cause/effect relationship has been established and needs to be monitored Occurrence, origin (where possible), extent of significant acute pollution events (e.g. slicks from oil and oil products) and their impact on biota physically affected by this pollution
21 Comm. Decision 2010/477/EU Descriptor 10 Properties and quantities of marine litter do not cause harm to the coastal and marine environment. Criteria 10.1 Characteristics of litter in the marine and coastal environment Impacts of litter on marine life Indicators Trends in the amount of litter washed ashore and/or deposited on coastlines Trends in the amount of litter in the water column (including floating at the surface) and deposited on the seafloor Trends in the amount, distribution and, where possible, composition of micro-particles (in particular micro- plastics) Trends in the amount and composition of litter ingested by marine animals (e.g. stomach analysis) 2. Indicator Development
22 Comm. Decision 2010/477/EU & Comm. Staff Working Paper SEC(2011)1255) Descriptor 1 Biological diversity is maintained. The quality and occurrence of habitats and the distribution and abundance of species are in line with prevailing physiographic, geographic and climate conditions. Criteria 1.1 Species distribution 1.2 Population size 1.3. Population condition 1.4. Habitat distribution. 2. Indicator Development Indicators Distributional range Distributional pattern within the latter, where appropriate Area covered by the species (for sessile/benthic species) Population abundance and/or biomass, as appropriate Population demographic characteristics Population genetic structure, where appropriate Distributional range Distributional pattern. Pressure State Impact
23 Comm. Decision 2010/477/EU & Comm. Staff Working Paper SEC(2011)1255) Descriptor 5 Human-induced eutrophication is minimised, especially adverse effects thereof, such as losses in biodiversity, ecosystem degradation, harmful algal blooms and oxygen deficiency in bottom waters. Criteria 5.1 Nutrients levels 5.2 Direct effects of nutrient enrichment. Indicators Nutrients concentration in the water column Nutrient ratios (silica, nitrogen and phosphorus), where appropriate Chlorophyll concentration in the water column Water transparency related to increase in suspended algae, where relevant Abundance of opportunistic macroalgae Species shift in floristic composition such as diatom to flagellate ratio.. Pressure State Impact
24 Comm. Decision 2010/477/EU & Comm. Staff Working Paper SEC(2011)1255) Descriptor 10 Properties and quantities of marine litter do not cause harm to the coastal and marine environment. Criteria 10.1 Characteristics of litter in the marine and coastal environment Impacts of litter on marine life 2. Indicator Development Indicators Trends in the amount of litter washed ashore and/or deposited on coastlines Trends in the amount of litter in the water column (including floating at the surface) and deposited on the seafloor Trends in the amount, distribution and, where possible, composition of micro-particles (in particular microplastics) Trends in the amount and composition of litter ingested by marine animals (e.g. stomach analysis) Pressure State Impact


25 Descriptor 1: Biological Diversity 2. Indicator Development Zampoukas et al., 2012

26 Descriptor 5: Eutrophication Zampoukas et al., Indicator Development

27 Descriptor 10: Marine Litter Zampoukas et al., Indicator Development
28 The next step towards achieving good environmental status should be the establishment of environmental targets and monitoring programmes for ongoing assessment Indicator Development

29 ...a qualitative or quantitative statement on the desired condition of the different components of, and pressures and impacts on, marine waters in respect of each marine region or subregion set directly in relation to the 11 Descriptors and their related criteria and indicators 2. Indicator Development
30 Types State-based indication of physical, chemical or biological condition mostly relevant to Descriptors Biodiversity (D1), Commerical Fish & shellfish (D3), Food webs (D4) and Seafloor integrity (D6) e.g. At least 30% of fish (by weight) should be greater than 40 cm in length (OSPAR, EcoQO) Pressure-based articulate the desired or acceptable level of a particular pressure which would not prevent the achievement or maintenance of GES more easily related to management measures e.g. Fishing mortality is at levels consistent with MSY 2. Indicator Development
31 Types Impact-based indication of the acceptable level of impact on components of the marine environment arising from a particular/range of pressures e.g. Annual by-catch of harbour porpoises should be reduced to below 1.7% of the best population estimate Operational allow for the assessment of progress towards full implementation of a specific measure e.g. to reduce by 2021 the input of nitrogen and phosphorus by x tonnes (HELCOM Baltic Sea Action Plan) 2. Indicator Development
32 Desciptor 5: Human-induced eutrophication is minimised,... GES descriptors: High level, generic across Europe 5.1 Nutrients levels 5.2 Direct effects of nutrient enrichment 5.3 Indirect effects of nutrient enrichment GES Criteria: Characteristics of what GES means in each MS Targets: Further reduce riverine inputs of nutrients Reduce nutrient inputs via long-range transport from other marine areas Further reduce atmospheric inputs of nutrients Indicators: Nutrient concentrations at the transition from freshwater to marine environment in the river mouth Spatial distribution of nitrogen and phosphorus in sea water Emissions of nitrogen species Deposition of nitroegen species on the sea surface GES Targets & Indicators: If targets are met, GES should be achieved 2. Indicator Development

33 Reduction of discharges and losses of N and P to problem areas reported for 2005 relative to It is not possible to compare directly the reductions achieved by OSPAR countries owing to differences in periods over which the reduction r measures where applied and different methods to calculate reductions. OSPAR QSR, 2010
34 Desciptor 10: Marine litter does not cause harm to the coastal and marine environment GES descriptor: High level, generic across Europe 10.1 Characteristics of litter in the marine and coastal environment 10.2 Impacts of litter on marine life means in each MS GES Criteria: Characteristics of what GES means in each MS Targets: X % of overall reduction in the volume of litter Less than 10 % of sea birds having more than 0.1 g plastic particles in their stomach Indicators: Trends in the amount of litter washed ashore and/or deposited on coastlines Trends and composition of micro-particles (in particular micro- plastics) GES Targets & Indicators: If targets are met, GES should be achieved 2. Indicator Development
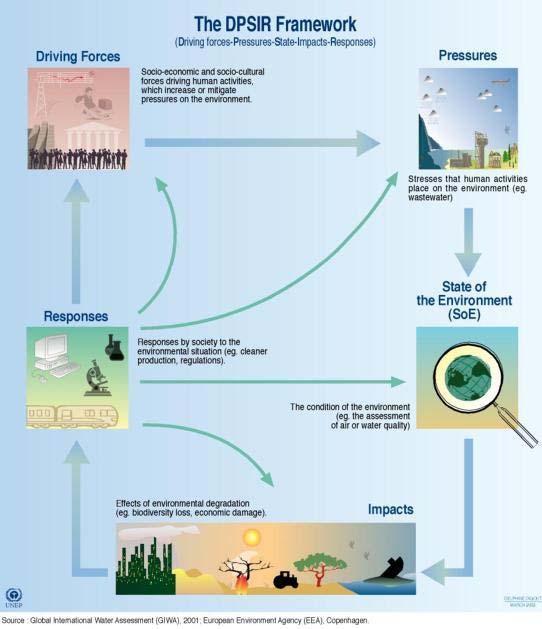
35 Maritime activities as a cross-cutting issue Initial assessment also includes an economic and social analysis of the use and of the cost of degradation of the marine environment Strongly linked to socio-economic activities shipping, ports offshore wind energy coastal tourism Focus on Drivers of DPSIR 2. Indicator Development
36 What are the socio-economic benefits provided by maritime and coastal activities? What are the environmental costs (pressures) associated with activities? What are the cumulative pressures arising from maritime and coastal activities? How do these questions differ/compare across MSFD marine regions? 2. Indicator Development
37 MSFD Descriptor Maritime & coastal activities 1. Biodiversity Shipping; ports; tourism and recreation; Ecologic, Germany Author: Manuel Lago 2. Marine invasive species Shipping; aquaculture; tourism and recreation 3. Fisheries Fisheries 4. Food web Fisheries 5. Eutrophication Shipping; tourism; oil and gas production; waste water treatment 6. Seafloor integrity Fisheries; shipping and; tourism and recreation; coastal infrastructure; marine aggregates 7. Hydrography Coastal infrastructure 8. Contaminants Shipping and ports 9. Contaminants in fish Shipping and ports; tourism and recreation and seafood for human consumption 10. Marine litter Shipping and ports; fisheries; aquaculture; tourism and recreation 11. Noise Shipping and ports; fisheries; offshore wind energy production; oil and gas production; dredging 2. Indicator Development
38 Indicator development difficult to find indicators which are directly linked to a descriptor and to management measures different indicators require different spatial & temporal scales biodiversity, food web versus seafloor integrity and eutrophication collection of marine data is expensive use indicators which can be based on existing data collection programmes use of different types of targets (S,P,I..) coherance required for determining GES and establishing targets at regional/sub regional level insufficient knowledge about marine ecosystems 3. Shortcomings
39 Coherent and holistic assessment of GES improved scientific knowledge Limited knowledge on a number of indicators noise, hydrography.. cumulative pressures & impacts EU research programme to address these knowledge gaps e.g. PERSEUS 3. Shortcomings
40 Basis of GES assessment Structured/systematic but complex process Complex issues/knowledge gaps Requires streamlining at 3 levels National => Regional => European Follow-up actions 4. Way Forward MSFD phases & actions Inventory of information reported in IAs Establish appropriate targets & associated Indepth assessment indicators incl. indicators Proposals for way forward Timing Assessment of GES in EU waters 2012 Determination of GES Establish monitoring programmes 2014 Development of programme of measures 2015 MSFD implementation Achievement of GES 2020

41 Questions? Thanks you for your attention!