Hydrologic Restoration via LID Retrofit Tracy Fanara, Ph.D. UCOWR Annual Conference, Henderson NV June 18, 2015
|
|
|
- Gloria Cobb
- 5 years ago
- Views:
Transcription

1 Hydrologic Restoration via LID Retrofit Tracy Fanara, Ph.D. UCOWR Annual Conference, Henderson NV June 18, 2015

2 Integration Taking Research In Water Treatment Groundwater Hydrology Surface Water Hydrology Land Development Public Perception Along With Market Demands Economics Policy To Make A Smarter Product Urbanization is inevitable, but there is a more environmentally responsible way to approach development design.
3 Rules of Land Development Historically 1.Get rid of the water 2.Get rid of the water 3.Get rid of the water
4 Need for Change Population and Urbanization Continue to Increase Groundwater Levels Drop Shift From Groundwater To Surface Water Decreasing Quality Increase In Potential for Sinkholes Water Quality, Clarity, and Levels of Local Springs Have Dropped (Alachua County, 2015) 100% of Potable Water Is From Groundwater in Alachua County Has the Damage Been Done, or Can We Restore Pre-Development Subsurface Hydrology Through Low Impact Design Retrofit?
5 What is LID? Low Impact Development: A stormwater management approach and set of practices that uses natural systems to reduce runoff and pollutant loadings by managing the runoff as close to its source(s) as possible, with A goal of maintaining or closely replicating the predevelopment hydrology of the site.


6 Why LID? LID Saves cost in infrastructure LID removes nutrients, pathogens, and metals from stormwater LID reduces peak flows, therefore, reduces erosion, pollutant loading, temperature shock to biology, flooding Encourages the Natural Water cycle of evapotranspiration and infiltration
7 Research Objectives 1. ANALYZE EXISTING CONDITIONS Of The Lake Alice Watershed 2. DESIGN A PROPOSED PROJECT For LID Retrofit 3. MODEL PRE, EXISTING AND PROPOSED CONDITIONS With The Integrated Model, MIKE SHE To Combine Surface And Groundwater Processes 4. DETERMINE LID POTENTIAL By Finding The Maximum LID Scenario 5. ANSWER THE RESEARCH QUESTION: Can LID Retrofit Restore Pre-development Hydrological Conditions?
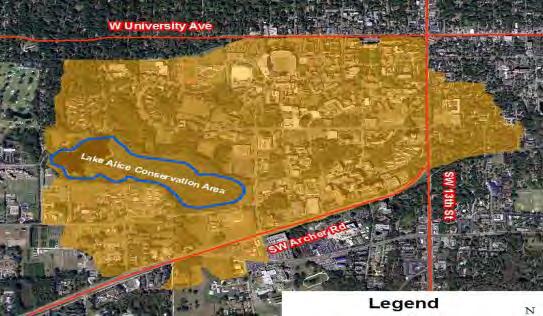
8 Existing Conditions at the University of Florida


9 Aerial of the University of Florida Injection to Floridan Aquifer High Nutrient Loading
 Year Total Rainfall Average Rainfall Maximum Rainfall 2000 34.35 0.09 3.65 2001 42.14 0.12 2.36 2002 55.33 0.15 2.89 2003 46.62 0.13 2.51 2004 58.37 0.")
10 Climate Average Yearly Rainfall= 45.4 inches Average Yearly Potential Evapotranspiration*= 40.2 inches Average Yearly Irrigation= 5.6 inches Gainesville Yearly Precipitation (in) Year Total Rainfall Average Rainfall Maximum Rainfall

11 Overland Flow- Topography and River Network

12 Land Use Weighed Average Pavement Coefficient= 0.49

13 Unsaturated Zone- Soils

14 Saturated Zone- UFA Initial Potential Head
15 Subsurface Cross-Section (not to scale)
16 Proposed Retrofit Design at the University of Florida


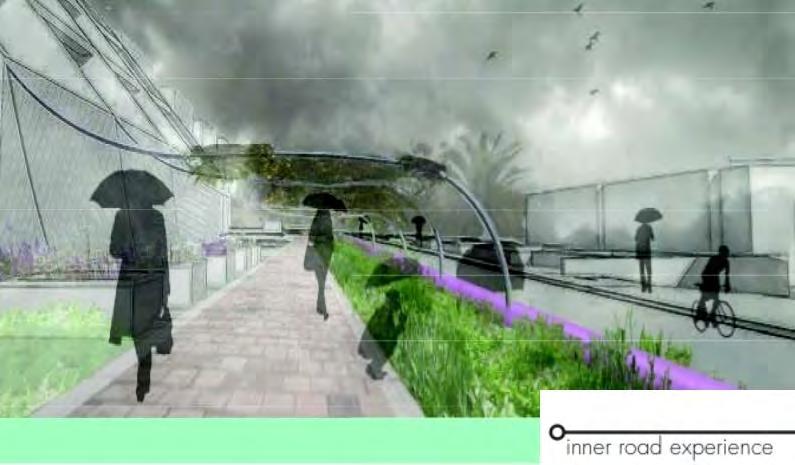
17 Two Projects, One Goal EPA Rainworks Challenge 2012 Reitz Union Lawn Retrofit EPA Rainworks Challenge 2013 (Three Phase Project) Yulee Pit Retrofit Gator Pond and Bioswale Retrofit Inner Road Retrofit

18 Protecting Lake Alice Opportunities


19 Campus Outreach Surveys to find circulation routes used most, what the public likes, and what they would like to see on campus


20 Proposed Retrofit Sites Jenning s Creek Inner Road Reitz Union Lawn Yulee Pit Gator Pond


21 Proposed LID Location


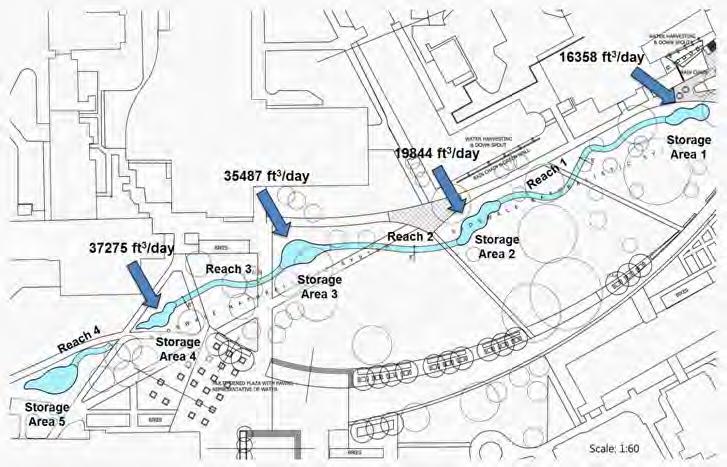
22 Rainworks 2012 Proposed Retrofit


23 Rainworks 2013 Proposed Retrofit
24 MIKE SHE Model Calibration
25 Why MIKE SHE? It Is The Only Completely Integrated Surface And Groundwater Model On The Market Other Models Considered: ICPR3 SWMM StormCAD ArcHydro Tools

26 Model Calibration and Verification- Discharge
27 MIKE SHE Model Overland Results

28 Existing vs Proposed LID Lake Alice Water Level Average Reduction in LA Normal Pool Volume: 3.6 acre-ft

29 Existing vs Proposed LID Lake Alice Discharge Volume Reduction: 42.4% Peak Flow Reduction: 41.2%
30 MIKE SHE Model Subsurface Results
31 Pre, Existing, & Proposed LID Subsurface Results Infiltration (ft) UF Accumulated Infiltration from Overland to UZ Pre-Development Infiltration Existing Infiltration Proposed LID Infiltration Year Proposed Design 6% Increase in Infiltration Recharge to SZ (ft) Total Accumulated UFRecharge to SZ from OL and UZ Pre Total Recharge Existing Total Recharge Proposed Total Recharge Year Proposed Design = 10% increase in Recharge to SZ
32 Pre, Existing, and Proposed LID SZ Storage SZ Storage (ft) Pre SZ Storage Existing SZ Storage Proposed SZ Storage Total Saturated Zone Storage Proposed Design= 5.5% Increase in SZ storage 61% Decrease in SZ Storage from Pre-Dev Year
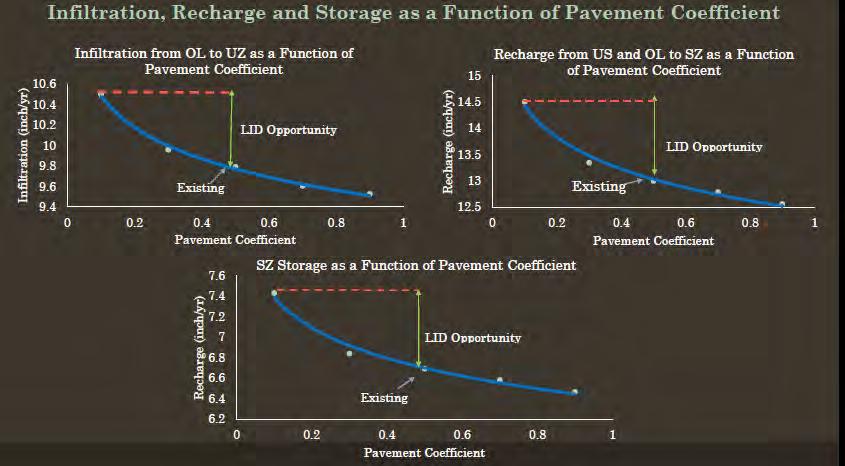
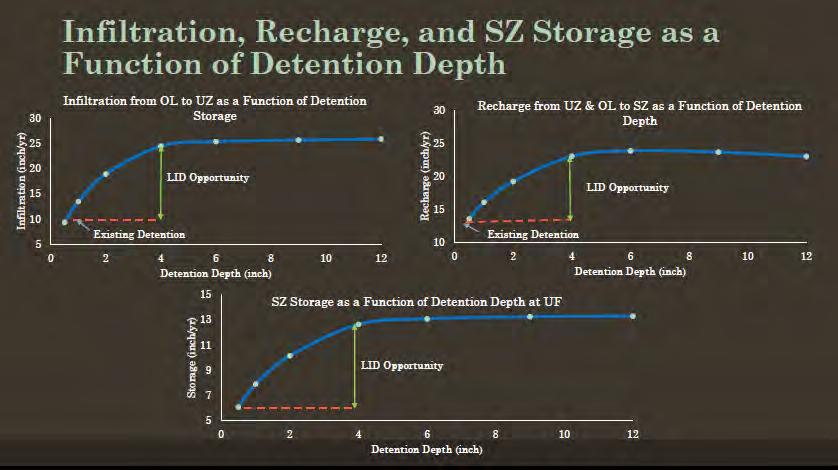
33 Max LID Scenario: Subsurface Hydrology as a Function of Site Parameter 12 Iterative Models were Run to Determine the Relationship of Site Infiltration, Recharge, and Saturated Zone Storage, with: Pavement Coefficient ( ) Detention Storage (0.5inches-1ft)
34 UZ &
35
36 Max LID Scenario Modification from Existing Conditions: 1. The Pavement Coefficient to 0.1 (90% of Impervious Disconnected) 2. Add 4inches of Detention Throughout the Watershed Area (352 acre-ft Coincidence?)
37 Infiltration (ft) Year Infiltration and Recharge Results with Max LID Scenario UF Accumulated Infiltration from Overland to UZ Pre-Development Infiltration Existing Infiltration Proposed LID Infiltration Max LID Infiltration Year Proposed Design 6% Increase in Infiltration LID Opportunity 60% Increase Recharge to SZ (ft) Total Accumulated UFRecharge to SZ from OL and UZ Pre Total Recharge Existing Total Recharge Proposed Total Recharge Max LID Recharge Year Proposed Design 10% Increase in Infiltration LID Opportunity increase recharge 41%
38 10 Year Saturated Zone Storage with Max LID Scenario 3.5 Pre SZ Storage Total Saturated Zone Storage 90% Recovery to Pre-Development Conditions!!! 3.0 Existing SZ Storage SZ Storage (ft) Proposed SZ Storage Max LID SZ Storage Proposed Design= 5.5% increase in SZ storage LID Opportunity 61% Increase in SZ Storage Year
39 Conclusions Proposed Rainworks Challenge Designs Will Make a Substantial Impact to Surface Hydrology Relieving Streams of High Peak Flows & Velocities Improving Saturated Zone Storage by 5.5% Pre- Development Hydrology Can Be Achieved Up To 90% within the Lake Alice Watershed, Through 90% of Impervious Disconnection Addition of 4 inches of Detention Throughout Campus

40 Recommendations Implement Proposed Designs Disconnect 90% Impervious to Detention 4 Inches of Detention through Green Roofs, Exfiltration Trenches, Downspouts/Cisterns, Pervious Pavement, Rain Gardens, etc. Lobby UF President for UF to Become the Pioneer of Institutional Sustainable Design If this doesn t work, continue this model by using the detention and pavement coefficient relationships, along with the addition of hydraulic and quality components to quantify quality benefits of potential projects the University will consider
41 How Will Projects Like These Be Funded? By Connecting Hydrology with: Human Health Economics This is the direction of the Environmental Health Research Program at Mote Marine Laboratory
42 South Florida Environmental Stressors Stressors: Urbanization Agricultural Chemical Use Increased Water Demand Pollutant Loads: Phosphorus, Nitrogen, Mercury, Copper, Wastewater, Pesticide, Fungicide, and Fertilizer Chemicals Rainfall Implications: Eutrophication and Harmful Algae Blooms Ecological Impacts of lakes, wetlands, estuaries Impacts to Aquatic Life Impacts to Drinking Water Sources Impacts to Groundwater and Soil Quality Dark water What Needs to be Done: Full Chemical Monitoring Implementation of Low Impact Development Develop and Use Chemical Removal Techniques for Pesticides, Fertilizer, and other Stressors Treat at Source *Stormwater is the #1 non-point source of pollution

 To prevent flooding, runoff was")
43 Lake Okeechobee Releases January 2016, SFWMD saw 9.18 of rainfall ~476% Ave Jan. Rainfall Southwest Coast of Florida received of rainfall ~counties over 300% Ave. 3.9 were experienced within three days (January 26 th -29 th ) To prevent flooding, runoff was back-pumped to Lake O to protect local communities and agriculture to the south Lake O raised 10 in water level
, along with runoff from the watershed increased flow to")
 The introduction of organic matter, tannins, and other chemicals from runoff was captured in an")
44 Lake Okeechobee Releases Outflows directed to the Caloosahatchee River and St. Lucie River/San Carlos Bay (12% of total flow), along with runoff from the watershed increased flow to the Caloosahatchee River (4.2 bgd) The introduction of organic matter, tannins, and other chemicals from runoff was captured in an aerial photograph of Sanibel showing dark water entering the ocean that quickly became popular on social media

45 Lake Okeechobee Releases- Current Status SWFWMD: Caloosahatchee Estuary Inflow Nutrient Loads: Basin Runoff accounted for 69% of flow and 68% of TN load Lots of room for LID improvement in the Caloosahatchee Watershed!
46 Future Research of Mote Environmental Health Program Pesticide & Fertilizer Studies on Environmental/Human Health Stormwater Treatment Technology Stormwater Management and Public Outreach Hydrological and Chemical Transport Impacts to Ecology and Drinking Water Sources as Well as Human Health (Lake O Releases, Everglades Restoration/Periphyton)

47 Questions?
 140 Reitz Union (Ground El.")


48 Saturated Zone Head 140 Yulee Pit (Ground El.. 118ft) 140 Reitz Union (Ground El. 149ft) Northeastern Campus Ground El. 165ft Lake Alice (Ground El. 70ft)
49 Pre-Development Model Pre Development Assumes Prior to All Development on Site Existing Topology is used Urban Land Use is Restored to Hardwood Hammock and Swamp Detention Storage is Changed to Reflect Lower CN Soil Type Remains, however Urban/Millhopper is Millhopper, and Saturated Moisture Content is Restored to Pre-Compacted Condition
50 Conclusion Pre-development Hydrology Is Best Achieved By Techniques Which Reduce Soil Compaction, Disconnect Impervious Surfaces, And Allow For Natural, Slower, Surface Water Flow, Infiltration, And Bio-degradation, EX: Conservation Design- Cluster Development, Open Space Preservation, Reduced Pavement Widths Infiltration Practices- Infiltration Trenches And Basins, Pervious Pavement, Disconnection By Downspouts, Vegetated Treatment Systems Such As Rain Gardens Runoff Storage Practices- Parking Lot/Street Storage, Rain Barrels And Cisterns, Depressional Storage, Green Roofs Runoff Conveyance Practices- Elimination Of Curb And Gutter, Grasses Swales, Rough Surfaces, Long Flow Paths, Check Dams
51 Data References Topography- UF Facilities and Planning Precipitation and Evapotranspiration- FAWN and UF Physics Building Irrigation Data- UF Physical Plant (via Dr. Mark Clark) Land Use Data- UF Facilities and Planning and FGDL LAI, Root Depth, Kc-(Zhao, 2012), National Land Cover Dataset (Kalyanapu, 2009) Mannings M- National Land Cover Dataset (Kalynanapu, 2009), TR-55 Soil Data- NRCS Hydraulic Conductivity and Saturated Moisture Content- Florida Soils Characterization Database, 2007 and (Tuller, VanGenutchen Properties) Dispersivity- (E. Perfect, 2002) Saturated Zone Characteristics- NEF (SJRWMD Northeast Florida Groundwater Model), CH2MHill, 2005 Kh and Kv- CH2MHill, 2005 Potentiometric Surface- FGDL point file for UFA, NEF Report for verification and SAS Potentiometric Surface Specific yield and Specific Storage (Sy and Ss)- (Boulding, 2003), (Rawls, 1983), (GeoTrans Inc, 2004)