Paul Eger Minnesota Department of Natural Resources Division of Lands and Minerals September 2010
|
|
|
- Merry Fields
- 5 years ago
- Views:
Transcription

1 Paul Eger Minnesota Department of Natural Resources Division of Lands and Minerals September 2010
2 What are constructed treatment wetlands? Why would you use them? Questions to ask Data needs Types of wetlands Mine drainage Performance Example Dunka Mine

3 Man made Built to remove contaminants Wide variety of removal processes Generally not designed to recreate natural wetlands Used to treat mine water in US for several decades

4 Lower cost, lower maintenance alternative to standard chemical treatment


5 Active Requires ongoing human operations, and maintenance Based on external sources of energy using infrastructure and engineered systems Passive Processes do not require regular human intervention Employs natural construction material, natural materials and promotes natural vegetation Gravity flow Global Acid Rock Drainage (GARD) Guide, 2009

6 A perfect passive system would operate indefinitely with no maintenance


7 Is a wetland appropriate? Is this the right design? Is the wetland big enough to handle changes over time? How long will it treat? Substrate disposal? Consistent compliance? Any ecological impacts?
8 Fundamental mechanisms of wetlands function Characteristics of the water being treated Chemistry Flow Site characteristics (Climate and Topography) Removal rates Regulatory Limits
9 Abiotic Settling & sedimentation Sorption Chemical Oxidation & Reductionprecipitation Photo oxidation Volatilization Biotic Aerobic or anaerobic Biodegradation/ Biotransformation Phytoaccumulation Phytostabilization Rhizodegradation Phytodegradation Phytovolatilization
10 Surface Flow (SF) Subsurface Flow (SSF)
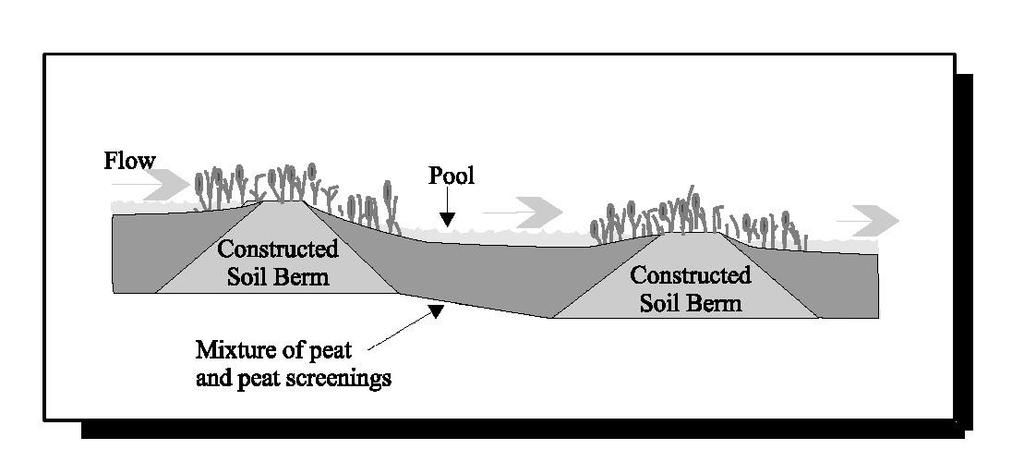
11 Surface Flow Wetland Water flows above the substrate Contaminants predominantly removed by aerobic processes Inflow Control Structure Wetland Plants Effluent Collection System Outflow Control Structure Flow 2-12 Influent Distribution System Organic Substrate Liner To Pond or Receiving System
12 Subsurface Flow Wetland Water flows surface through substrate Horizontal Vertical Influent Inflow Control Structures Planting Substrate Water Level Outflow Control Structures Influent Distribution System Treatment Media (gravel, sand, soil) Hydraulic Gradient Liner Effluent Collection System To Receiving System

13 Water contacts rock containing reactive minerals Primarily iron sulfides Impacts in US ~ 12,000 miles rivers/streams ~ 180,000 acres of lakes Mine waste stockpiles
14 Net Acid: Acidity> Alkalinity Generally ph < 6 Subsurface wetland Net Alkaline: Acidity< Alkalinity ph > 6 Surface or Subsurface wetland
15 Parameter Coal Mine Drainage Metal Mine Drainage Net Acid Net Alkaline Net Acid Net Alkaline ph Acidity , ,000 0 Sulfate 1,000 10, ,000 1,000-10, Iron 100 1,000 < ,000 <10 Aluminum 10 1,000 < < 1 Manganese < < 2 Copper ND 1 ND Zinc ND 5 ND 10-1, Cadmium ND ND Lead ND ND Except for ph all concentrations are in mg/l ITRC Technical and Regulatory Guidance Document for Constructed Treatment Wetlands
16 Parameter Coal Mine Drainage Metal Mine Drainage Typical removal efficiencies ph >6 >6 Acidity 75-90% 75-90% Sulfate 10-30% 10-30% Iron % % Aluminum 90+% 90+% Copper NM % Zinc NM % Cadmium NM % Lead NM % Typical removal efficiencies

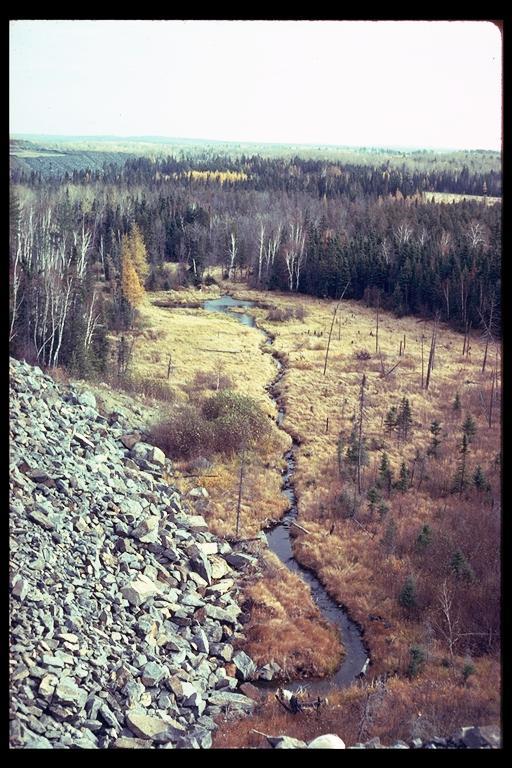
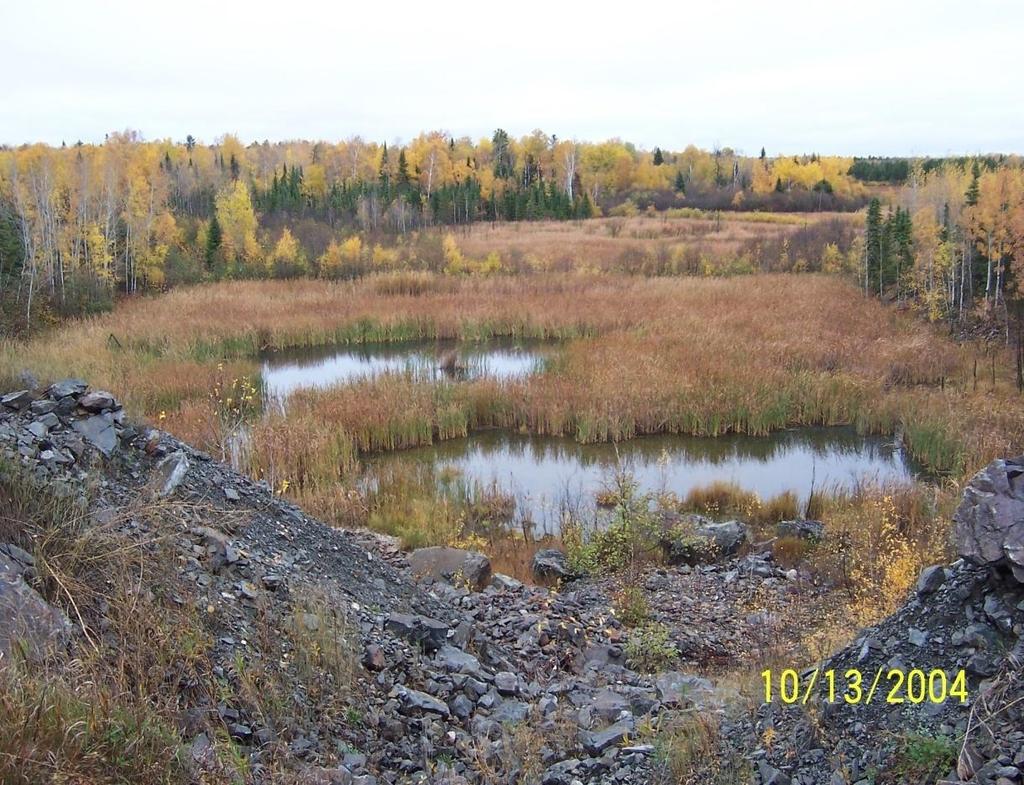
17 Dunka Mine

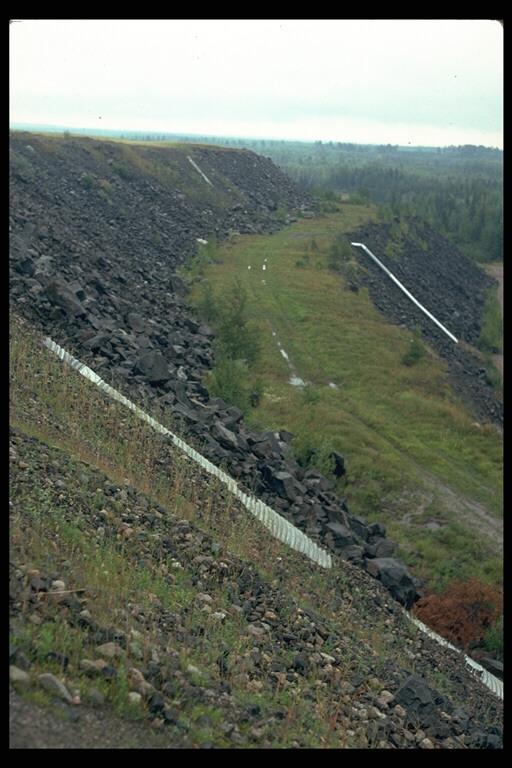
18 Waste rock stockpiles

19 Virginia Formation Mineralized Zone Dunka Pit Duluth Complex Giants Range Granite

20 Duluth Complex, Copper-Nickel Deposit Fresh sulfides Oxidized sulfides
21
22 5 major seeps Flow Average L/min ph Generally >7 One site ph ~ 5 Trace metal concentrations, mg/l Nickel, ~ 1-10 Copper ~ Cobalt ~ Zinc ~0.01-2
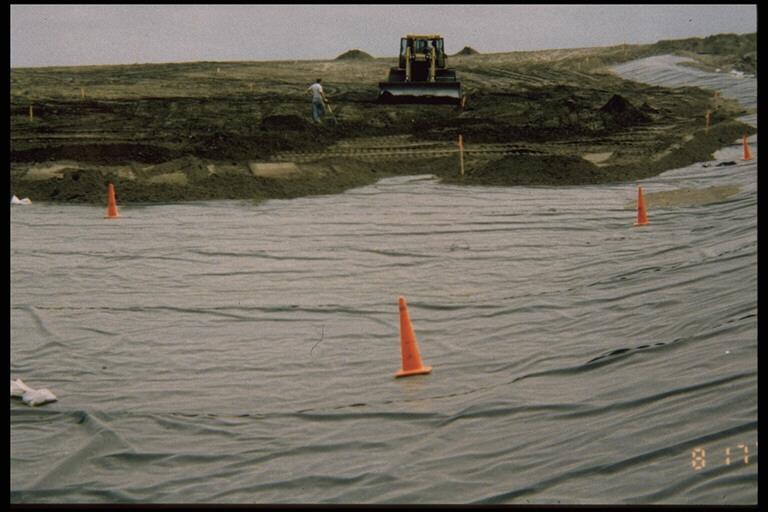
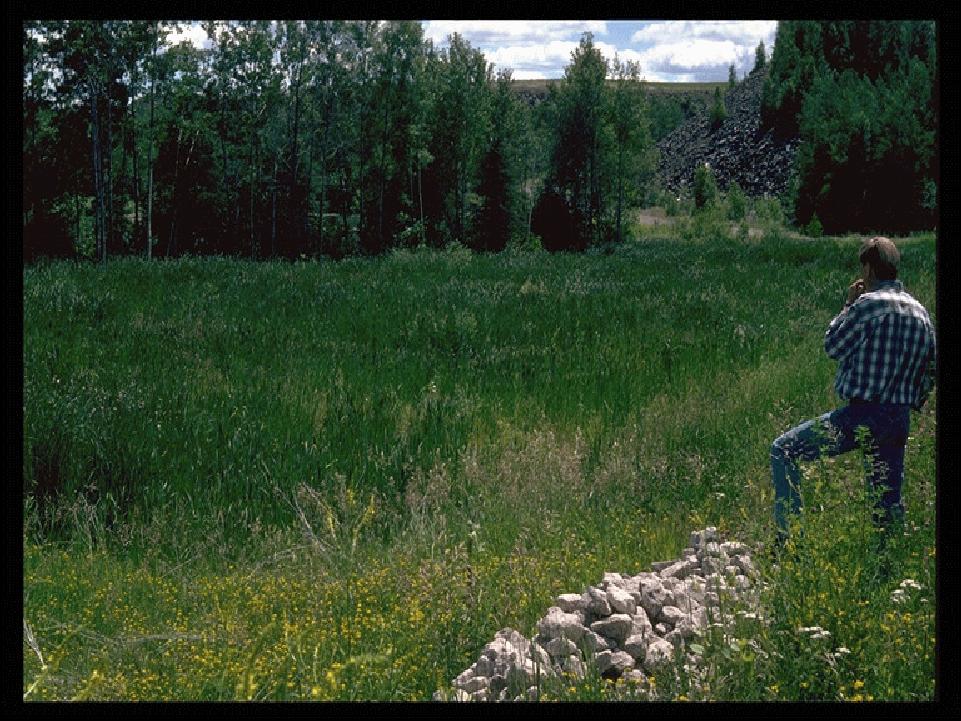
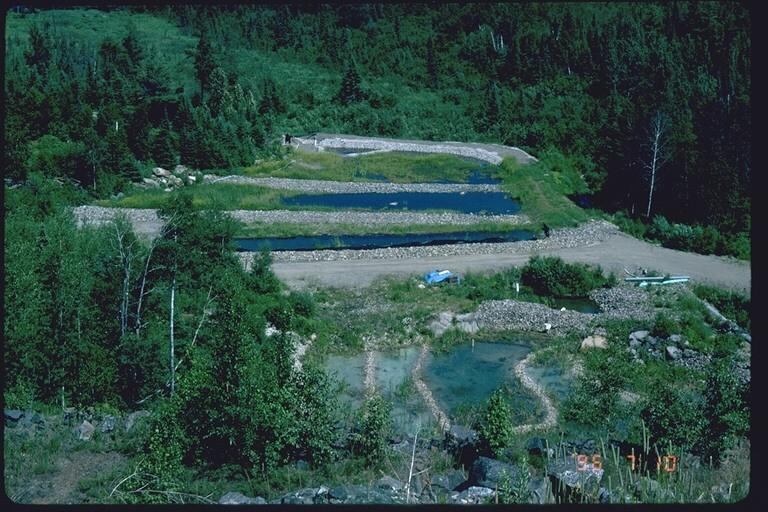
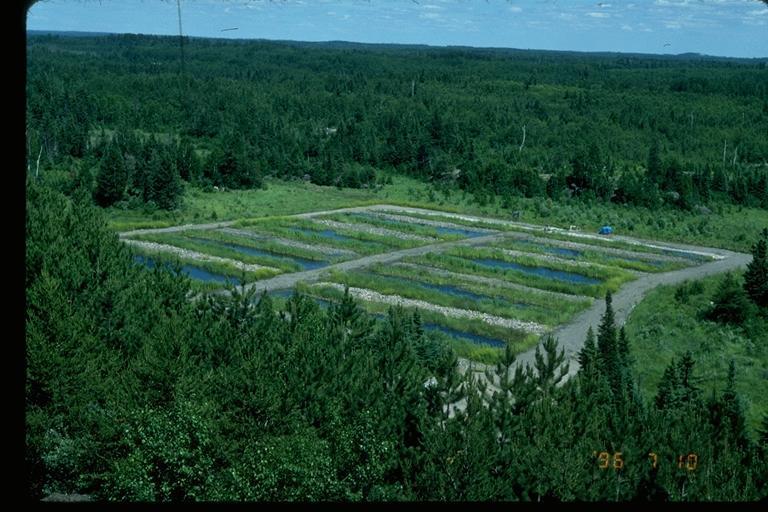
23 Cap stockpiles Limit infiltration Treat residual drainage with wetlands

24
25
26

27 -W2D/3D -W1D -Seep 1 -Seep X - Em 8
28
29

30 Site ph Nickel input Nickel output % removal W2D/3D >90 W1D Seep Seep X Em Average concentrations for , Nickel in mg/l 1 Estimated

31 Metals bound to peat Over 99% in solid phase Tightly bound ~1 2% water extractable
32 Site needed initial 1 as built Final treatment area Needed after closure 1 % final removal W2D/3D >90 W1D Seep Seep X Em Area in square meters 1 Calculated based on areal removal rate 40 mg Ni/m 2 / day Undersized relative to design value
33 Nickel Concentration Nickel versus time W1D wetland outflow inflow Design Value Date

34 Assumptions Model based on nickel accumulation in substrate Removal capacity = 10,000 mg Ni /kg substrate Mass of Active Substrate Total treatment area Density of substrate Removal depth = 20 cm Input of new removal sites

35 Lifetime > 100 years

36