Science and Water Availability Dr. Robert M. Hirsch Associate Director for Water, USGS March 7, 2005
|
|
|
- Merryl Gordon
- 5 years ago
- Views:
Transcription

1 Science and Water Availability Dr. Robert M. Hirsch Associate Director for Water, USGS March 7, 2005 U.S. Department of the Interior U.S. Geological Survey
2 Water Resources Policy is about: Law Economics Environment Investments
3 Water Resources Policy is about: Law Economics Environment Investments True: but to be effective it must be informed by and include Science and Technology
4 Role of science and technology? To obtain maximum economic benefit from our water resources, while respecting environmental values, we need: Technologies that help enhance supply and use resources efficiently Scientific knowledge and tools to inform public and private decisions
5 4 science & technology issues that are critical to water availability Water for ecosystem services Ground water storage depletion Climate change and water storage Supply enhancing technologies

6 What do we know about off-stream water use?


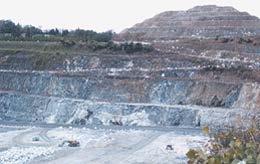
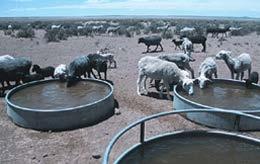
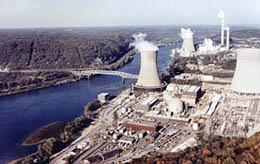


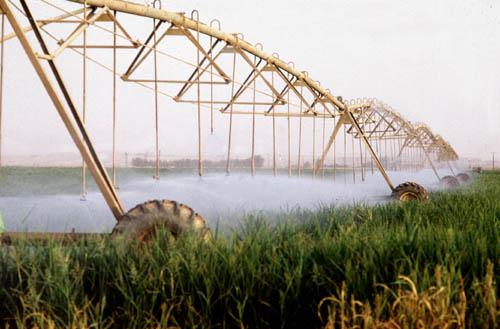
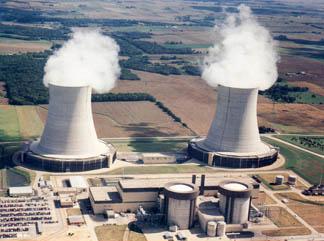
7 Water withdrawals by category Livestock Domestic Public Supply Thermoelectric power Less than 1 percent Less than 1 percent 11 percent 48 percent Less than 1 percent Less than 1 percent 5 percent 34 percent Mining Aquaculture Industrial Irrigation
8 Total withdrawals and population 500 Total withdrawals in BGD 300 Withdrawals U.S. Population in millions Population
9 3 key facts about off-stream water use Water use remains stable despite population growth Chief water uses for the U.S. are power generation and agriculture: both have been stable for 20 years Personal water use is rising, but not faster than population growth


10 What about instream use Ecosystem Services??
11 The Demand for Ecosystem Services is a Major Driver of the Changes in Water Allocations Urban Urban Ecosystem Thermal Farming Farming Thermal
12
13 The biota now has a place at the negotiating table The difficulty in agreeing on what the biota need results in ill-defined property rights, harming all interests
14 When the systems were designed the question was: How much water can we reliably withdraw from the river? Today s question is: How much water do we need to leave in the river? Science was needed then and is needed now
15 Role of Science: Evaluation of Ecosystem Requirements Old paradigm Minimum flow Static channel Surface water Single species New paradigm Whole hydrograph Dynamic channel And ground water Community Lack of answers leads to Gridlock
16 The pie might be shrinking because ground water in storage is being depleted Depletion impacts: Urban Farming Ecosystem Thermal Wells Streamflow Riparian vegetation Subsidence Water quality Future generations

17 Ground water is vital to surface-water systems

18 Influence of pumping on streamflow
19 Streamflow depletion due to ground water development Example: Beaver River near Guymon, OK DISCHARGE, CUBIC DEKAMETERS WATER YEAR


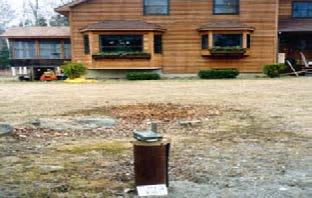
20 Ground-water development leads to changes in riparian vegetation


21 Lake or wetland impacts An example from a Florida lake: before and after ground-water development

22 Scientific need: basin-scale coupled ground-water / surface-water models
23 Ground Water Surface Water Interactions Old paradigm Tens of meters Hours to weeks Withdrawal issues New paradigm Tens of kilometers Months to centuries and ecosystem issues Effective water markets depend on laws that are based on the proper representation of these interactions

24 The pie might be shrinking because climate warming leads to less snow-pack storage Urban Ecosystem Reliable supplies depend on storage: Ground water Farming Thermal Soil water Reservoirs Snow pack

25 Western runoff is earlier Trends in center of mass of runoff
26 In parts of New England, February daily streamflow has increased over the past 1, years STREAMFLOW, IN CUBIC FEET PER SECOND th percentile Median (50th percentile) 75th percentile All trends highly significant (p < 0.01) YEAR Narraguagus River, Maine
27 While May daily streamflow has decreased 5,000 4,000 STREAMFLOW, IN CUBIC FEET PER SECOND 3,000 2,000 1, th percentile Median (50th percentile) 75th percentile All trends highly significant (p < 0.01) YEAR Narraguagus River, Maine
28 And yet: mean annual streamflow shows 1, STREAMFLOW, IN CUBIC FEET PER SECOND No Trend!!! YEAR

29 Understanding snow pack dynamics and climate is crucial to water planning in many areas. This requires long data sets on precipitation, snow pack and streamflow.
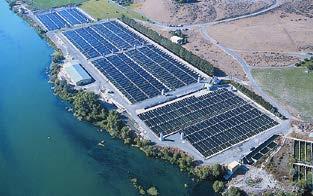
30 The pie might be able to grow if technology provides for an enhanced supply Urban Farming Ecosystem Thermal aquifer storage & recovery water reuse desalinization phreatophyte control water use technologies
31 There are science issues related to these technologies Geochemistry Hydraulics Botany and biophysics Microbiology Wastewater contaminants (transport, reaction, effects) Brine disposal (trace elements)
32 Science and Technology provides the basis for effective management in the face of increasing competition Science provides the context: status and trends of the resource Technology can enhance supplies and efficiency of use Science can provide the basis for smarter decisions through prediction of outcomes (hours to generations into the future)

33 At the request of Congress the USGS has initiated a pilot effort to test concepts for a National Assessment of Water Availability and Use.
34 Answers to some of your questions Future plans for NAWQA Streamgaging Response to Institute evaluations How can the Institutes better help meet national needs
35 National Streamflow Information Program was created in response to congressional concerns Stabilize network long records National backbone Modernize network Harden network Improve data delivery backups R&D for improved efficiency
36 USGS streamgaging since 2002: Progress in some areas, but not all Stabilize network long records National backbone Modernize network Harden network Improve data delivery backups R&D for improved efficiency
37 Trends in long-record streamgages During 1990 s loss rate of about 2% per year Reversed in , many reactivations, net gain of 0.5 % per year Since 2002 returning to loss rates of 1% per year or worse
38 Instability of network 88% of network funding is based on partner involvement Very uneven pattern: major recent losses in Indiana, Mississippi, New Hampshire, and Cumberland River Basin Need NSIP funding for a national backbone network
39 USGS values the Institutes Connects us to academic community: joint ventures Helps us carry out our mission We benefit from well-educated students Focal point for technology transfer, interaction with decision makers, and policy science in addition to natural science and engineering