NEWNES KAOLIN PTY LTD (Trading as Sydney Construction Materials) HYDROGEOLOGICAL IMPACT NEWNES KAOLIN PROPOSED OPEN-CUT
|
|
|
- Annis Copeland
- 5 years ago
- Views:
Transcription
1 Kalf and Associates Pty Ltd 1 NEWNES KAOLIN PTY LTD (Trading as Sydney Construction Materials) HYDROGEOLOGICAL IMPACT NEWNES KAOLIN PROPOSED OPEN-CUT Dr Frans Kalf Kalf and Associates Pty Ltd and Water Research Laboratory UNSW 14 December 2004
2 Kalf and Associates Pty Ltd 2 Contents 1.0 INTRODUCTION Background Objectives Rainfall Topography and Drainage Geology Groundwater Occurrence FIELD INVESTIGATIONS Overview Drilling Investigation Water Quality HYDROGEOLOGICAL INTERPRETATION Head elevations and gradient Groundwater Quality MINING IMPACT ON GROUNDWATER SYSTEM Numerical Model Simulation Mining Simulation Effects of Rocla Quarry FINAL VOID GROUNDWATER CONDITIONS Groundwater flow system before mining Groundwater flow system at the end of mining Groundwater flow system after mining CONCLUSIONS AND CONSIDERATIONS 15 REPORT LIMITATIONS 17 FIGURES APPENDIX DRILLING, HYDRAULIC TESTING AND INSTALLATION OF OBSERVATION BORES (PIEZOMETERS)
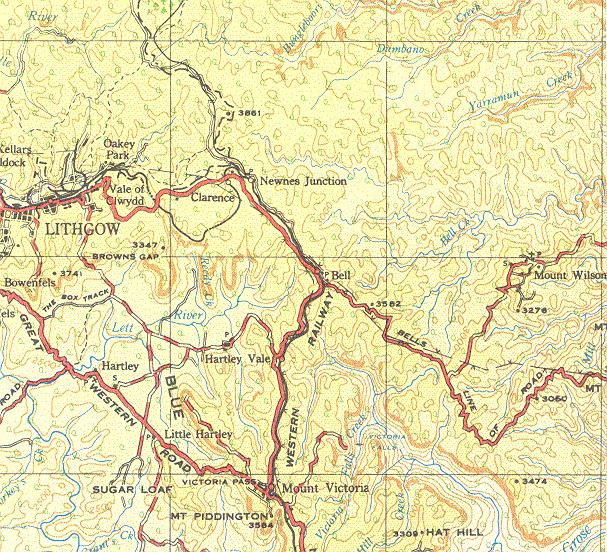
3 Kalf and Associates Pty Ltd INTRODUCTION 1.1 Background Newnes Kaolin Pty Ltd is proposing to mine both sand and kaolin from a proposed pit at Newnes Junction, east of Lithgow (Figure 1.1-1). The proposed pit will be excavated over a 20-year period to a reduced level (RL) of 993m. The kaolin material will be separated out from the crushed sandstone strata. The proposed pit site area lies within hilly topography just north of the existing Rocla Quarry, which has been mining similar material since the late 70 s. This report outlines the hydrogeology of the site and makes an assessment of the potential hydraulic and water quality impacts of the proposed pit during and after mining on the surrounding groundwater system. 1.2 Objectives The specific objectives of this report are to: 1 Interpret the regional hydrogeology of the site based on the outcome of the drilling investigation 2 Determine the potential hydraulic impacts using a numerical modelling method. 3 Indicate possible mining groundwater impacts in the short and longer-term. 1.3 Rainfall Daily rainfall analysis from Lithgow records since 1890 to 2000 indicates an average annual rainfall of 816mm. The mean rainfall from the
4 Kalf and Associates Pty Ltd 4 Newnes Forest Centre is 1072mm, no doubt higher due to orographic effects. At Lithgow average monthly rainfall is highest during the months June to August inclusive and lowest during February. Average monthly rainfall for the two stations is given in Table and below. Table Average Monthly Rainfall - Lithgow Jan Feb Mar Apr May Jun Jul Aug Sep Oct Nov Dec Table Average Monthly Rainfall Lithgow (Newnes Forest Centre) Jan Feb Mar Apr May Jun Jul Aug Sep Oct Nov Dec Topography and Drainage The proposed kaolin mine is located on the south-western edge of the Newnes Plateau along the western boundary of the Wollangambe River catchment. Within the proposed mining area the drainage is predominately towards the north-east. To the south-west, beyond the Old Bells Line road that lies on the surface water divide, the drainage direction is to the south within the Dargans Creek catchment. The drainage divide has elevations up to about 1090 m RL that fall away rapidly to less than 1000 m RL along Dargans Creek. The drainage gullies across the site are largely ephemeral with some seepage evident at lower elevations along the eastern boundary after wet periods.
5 Kalf and Associates Pty Ltd 5 The proposed site area has a elevation of more than RL 1050m along the western boundary falling away to less than RL 1000m at the north-east corner of the site area. 1.5 Geology The mining area lies within the Triassic Narrabeen Group sandstone and shale, which in turn is underlain by the Permian Illawarra Coal Measures, comprised of coal, sandstone, shale and tuff. The upper part of the Triassic sequence at the proposed mining site (based on exposures in the adjacent Rocla quarry and drilling described herein) comprises largely a medium to coarse grained solid sandstone with some ironstone bands. The matrix of the sandstone consists mainly of kaolin and it is this material that will be separated into product as part of the mining process. 1.6 Groundwater Occurrence Groundwater occurs in both primary (limited) and secondary structures in the Triassic sandstone and is supplied entirely by infiltration and recharge. Permeability of the sandstone overall has been found to be low. At Clarence Village some kilometres to the south-west (Figure 1.1-1) from the proposed pit, standing water levels in shallow aquifer system are in the range 12 m to 64 m from ground surface. Topographic surface elevations in this area are in the range 1080 m to 1140 m RL. A number of bores here obtain supplies of several litres per second.
6 Kalf and Associates Pty Ltd Field Investigations 2.1 Overview A field investigation and drilling program was initiated and completed at the site during November 2004 (see the Appendix). The drilling program at three sites around the periphery of the proposed Newnes open-cut pit, included the construction of two holes at each site, one shallow and one deep (Figure 2.1-1). The sites have been designated as the North-West (NW), North-East (NE) and Southern (S) bore (piezometer) sites. The deep bores at each site were drilled to 60 m at the NE and NW sites and 54 m at the southern site S whilst the shallow holes at each site were about 18 m in depth. Airlift, packer and recovery tests were conducted and water samples collected from the deep boreholes. Full details of the field work is given in the Appendix which is an independent report prepared by the Water Research Laboratory UNSW who supervised the drilling programme. 2.2 Drilling Investigation Drilling was completed to a maximum depth of 60 m and encountered solid sandstone at all three sites. Between the southern (S) site at an elevation of about RL 1059m and the north-eastern (NE) site at RL 995m, a sequence 124m in thickness comprised entirely of bedded sandstone was penetrated. All holes provided very little groundwater make during the drilling operations. Borehole NW yielded the maximum bore inflow rate of 6 litres per minute (i.e. ~0.1 L/sec) after completion. At the NE site final airlifting gave a yield of up to 5 litres per minute whilst at the south(s) bore no constant airlift yield was achievable during drilling operations. Although packer testing was carried out the tests are considered to be unreliable because of packer leakage and therefore the permeability
7 Kalf and Associates Pty Ltd 7 derived from these tests overestimate the true values by a substantial amount. The recovery tests subsequently conducted on these bores are considered to be the more accurate and yielded the following permeability values shown in Table The values vary depending on screened interval adopted (see Appendix). Bore NW NE S Table Recovery Test Permeability Permeability (m/d) (36m interval) (18 m interval) 0.11 (5m interval) (8.6 m interval) 0.03 (12m interval) (30 m interval) Water levels recorded in the shallow bores about a week or more after completion, taken prior to water quality sampling of the deep bores are shown in Table The reduced levels are at this stage approximate and rounded to the nearest metre based on topographic contour interpolation. Table Bore Water Levels Bore Water Level (shallow piezometer) m RL NW 1028 NE 982 S 1043
8 Kalf and Associates Pty Ltd Water Quality Water quality analysis of samples taken from the three deep bores indicate groundwater of low salinity with electrical conductivity at holes NW, NE and S measured to be respectively 31, 40.5 and 150 micro- Siemens per centimetre with corresponding ph values of 4.1, 4.4 and Hydrogeological Interpretation 3.1 Head elevations and gradient Figures 3.1-1, show the contoured potentiometric surface based on the measured water levels in the deep and shallow bores respectively. Figure shows the difference in head between these two contoured potentiometric surfaces. The shallow bore water levels indicate a difference in head of about 61m between the S and NE bore locations. The calculated gradient is therefore which is considerable although not unexpected because of the relatively steep topographic gradient in the same general direction. Based on a bulk permeability of 0.02 m/day and porosity of 5% the flow velocity is calculated to be m/day whilst a permeability of 0.05 m/day yields a velocity of about 0.1m/day. For a 50 m metre saturated thickness of sandstone the natural groundwater flow per unit width of sandstone would be about 0.1m 3 /day and 0.25 m 3 /day for these permeability values.
9 Kalf and Associates Pty Ltd Groundwater Quality The drilling results indicate the presence of water bearing zones at various depth intervals of very good quality. The good quality groundwater indicates significant groundwater circulation and recharge in the area. 4.0 Mining Impact on Groundwater System 4.1 Numerical Model Simulation A numerical model was set up to determine the hydraulic impact of mining on the groundwater system. Standing water levels in shallow bores NW, NE and S measured on 24 November 2004 plus the known general topography of the region were used as the basis for simulated initial pre-mining head conditions in the model. The model was set up using an internationally recognized groundwater modelling computer code MODFLOW-SURFACT (MS) with a single layer comprising 100 x 100 of 50 m square cells. To simulate the relatively steep hydraulic gradient to the north-east across the site, boundary line conditions were used in the model. These comprised a constant head boundary line and a flux boundary line to simulate approximately the valley drainage system and groundwater ridge respectively lying to the south-west and a line of constant heads on the north-eastern side of the model representing the drainage system along the Wollangambe River.
10 Kalf and Associates Pty Ltd 10 The shallow bore water levels were then calibrated using trial and error methods under steady state modelling conditions. Two calibrations were setup using uniform permeability values of 0.05m/day and then 0.02 m/day for the model layer. Both simulations used a recharge rate of 8% of the annual rainfall. Each of these separate simulations is discussed below. Case 1: Permeability 0.05m/day Figure presents the steady state calibrated head contours and flow vectors. The flow vectors show the flow direction and relative magnitude by their length. Also shown in this diagram is the outline of the proposed mine site. The model heads are related to the true heads using an offset of 795 m and are given by the relation: True head RL (m) = Model head (m) m Thus a model head of 248 m (at the model bore S for example) is equivalent to a field water level of = 1043 m (i.e. measured at bore S on 24 November 2004). A plot comparing the measured and computed heads at the shallow piezometers at the NW, NE and the S locations is shown in Figure The overall fit between measured and computed heads is quite good with a root-mean-square (RMS) error of 1.2 m. Case 2: Permeability 0.02 m/day Figure presents the steady state calibrated head contours and flow vectors for this case together with the outline of the proposed mine site. The model heads are related to the true heads using an offset of m given by the relation:
11 Kalf and Associates Pty Ltd 11 True head RL (m) = Model head (m) m Thus a model head of m is equivalent to a field water level (at the S bore) of = 1043 m. A plot comparing the measured and computed heads at the shallow piezometers at the NW, NE and the S locations is shown in Figure The overall fit between measured and computed heads is quite good with a root-mean-square (RMS) error of 1.5 m. 4.2 Mining Simulation Case 1: Permeability K= 0.05 m/day A 20 year transient simulation of progressive mining at the site was conducted using the previous Case 1 steady state heads as a starting head condition. For this simulation a specific yield of 1% was used. Mining was assumed to occur uniformly over the site for this period to a maximum mining depth of RL 993 m. The mining was simulated using a modified drain function in the MS code that progressively lowered the mining head down to RL 993m over 20 years. This function also allows for the formation of a seepage face in the pit high walls. The results of the simulation are given in Figures and which show the heads after 10 and 22 years (two years after mining ceases) respectively. Also shown in these figures are the groundwater flow vectors. The 22 year simulation was found to be equivalent to a steady state condition in which inflow from the system was balanced by outflow.
12 Kalf and Associates Pty Ltd 12 The results overall show that the influence of the open cut mine is created locally around the mine. Also whilst there is inflow into the mine void over time, there would be continued flow beneath the site towards the Wollangambe drainage valley. Maximum inflow to the open-cut for this case is unlikely to exceed 1.2 ML/day and during mining would be much less than this rate. Case 2: Permeability K= 0.02 m/day For this case a steady-state simulation was used to determine the final equilibrium heads surrounding the mine. Mining was assumed to occur uniformly over the site to a maximum mining depth of RL 993 m. The results of the simulation are shown in Figures They show that the influence of the open cut mine is created locally around the mine but is less extensive than the case for the higher permeability value. Again whilst there is inflow into the mine void over time, there is continued flow beneath the site towards the Wollangambe drainage valley in the longterm. Maximum inflow to the open-cut for this case is unlikely to exceed 0.8 ML/day and during mining would be much less than this rate. This is currently considered to be the most likely case scenario. 4.3 Effects of Rocla Quarry It was not possible to include the Rocla quarry in the calibration since there are no monitored water levels in the vicinity of this site area. However a measure of the effect of the quarry in addition to the proposed Newnes open-cut is shown for Cases 1 and 2 in Figures and respectively.
13 Kalf and Associates Pty Ltd 13 Inflows to each of these cases show that for Case 1 (K=0.05 m/d) the inflow to the Rocla quarry is about 10 L/sec which is known to be too high based on estimates of inflow (less than 5 L/sec). For Case 2 the inflow is about 5 L/sec which is a better match with the actual inflow magnitude experienced at this site. This comparison suggests that the Case 2 permeability is likely to be a closer representation of the bulk permeability of the proposed site than the value adopted for Case 1 (K= 0.05 m/day). The Rocla quarry which was established in the 70 s indicates that watertable drawdown around the pit has not influenced vegetation species surrounding the pit as these plants rely mainly on soil moisture conditions for survival. The same conditions would apply to the proposed pit and therefore no influence on vegetation surrounding the pit would be expected. 5.0 Final Void Groundwater Conditions Figures 5.1-1, 2 and 3 show diagrammatically a transect extending from a southwest to north-east direction across the north-east corner of the proposed pit and shows the groundwater flow system during various stages of mining including: Groundwater flow system before mining Groundwater flow system at the end of mining Groundwater and surface flow system after mining 5.1 Groundwater flow system before mining Figure shows the groundwater system prior to mining. Rainfall locally recharges the sandstone rock formation with the bulk of this
14 Kalf and Associates Pty Ltd 14 rainfall running off and some of the infiltrated moisture removed by evaporation by vegetation (evapotranspiration). Rainfall reaching the watertable flows in a down gradient direction to the south-west on the south-western side of the topographic ridge and to the north-east on the other side of the ridge toward the river. All groundwater flow is directed downward and is responsible for the difference in water levels observed in the three sets of observation piezometers completed at the site. That is, the water level in the shallow bores is higher than the average level in the deep bores indicating downward flow. All groundwater flow is also down gradient finally joining the Wollangambe River drainage system to the north-east. 5.2 Groundwater flow system at the end of mining Figure shows the groundwater system immediately after the end of mining. The flow system stays fundamentally the same except at relatively shallow depth in the vicinity of the mine where flow is directed into the void. There would also be some fall in the water table immediately up and down gradient of the void although the overall deeper groundwater flow would not be affected and would continue to flow towards the river as it did prior to mining. 5.3 Groundwater flow system after mining Figure shows the system some years after mining ceases with essentially the same flow system as given in Figure However, from this time onwards the void would become an elevated wetland area with shallow ponding of groundwater inflow, direct rainfall and runoff. This collected water will flow out as surface water over the pit edge towards the river. Both groundwater and surface water will remain of very good quality in this wetland area because of the rate of inflow and
15 Kalf and Associates Pty Ltd 15 continual flushing action. Much of the groundwater intercepted will be returned to the Wollangambe drainage system 6.0 Conclusions and Considerations 1) The drilling and testing of three sets of observation bore piezometers around the periphery of the proposed mine pit has indicated low permeability sandstone validating a previous assessment. Bulk permeability is likely to be in the range 0.02 to 0.05 m/day with the value 0.02 m/day being the most likely. 2) Numerical model simulation of the proposed mining over a 20 year period indicate that two years or so after mining stops the groundwater system would reach equilibrium. The open-cut pit at that time will only influence the water table locally but will still allow the majority of deeper groundwater flow to reach the river drainage system. 3) Mining at the site will have no influence on the groundwater system at the Clarence village as this groundwater is well beyond the drawdown influence of the proposed open-cut. 4) Inflow to the pit is unlikely to exceed 0.8 ML/day with much less inflow likely during the mining operation. 5) Some years after mining ceases the pit will behave as a flow-through system and become an elevated wetland zone of good quality water. 6) The Rocla quarry which was established in the 70 s indicates that watertable drawdown around the pit has not influenced vegetation species surrounding the pit as these plants rely mainly on soil moisture conditions
16 Kalf and Associates Pty Ltd 16 for survival. The same conditions would apply to the proposed pit and therefore no influence on vegetation surrounding the pit would be expected. 7) The pit construction will not measurably influence surface runoff and baseflow in the Wollangambe River system because of the relatively small area of the total catchment affected. Seepage and surface flow from the area will in time be re-established to the catchment. 8) Once the mining is commenced water level measurements should be conducted initially on a monthly basis in each hole over time to establish seasonal trends and then measured approximately every 3 months. This consideration is suggested to allow the drawdown estimates provided in this report to be verified.
17 Kalf and Associates Pty Ltd 17 Report Limitations Kalf and Associates Pty Ltd has prepared this report for the use of Newnes Kaolin Pty Ltd, trading as Sydney Construction Materials (the client), in accordance with the usual care and thoroughness of the consulting profession. It is based on generally accepted practices and standards at the time it was prepared. No other warranty, expressed or implied, is made as to the professional advice included in this report. It is prepared in accordance with the scope of work and for the purpose as discussed with the client and outlined in this report and does not include any geotechnical issues regarding the constructed pit, or pit closure. Such advice should be sought from a qualified geotechnical consultant. The methodology adopted and sources of information used by Kalf and Associates (KA) are outlined in this report. KA has made no independent verification of this information beyond the agreed scope of works and KA assumes no responsibility for any inaccuracies or omissions. No indications were found during our investigations that information contained in this report as provided to KA was false. The report was prepared during November-December 2004 and is based on the conditions encountered and the information available at the time of preparation. KA disclaims responsibility for any changes that may have occurred after this time. This report should be read in full. No responsibility is accepted for use of any part of this report in any other context or for any other purpose or by third parties. This report does not purport to give legal advice. Qualified legal practitioners can only give legal advice. This report relies on information obtained by inspection, sampling, testing or other means of investigation. This information is directly relevant only to the points in the ground where they were obtained at the time of the assessment. The borehole logs indicate the inferred ground conditions only at the specific locations tested. The precision with which conditions are indicated depends largely on the frequency and method of sampling, and the uniformity of conditions as constrained by the scope of work. The behaviour of groundwater is complex and may vary over short distances. Our conclusions are based upon the analytical and field data provided by the Water Research Laboratory UNSW (WRL) and models developed on this information. Future advances in regard to the understanding of the ground and groundwater conditions could impact on our conclusions and recommendations regarding this site. Where conditions encountered at the site are subsequently found to differ significantly from those anticipated in this report, KA must be notified of any such findings and be provided with an opportunity to review the findings and recommendations of this report. Groundwater models and modeling are as accurate as the data will allow and should be regarded as tools to be updated as additional data becomes available. The findings in this report based on various computer model scenarios do not necessarily imply a recommendation or recommendations that a specific course or courses of action should be taken. They are meant to indicate possible or probable outcomes that the client should consider before a particular course or courses of action is/are decided upon based on all considerations relevant to the operation and closure of mining. Whilst to the best of our knowledge information contained in this report is accurate at the date of issue, subsurface conditions, including groundwater levels can change in a limited time. Therefore this document and the information contained herein should only be regarded as valid at the time of the investigation unless otherwise explicitly stated in this report.
18 Kalf and Associates Pty Ltd 18 FIGURES

19 Area of existing Clarence Colliery sub-surface mine workings Proposed site Existing Rocla Quarry Clarence village Scale: 1 km Grid 1:25000 Base Maps: LITHGOW 8931-III-S WOLLANGAMBE 8931-II-S FIGURE Proposed Quarry Site Kalf and Associates Pty Ltd Dec 2004
20
21
22
23

24 !
25 ! "

26 !"
27 "!

28

29

30

31

32
33 SW Rainfall Evapotranspiration NE Wollangambe River Groundwater Divide Groundwater flow directions Water table FIGURE Schematic diagram of groundwater flow system before mining Kalf and Associates Pty Ltd Dec 04


34
35 SW NE Elevated Wetland Surface water flow Wollangambe River Groundwater Divide Groundwater flow directions Water table FIGURE Schematic diagram of Groundwater flow system after mining Kalf and Associates Pty Ltd Dec 04
36 APPENDIX Drilling, Hydraulic Testing and Installation of Observation bores (piezometers)

37
38 THE UNIVERSITY OF NEW SOUTH WALES SCHOOL OF CIVIL AND ENVIRONMENTAL ENGINEERING WATER RESEARCH LABORATORY MULTI-PIEZOMETER INSTALLATION AT NEWNES JUNCTION WRL Technical Report 2004/40 December 2004 by W Timms, S E Pells and M Groskops
39 Water Research Laboratory School of Civil and Environmental Engineering Technical Report No 2004/40 University of New South Wales ABN Report Status Final King Street Date of Issue December 2004 Manly Vale NSW 2093 Australia Telephone: +61 (2) WRL Project No Facsimile: +61 (2) Project Manager Wendy Timms Title Author(s) Multi-Piezometer Installations at Newnes Junction W A Timms, S E Pells and M Groskops Client Name Client Address Client Contact Frans Kalf and Associates 52 York Terrace Bilgola NSW 2107 Frans Kalf Client Reference The work reported herein was carried out at the Water Research Laboratory, School of Civil and Environmental Engineering, University of New South Wales, acting on behalf of the client. Information published in this report is available for general release only with permission of the Director, Water Research Laboratory, and the client.
40 WRL TECHNICAL REPORT 2004/40 1. CONTENTS 1. INTRODUCTION 2 2. OVERVIEW 3 3. DRILLING Method summary North West Site Lithology Water Inflow North East Site Lithology Water Inflow Southern Site Lithology Water Inflow 6 4. PIEZOMETER INSTALLATIONS AND GROUNDWATER LEVELS 7 5. PERMEABILITY TESTING Packer Tests - Methodology and Interpretation Water Level Recovery Tests Methodology and Interpretation North West Site North East Site Southern Site Summary and Comparison WATER QUALITY SAMPLING REFERENCES 17 APPENDIX A Borehole Logs APPENDIX B Hydraulic Conductivity Analyses 1. Piezometer Completion Details 2. Measured Groundwater Levels 3. Hydraulic Conductivity Measurements LIST OF TABLES 1. Locality Map 2. Piezometer Locations LIST OF FIGURES
41 WRL TECHNICAL REPORT 2004/ INTRODUCTION The Water Research Laboratory, University of New South Wales (WRL) was commissioned to supervise drilling, permeability testing, installation of piezometer standpipes and water quality testing at a proposed mine site in Newnes Junction, NSW. A summary of procedures and results from the drilling and testing are presented in this report. Detailed interpretation is to be undertaken by Kalf and Associates.
42 WRL TECHNICAL REPORT 2004/ OVERVIEW The location of the proposed mine site is near Newnes Junction in the Blue Mountains region, west of Sydney, NSW (Figure 1). The extent of the proposed mine lease is shown in Figure 2. Three locations were chosen for drilling investigations at the North West, North East and Southern extremities of the mine lease (Figure 2). At each of the three drilling locations, a deep (60 m) and shallow (17.5 m) borehole was drilled using rotary air hammer techniques. This drilling technique was chosen as it does not require the use of drilling fluids, which would obscure examination of any aquifers that may be penetrated. Air lifting of the boreholes at various stages during drilling allowed estimations of yields to be made, and provided information on the location and extent of any aquifers or saturated fractured zones. Lithological logging was also performed. Results from drilling at each of these sites are discussed in detail in Section 3 and borehole logs are provided in the Appendix. Packer testing was performed on the 60 m bores to give an estimate of the hydraulic conductivity of the rock mass at various depths in the borehole. At some locations, brief water level recovery tests were also performed to give a supplementary estimation of hydraulic conductivity. Details of these permeability tests are given in Section 4.
43 WRL TECHNICAL REPORT 2004/ DRILLING 3.1 Method summary Airlifting associated with the rotary air hammer drilling method brings drilling spoil and any available water to the surface. Logging of bores was performed by examining the spoil being airlifted from the drill face. It is possible to get the colour and composition of the material but due to the grinding action of the rotary hammer drill method it is not possible to discern the structure, strength and grain size / clay content of the sandstone material. The flow rate of water that was brought to the surface by airlifting was assessed volumetrically and by use of a v-notch weir. The volumetric method involves recording the time taken to fill a container of known volume. The v-notch weir method involves measuring the depth of flow over a v-shaped weir and applying a known head-discharge relationship. Assessment of water yields by airlifting was done as drilling progressed. Additionally, drilling was paused for approximately 10 minutes at various stages (at the change of drill rods (every 6 m) or if a fractured zone was struck) and airlifting, whilst stationary, was performed to assess the yields at progressive depths. With the exception of the last 5 m of the north-eastern 60 m bore, water was not added during drilling so that the nature of existing water zones could be examined. Borehole logs for each of the three sites are presented in the Appendix. Included on the logs are details of air lifting tests performed during drilling. Each site is discussed in more detail below. 3.2 North West Site Lithology Massive sandstone beds extended from 100 mm below ground to the full depth at 60 m. The upper 7 to 8 m was characterised by an orange to deep orange colour. Below 8 m, sandstone was a cream to off white colour, with occasional bands of light orange and very occasional thin beds of ironstone. Small pieces of quartz (1-2mm) could be found within the cream coloured sandy / dusty spoil. Below the watertable, spoil became slurry-like and difficult to log accurately. Drilling was significantly slower at depths greater than 20 m.
44 WRL TECHNICAL REPORT 2004/ Water Inflow Slight moisture was observed in the spoil in the upper 6 m, but appeared to become drier with depth up to approximately 24 m. From 24 m to 30 m, small amounts of water inflow was noted (less than 1 L/minute). Below 30 m and to the end of the bore at 60 m, a consistent inflow of approximately 5 to 6 L/minute was recorded as drilling progressed. A very small amount of water (< 1 L) was recovered after pausing at 12 m depth. At 18 m, no water was recovered, although drilling was only paused for only 2 minutes. After a 14 minute pause at 24 m, airlifting brought up approximately 30 to 40 L of water, but this quickly dried up and drilling spoils remained dry until 30 m. At 30 m depth, a volume of 50 to 60 L was recovered and a flow rate of less than 6 L/minute was sustained. At 60 m depth airlifting was continued for 15 minutes during which time a flow of approximately 5 L per minute was recorded using the v-notch weir. Airlifting of the bore from 60 m depth also allowed flushing of fines from the borehole in preparation for subsequent packer testing. 3.3 North East Site Lithology Sandstone beds extended from 400 mm below ground to the base of the 60 m bore. Two regions of soft material assessed to be clay infilling layers, where struck at the end of the hole (58.0 to 58.8 m and 59.8 to 59.9 m). These layers were identifiable as the drill rods progressed very rapidly and a small amount of grey high plasticity clay was brought to the surface. Throughout the bore, sandstone was mostly a grey / cream colour with regions of orange and occasional purple / ochre as shown on the bore log. In some regions of the cream colour material, quartz particles up to 2 mm diameter were recovered Water Inflow No water was recovered during drilling or during stationary airlifting tests down to 54 m depth. However, collaring of drill rods that was occurring from 36 m was attributed to presence of some moisture. To counteract collaring, water was added during drilling of the last 6 m.
45 WRL TECHNICAL REPORT 2004/40 6. Drilling on the 5 th November left the bore at 54 m depth. Upon resuming on 6 th November, approximately 20 to 30 L of water was recovered immediately and then no further water was produced. At 60 m, airlifting was performed to remove drilling water used from 54 m and examine yields. Drilling water appeared to be removed very quickly, after which flows reduced markedly and stabilised at approximately 4 to 5 L/minute. This suggested that the soft regions struck from 58 m could be water bearing zones. However, it is possible that clay regions could be slowly releasing drilling water after being pressurised during drilling. 3.4 Southern Site Lithology Depth to sandstone was approximately 1 m. Orange and yellow coloured layers extended to 13 m depth. Thereafter, sandstone was a cream / off white colour with some quartz Water Inflow Some moisture was noted in the spoil from 1 to 7 m, but appeared to become drier with depth until 41 m. A moist band was noted between 22 and 24 m, but no water was recovered. Drilling on 8 th November left the bore at 41 m depth. On 9 th November, drilling rods were raised and then lowered slowly with the air on. Water was lifted from 31 m to 41 m but no constant flow was developed. No further water was recovered during drilling to the final depth of 54 m.
46 WRL TECHNICAL REPORT 2004/ PIEZOMETER INSTALLATIONS AND GROUNDWATER LEVELS Standpipe piezometers were installed in each borehole after completion of drilling and packer testing using Class mm PVC casing, screened at 3 m or 6 m intervals. These details are shown on the bore logs in the Appendix. A summary of the piezometer completion details is given in Table 1. Table 1 Piezometer Completion Details Borehole ID GPS coordinates # Depth (m BG) NW NW NE NE Elevation (±1 mahd) Screen Intervals (m BG) 15-18, 21-24, 27-30, 33-36, 39-42, 45-48, 51-54, , 21-24, 27-30, 33-36, 39-42, 45-48, 51-54, S , 36-42, S * ~3m of casing broken off and lying in base of NE60. # Handheld GARMIN GPS ** Estimated elevation from contour map of site Other Details Gravel Pack to 3m above top screen Gravel Pack to 3m above top screen Gravel Pack to 3m above top screen * Gravel Pack to 3m above top screen Gravel Pack to 3m above top screen Gravel Pack to 3m above top screen Groundwater levels were measured by electronic dip meter on several occasions (Table 2). Groundwater levels were measured relative to ground level until 9/11/04 when steel monuments were installed. After 9/11/04, groundwater levels were measured relative to the top of the 50 mm PVC casing within the steel monument (approximately 0.5 m above ground).
47 WRL TECHNICAL REPORT 2004/40 8. On the 24/11/04, automated loggers and a pressure transducer were temporarily installed in NW60 and S54 to monitor groundwater level recovery after sampling. This data is presented in Sections 5.3 and 5.5. Table 2 Measured groundwater levels Borehole Date Time NW60 3/11/04 06:35 am SWL (m BPVC) - SWL (m BGL) /11/04 8:50 am SWL (mahd)** Comment Dip prior to starting work - 12 hours recovery since previous day. Dip 2 days after completion. Rainfall event the previous day. 24/11/04 8:40 am * Prior to sampling. Dip 2 days after NW17.5 6/11/04 8:50 am 9.49 completion. Rainfall - event the previous day. 24/11/04 8:40 am * Prior to sampling NE60 6/11/04 4:00 pm Static level dipped 30 - during packer testing Dip prior to starting work - 12 hours recovery since previous 7/11/04 6:45 am 43 - day. Flow of water in NE60 bore audible but level static. 24/11/04 NE /11/04 S54 11:15 am 11:15 am 9/11/04 6:30 am 24/11/04 S /11/04 12:50 am 12:50 am * Assuming 0.5 m stickup of PVC inside steel monument ** Surface mahd estimated from contour map of site * Prior to sampling * Prior to sampling - 15 Airlifting before resuming drilling from 42 m. 12 hours recovery since previous day * Prior to sampling * Prior to sampling
48 WRL TECHNICAL REPORT 2004/ PERMEABILITY TESTING 5.1 Packer Tests - Methodology and Interpretation Packer tests involve sealing off a section of the bore using inflatable rubber seals ( packers ) and injecting water into the sealed section at various pressures. Water injected into the sealed region will flow into the rock units enclosed by the packers at a rate proportional to the water pressure applied. By recording flow rate at various water pressures, estimates of rock mass hydraulic conductivity can be made. Results are normally expressed in Lugeon units, defined as flow rate of one litre per minute per meter length of test section under a water pressure of 1000 kpa. This is approximately equivalent to mass hydraulic conductivity of m/ second, or m/day. In practice, pressures of 1000 kpa are rarely used during testing and so the value of flow at 1000 kpa is extrapolated from the results from tests performed at lower pressures. A common hurdle to performing packer tests is in establishing a tight water seal between the packers and the borehole walls. It is noted that if water was leaking past the packer at a constant rate, the result of the test would not be affected as it is not the total flow that determines the interpretation of the packer test but rather the gradient in flow rate between various pressures. However, in practice the rate of water loss through a leak will increase with increasing pressure, and hence the results of such a packer test will show a higher gradient of flow versus pressure, and thus the Lugeon value will be overestimated. In short, leaking packer tests will give an overestimate of hydraulic conductivity. The procedure for packer tests was as follows: 1. The borehole was washed out by airlifting for 10 minutes at the completion of drilling. 2. Drilling logs were examined to decide on an appropriate location for the packer test. 3. Packer equipment was assembled and packers and water line was lowered into the hole to the target depth. 4. Packers were inflated using compressed air and checked for air leaks. Packers were adjusted / repaired as required until pressure was maintained. 5. The water supply pump was turned on and valves were adjusted to deliver the first test pressure. 6. If there were any indications packers were not sealing, packers would be deflated and relocated and steps 4 to 5 repeated until a seal was achieved.
49 WRL TECHNICAL REPORT 2004/ Once flow rates had stabilised, time and water meter readings were made repeatedly until a consistent flow rate was recorded. 8. Valves were adjusted to deliver the second (higher) test pressure and step 6 was repeated. 9. Step 7 was repeated for subsequent increasing test pressures up to the highest test pressure. 10. Step 7 was then repeated in decreasing order of pressures from the highest test pressure. 11. Packers were deflated and repositioned for the next test. In some tests, a good seal between the packer and the bore could not be found despite repeated attempts. In these cases, the packer tests were performed in the knowledge that the result would give an overestimate due to leaking. In some of these cases, an attempt was made to quantify the rate of leakage and hence give a better indication of hydraulic conductivity. Full details are given for each site in Sections 4.3 to 4.5 below. 5.2 Water Level Recovery Tests Methodology and Interpretation Estimations of hydraulic conductivity can be made by monitoring the rate of recovery of water levels within a bore to static conditions. For falling head data, a Hvorslev (1951) method was used which relies of determining a basic time lag (T o ), taken as the time for the water level to recover to 63% from the initial drawdown. The formula chosen was for the case of a well point in an infinite, homogeneous and isotropic aquifer: 2 L r ln R K = (1) 2LT 0 where: K is permeability (m/s) r is radius of standpipe (m) R is radius of screen, including any gravel pack (m) L is length of screen (m) T o is the basic time lag (seconds)
50 WRL TECHNICAL REPORT 2004/ A second interpretation method by Hvorslev (1951), was used to calculate hydraulic conductivity from recovery data based on constant drawdown and pump rate. This method was based on the following two formulae: q K = (2) h. f f 2π L = (3) 2 ln( L / D + 1+ ( L / D) where: K is permeability (m/s) h is driving head (m) q is steady state pump rate (m 3 /s) f is shape factor D is effective diameter (m) L is length of screen (m) This method assumed a constant pump rate and a constant drawdown and relied on dip measurements prior to pumping and at a constant pump rate (to calculate the driving head). An estimate of effective screen length was used to calculate a shape factor (Equation 3) for input to Equation 2. A hydraulic conductivity was calculated for each of two effective screen lengths open screen only (shorter interval) and open screen plus blank casing between each screen (longer interval). 5.3 North West Site Packer testing at the north west site was performed on the 3 rd and 4 th November Results from packer tests are shown in Appendix B and a summary of results is shown in Table 3. For the first test, a single packer was used to isolate the bottom 12.3 m of the borehole. A single packer test is preferable where possible as it reduced the number of locations from which leakage could occur. From this test, a lugeon value of 6.4 was estimated, giving an hydraulic conductivity estimate of approximately 0.06 m/day. For the second test, two packers were used in a straddle configuration to isolate a section of bore from 39.7 to m depth (8.95 m section of borehole). This test was performed successfully without any observed leakage, and a value of 7.2 lugeons (~ 0.06 m/day) was estimated.
51 WRL TECHNICAL REPORT 2004/ Table 3 Summary of Hydraulic Conductivity Measurements Location NW 60 NE 60 Test Type Interval (m depth) Hydraulic Conductivity (m/day) Comment Single Packer 47.7 to No leakage observed Double Straddle Packer Double Straddle Packer Double Straddle Packer 39.7 to No leakage observed 21.7 to to 24.6 < (< 0.09 including estimation of leakage rates) < 0.48 (< 0.24 including estimation of leakage rates) Falling Head 12 to Recovery 24 to (L=36 m) (L=18 m) Falling Head 30 to Rising Head 30 to Double Straddle Packer Double Straddle Packer Recovery 51.4 to 60 S 54 Recovery 36 to to to to (L=5 m) (L=8.6 m) 0.03 (L=12 m) 0.02 (L=21 m) Rate of flow leakage past upper packer assessed visually. Rate of flow leakage past upper packer measured using v-notch weir. Recovery from to 14.3 m BGL after installation of standpipe Recovery after 10.4 L/s for sampling 24/11/04. A crude estimate based on recovery to quasi static level after pumping in water Recovery to quasi static level airlifting No leakage observed, leakage past bottom packer possible No leakage observed, leakage past bottom packer possible Recovery after 4.5 L/s for sampling 24/11/04. Recovery after 6.3 L/s for sampling 24/11/04. Repeated attempts to seat the packers between 30.7 and 39.6 m were unsuccessful as leaking was observed. The packer was moved up for further tests from 21.7 to m, where leaking was again observed, despite repeated attempts. It was decided to persevere with these tests and try to quantify the rate of leakage for each pressure using a v-notch weir placed adjacent to the headworks where the leaking flows exited the top of the bore. A value of 16.3 lugeons (~ 0.14 m/day) was recorded for the leaking test. When the leaking rate removed from the packer flow rate, a best estimate value of 10.9 lugeons (~ 0.1 m/day) was made.
52 WRL TECHNICAL REPORT 2004/ Leaking was also recorded for a packer test from 15.7 to 24.6 m depth. A value of 56 lugeons (~ 0.5 m/day) was recorded for the leaking test. When the estimated leakage rate was taken into account, a best estimate value of 27 lugeons (~ 0.24 m/day) was made. After packer testing equipment was removed and the standpipe piezometers were installed (approximately 50 minutes after completion of packer testing) it was noted that water levels in the standpipe were receding (ie. falling from elevated levels due to packer testing and displacement of water from the piezometer installation). Repeated dip measurements were performed over a period of two hours to monitor this recovery (from m BGL) and hence provide an estimate of hydraulic conductivity. Dip readings were taken again two days later to get a value of static water level (taken as 14.3 m BGL). From the data, it was seen that 63% of the recovery (ie. water level at 13.4 m BGL) occurred at 2 hours from the start of monitoring, giving a time lag of 7200 seconds, or 0.08 days. Using Equation 1 with a standpipe radius of m, a borehole radius of m and a screen length of 8 3 m lengths, an hydraulic conductivity of m per day was estimated. This estimate is based on inflows over the full depth of the saturated region from approximately 12 meters to 60 meters. Recovery of water levels after sampling (24/11/04) were used to derive hydraulic conductivity over the entire piezometer screen. Hydraulic conductivity of and m/day was calculated for effective screen lengths of 36 and 18 m respectively (Table 3). These values are similar to those provided by packer tests at deeper test intervals, but much higher than for falling head hydraulic conductivity. 5.4 North East Site A single-packer test from 47.7 m and a double-packer test from 47.7 to m were both unsuccessful due to excessive leakage past the packer. During these tests, flow rates of up to 2 L/second were directed into the borehole, but insufficient pressure was maintained. It is noteworthy that 700 to 900 L of water was added at rates between 1.6 and 2 L/second during each of these tests (at approximately 70 kpa gauge pressure), but this failed to cause the borehole to overflow. The assessed dry volume (above the water table ~ 35 m BGL) of the borehole during this testing is approximately 230 L. Therefore, a volume of between 500 to 600 L of water must have flowed into the aquifer over a period of 6 to 8 minutes. After attempting the above tests, packers were deflated and repeated dip measurements and tests involving changing the water level confirmed that the water level in the bore would
53 WRL TECHNICAL REPORT 2004/ quickly recover to approximately 30 m BGL where it would stabilise. A volume of 240 L was added to the hole over a period of 2 minutes after which water levels raised to over 25 m BGL. Dip readings showed that the water level recovered from 25 m BGL back to 30 m BGL within two minutes. This suggested a time lag in the order of 30 seconds for the open borehole. This would indicate an hydraulic conductivity in the order of 0.7 m/day (assuming an effective length of open borehole of 30 m). Airlifting was then performed from 47 m, but a constant water yield was not developed. After airlifting, dips were performed to monitor the rate of recovery to 30 m BGL, from which a time lag of days was calculated. This gives an estimate of hydraulic conductivity of 0.04 m/day (see Appendix B). These estimations should be considered as rough indications only as the static water level was observed to be at 43 m BGL the following day. Two successful packer tests were then performed for the intervals 42.2 to and 36.2 to m BGL. The results from these packer tests are shown in Table 1 and in Appendix B. Recovery of water levels after sampling (24/11/04) were used to derive hydraulic conductivity over the entire piezometer screen. Hydraulic conductivity values of 0.11 and m/day were calculated for effective screen lengths of 5 and 8.6 m respectively (Table 3). These values are less than those provided by packer tests, but much higher than for falling head hydraulic conductivity. 5.5 Southern Site Several attempts at obtaining a good packer seal in the southern bore were unsuccessful so no packer testing was possible. It was thought that a worn drill bit was causing irregularities in the hole which prevented packer seals, so a second hole was attempted with a new drill bit. This second hole was over-sized for effective packer operation. Recovery of water levels after sampling (24/11/04) were used to derive hydraulic conductivity over the entire piezometer screen. Hydraulic conductivity of 0.03 and
54 WRL TECHNICAL REPORT 2004/ m/day was calculated for effective screen lengths of 12 and 30.9 m respectively (Table 3). 5.6 Summary and Comparison In summary, a range of methods including packer testing and falling/rising groundwater levels have been used to calculate hydraulic conductivity at discrete depth intervals, and over the entire length of the piezometer. The highest hydraulic conductivity was observed at the NE 60 site on the edge of the valley, and relatively low hydraulic conductivity at the S 54 site. Measured hydraulic conductivity at the three piezometer sites was in the range of m/day ( to m/s), with the exception of one anomalous falling head value of m/day at NW 60. This range of hydraulic conductivity over 1.5 orders of magnitude is typical of such sandstone environments, and is similar to hydraulic conductivity of 10-7 to 10-5 m/s measured by packer testing in the Katoomba area (Brown, 2003).
55 WRL TECHNICAL REPORT 2004/ WATER QUALITY SAMPLING Water samples (n = 3 plus method blank) were obtained from three deep piezometers on the 24 th November. A GRUNDFOS MP1 submersible electric pump was used to obtain samples. All piezometers were pumped for at least half-an-hour prior to sampling to remove ~3 bore volumes of water and/or stable ph and electrical conductivity (EC) were observed. Analysis of field parameters (temperature, ph, and EC) was completed on-site with calibrated water quality meters and sondes. Samples for analysis were collected in laboratory supplied bottles and submitted to Australian Laboratory Services (ALS) which is NATA certified for the analyses undertaken. Samples for cation analysis were filtered onsite with a 0.45 µm filter, and acidified. Table 4 presents water quality results. Groundwater at this site was generally of very low salinity and was acidic. Groundwater chemistry was similar for NW60 and NE60 piezometers (NaCl type), but S54 groundwater was dominated by high alkalinity and consequently, higher electrical conductivity and ph. A maximum iron concentration of 1.1 mg/l observed in NE60 may be attributed to drill casing lost down the hole, since iron concentrations <0.02 mg/l were observed at the other piezometers. Manganese concentrations were <0.05 mg/l. Table 4 Water quality results, sampled 24/11/04. Parameter Units NW60 NE60 S60 Method Blank Temperature C ph C µs/cm Ca mg/l <1 <1 25 <1 Mg mg/l <1 <1 <1 <1 Na mg/l <1 K mg/l <1 <1 9 <1 Alk as CaCO 3 mg/l <1 <1 64 <1 SO4 mg/l <1 <1 8 <1 Cl mg/l <1 Fe mg/l < <0.01 Mn mg/l <0.01 Total cations Toal anions Anion/Cation difference * anions were filtered except Cl, alkalinity
56 WRL TECHNICAL REPORT 2004/ REFERENCES Brown, S.J.A., Hydrogeology of the Blue Mountains Simulating the impacts of water inflows into tunnel excavations using MODFLOW. Masters thesis, University of Technology, Sydney. Hvorslev, Time lag and soil permeability in ground-water observations. US Army Core of Engineers, Bulletin No. 36. Kruseman, G.P. and de Ridder, N.A., Analysis and evaluation of pumping test data. ILRI Publication 47, Netherlands.
57

58