A Hydrologic Study of the North Hills, Helena, Montana
|
|
|
- Mervyn Neal
- 5 years ago
- Views:
Transcription


1 A Hydrologic Study of the North Hills, Helena, Montana Andrew Bobst, Kirk Waren, James Swierc, and Jane Madison MBMG Groundwater Investigations Program 10/6/11 MT AWRA
2 Background Groundwater Steering Committee Selected North Hills as #1 priority for groundwater investigation Controlled Groundwater Area (CGWA) Increased Subdivisions Observed Water Level Declines Purpose and Scope of Study Provide a scientific basis for evaluating water availability.


3 Study Area Southern Lewis and Clark County ~8 miles north of Helena On the northern edge of the Helena Valley ~ 55 square miles Study area boundary Surface water divides on the west, north and east, and a groundwater flow line on south.


4 Setting: Geologic Map Fractured and Faulted Argillite Bedrock in Hills Tertiary unconsolidated clay rich materials overlain by colluvium on pediment Quaternary Sand and Gravel in the Helena Valley Geologic Map by Reynolds, in Thamke, 2000

5 Setting: Geologic Conceptual Cross Section Three Aquifers interacting Fractured and Faulted Bedrock Clay Rich Tertiary Quaternary Sand and Gravel (Highest Productivity)


6 Setting: Human Influences Canal and Laterals Leek to recharge groundwater with surface water from the Missouri River Irrigation water in excess of crop demand recharges groundwater Homes remove water and Discharge septic effluent Lake Helena and Drains exist & set the local base level
 and")


7 Methods: Measure Water Levels Electronic Tapes (e tapes) and Pressure Transducers; hourly to monthly Obtain Depth to Water below a Surveyed Measuring Point Convert to Groundwater Altitude


8 Methods: Install Wells & Conduct Aquifer Tests Installed 22 wells No available wells Wells needed for aquifer tests Needed to evaluate vertical gradients Adjacent to streams Aquifer Tests Determine Aquifer Properties Assess boundaries to flow


9 Observations & Interpretations: Potentiometric Surface Map (October 2010) Water Flow from high to low: From the hills to Lake Helena Tighter spacing of contours in Hills indicates lower transmissivity The surface can be contoured, indicating that at this scale the bedrock can be treated as porous media Supports conceptual model & provides quantitative targets for numerical model calibration
10 Observations & Interpretations : Hydrographs Hydrographs are evaluated for overall trend Best Fit Line of 2005 and 2010 Data used for quantification Other data is used to evaluate the result 34 Hydrographs Evaluated 11 up; 23 down Slope Breakdown: >1 /yr down = /yr down = 4 ±0.5 /yr up or down = /yr up = 2 >1 /yr up = 1


11 Observations & Interpretations : Hydrograph Slope Geographic Distribution No change or upward In the areas identified by Madison as influenced by irrigation or Silver Creek Noticeable declines in all wells in the bedrock area with highest development Scattered wells with declines in areas of lower density development. Likely a due to level of use and aquifer properties at that location


12 Data Analysis & Interpretation: Numerical Groundwater Modeling Numerical models quantitatively combine the components of system & allow for predictions to be made concerning potential future scenarios See Kirk Waren s Poster
13 Results Groundwater flow is from the hills to Lake Helena and the drains. Recharge rarely occurs on the pediment, ET is essentially equal to precipitation. Episodic recharge occurs in the hills (3 4 inches per year), Recharge from HVID Canal and its laterals, and beneath irrigated fields Only available below canal The Bedrock is the least productive aquifer. Fracture Flow (variable) Inhibited by bedrock faults The Tertiary materials are somewhat more productive Depends on gravel layers (west more productive than east) Quaternary sand and gravel in the Helena Valley is the most productive aquifer. Sustained drawdown is seen north of the HVID canal, and west of the interstate. No declines are seen in areas influenced by irrigation or Silver Creek.
14 Questions?
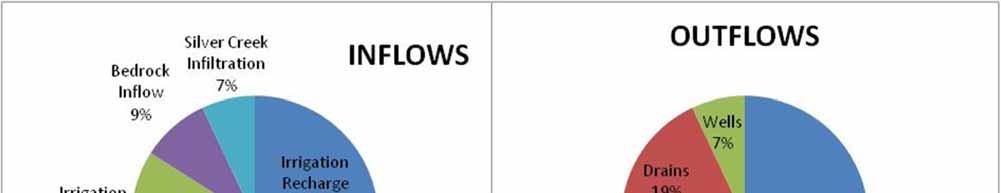
15 Observations & Interpretations: Water Budget Best Estimate Probable Range % Minimum Maximum INPUTS Silver Creek Alluvium Inflow % Bedrock Inflow 1,252 9% 834 1,669 Diffuse Infiltration 4,380 31% 3,942 4,818 Silver Creek Infiltration 1,012 7% 876 1,071 Irrigation Canal Leakage 2,701 19% 2,339 2,858 Crop Leaching Fraction 4,778 34% 4,138 5,057 TOTAL INPUTS 14, % 12,143 15,501 OUTPUTS Drains 2,894 19% 2,704 3,304 Lake Helena 11,075 74% 10,344 12,643 Wells 1,033 7% 949 1,136 TOTAL OUT 15, % 13,977 17,083


16 Methods: Surface Water Groundwater Sites Stilling Well in Stream Surface Water Altitude Surface Water Temperature Staff Gage Stilling Well Well Adjacent to Stream Groundwater Altitude Groundwater Temperature Well
17 Observations & Interpretations : Surface Water Groundwater Interactions Silver Creek: Groundwater levels are consistently below surface water levels. Changes in surface water elevation is rapidly transmitted to groundwater. Diurnal temperature variations are not transmitted, however seasonal variation is seen. This shows that Silver Creek is a contiguous losing stream, but that the amount of loss is relatively small. The pattern is the same for all sites on Silver Creek.


18 Methods: Install Wells and Conduct Aquifer Tests


19 Setting: Climate Average precipitation ranges from less than 10 in the Valley to over 16 in the hills. Substantially below average over the last 20 years Wet 2010 and 2011 have been wet

20 Setting: Conceptual Cross Section with Human Influences Wells and Drains Remove Water Septic Systems, Canals and Laterals, and Crop Leaching Fraction Add Water Drains installed to remove excess water: Prevent Waterlogging & Accumulation of Salts

21 Methods: Water Sampling Three main events Early April 2010 August 2010 October Groundwater samples from 31 sites 25 Surface Water samples from 12 sites 3 Sample for OWCs in April 2011 Standard Suite Field Parameters ph, SC, Temp Major Ions Ca, Mg, Na, K, Fe, Mn, SiO 2 HCO 3, CO 3, Cl, SO 4, Nutrients Nitrate, Fluoride, Orthophosphate Trace Metals Al, Sb, As, Ba, Be, B, Br, Cd, Ce, Cs, Cr, Co, Cu, Ga, La, Pb, Li, Hg, Mo, Ni, Nb, Nd, Pd, Pr, Rb, Ag, Se, Sr, Tl, Th, Sn, Ti, W, U, V, Zn, Zr
22 Observations & Interpretations: Water Chemistry Groundwater: One sample exceeded the drinking water standard for nitrate. All other standards were met. Natural nitrate is typically less than 2 mg/l (Mueller and Helsel, 1996). 24 of 87 samples had >2 mg/l of Nitrate. Based on nitrate isotopes, septic systems are the most likely source of the nitrates. No major livestock operations. Surface water: Arsenic in excess of the drinking water standard is common.

23 Observations & Interpretations: Water Budget
24 1 groundwater sample out of 87 exceeded the drinking water quality standard for nitrate. 24 of the 87 samples had nitrate concentrations greater than 2 mg/l (typical background). The source of elevated nitrate is likely septic effluent. Thin soils and fractured bedrock provide little biological activity to break nitrate down.