! MONITORING REPORT FORM (CDM-MR) * Version 01 - in effect as of: 28/09/2010
|
|
|
- Jeffrey Montgomery
- 5 years ago
- Views:
Transcription
1 Page 1 MONITORING REPORT FORM (CDM-MR) * Version 01 - in effect as of: 28/09/2010 CONTENTS A. General description of the project activity A.1. Brief description of the project activity A.2. Project participants A.3. Location of the project activity A.4. Technical description of the project A.5. Title, reference and version of the baseline and monitoring methodology applied to the project activity A.6. Registration date of the project activity A.7. Crediting period of the project activity and related information A.8. Name of responsible person(s)/entity(ies) B. Implementation of the project activity B.1. Implementation status of the project activity B.2. Revision of the monitoring plan B.3. Request for deviation applied to this monitoring period B.4. Notification or request of approval of changes C. Description of the monitoring system D. Data and parameters D.1. Data and parameters determined at registration D.2. Data and parameters monitored D.3. Other relevant data and parameters E. Emission reductions calculation E.1. Baseline emissions calculation E.2. Project emissions calculation E.3. Leakage calculation E.4. Emission reductions calculation E.5. Comparison of actual emission reductions with estimates in the registered CDM-PDD E.6. Remarks on difference from estimated value F. Sustainable Indicators
2 Page 2 MONITORING REPORT VERSION /07/2011 Antai Group Waste Gas Recovery for Power Generation Project GS /07/ /12/2010 SECTION A. General description of the project activity A.1. Brief description of the project activity: 1. Purpose of the project activity and the measures taken to reduce greenhouse gas emissions; The purpose of the project is to utilize waste gases of the steel plant, converters and coke ovens to produce electricity and steam for self-use of Antai Group Company (Project Owner). The Project generates GS VERs by displacing electricity generation from grid connected fossil fuelfired power plants and steam from coal fired boilers. 2. Brief description of the installed technology and equipments; The installed capacity of the Project is 50 MW, including four 75 t/h boilers, two 25 MW turbines and two 25 MW generators. 3. Relevant dates for the project activity (e.g. construction, commissioning, continued operation periods, etc.). Construction completed: April 5 th 2007 Equipment commission and start date: April 5 th 2007 Continued operation period start date: April 5 th 2007 Equipment Technical Information Capacity: 25 MW Manufacturer: Shandong Jinan Equipment Company Turbine Generator 1 Commissioning date: April 5 th 2007 Serial number: Capacity: 25 MW Manufacturer: Shandong Jinan Equipment Company Turbine Generator 2 Commissioning date: April 5 th 2007 Serial number: Capacity: 75 t/h Manufacturer: Sichuan Boiler Company Waste Gas Recovery Boiler 1 Commissioning date: April 5 th 2007 Serial number: Waste Gas Recovery Boiler 2 Capacity: 75t/h Manufacturer: Sichuan Boiler Company Commissioning date: April 5 th 2007 Serial number:
3 Page 3 Waste Gas Recovery Boiler 3 Waste Gas Recovery Boiler 4 Transformer 1 Transformer 2 Capacity: 75t/h Manufacturer: Sichuan Boiler Company Commissioning date: April 5 th 2007 Serial number: Capacity: 75t/h Manufacturer: Sichuan Boiler Company Commissioning date: April 5 th 2007 Serial number: Capacity: 31.5 MVA Manufacturer: Shandong Dachi Electric Engineering Company Commissioning date:april 5 th 2007 Serial number: Capacity: 31.5 MVA Manufacturer: Shandong Dachi Electric Engineering Company Commissioning date: April 5 th 2007 Serial number: Total emission reductions achieved in this monitoring period. 624,043 tco2e (Only emission reductions from electricity supply will be claimed, no emission reductions will be claimed from heating supply 1 in order to be conservative.) The breakdown for each year is as follows: Periods Emission reduction (tco2e ) 27/07/ /12/ , /01/ /12/ ,309 01/01/ /12/ , 903 A.2. Project Participants Name of Party involved (*) (Host) indicates a host Party) Private and/or public entity (ies) Project participants (*) (As applicable) Kindly indicate if the Party involved wishes to be considered as project participant (Yes/No) People s Republic of China Antai Group Co., Ltd (Project " 1 As stated on page of the registered PDD, net quantity heat supplied by the project (HGy) is expressed as the enthalpy between the steam supplied and the feed water, both in energy units, which will be measured by the flow meter, thermometer and manometer, installed on consumption side. It means for each consumption point, six meters should be installed: three meters for feed water and three meters for steam. However, it is found that the project activity has various steam users that include Antai manufacture plants, workshops, office buildings, kitchens, shower rooms and residential buildings for employees of Antai Group. Installation and management of so many meters is difficult and beyond the capacity of the project owner, therefore project owner has only installed meters at generation side for operation status control. Consequently, the emission reductions from heating supply are not considered for emission reduction calculation.

4 Page 4 (Host) Switzerland# Owner) South Pole Carbon Asset Management Ltd. (Purchaser of VERs) " A.3. Location of the project activity: Yi an Town, Jiexiu City, Shanxi Province, People s Republic of China. The GPS coordinates are and A.4. Technical description of the project Waste gases include blast furnace gas (BFG), coke oven gas (COG) and converter gas (CG). Those gases are generated by two blast furnaces of volume size 450 m 3, a series of coke ovens of 2 million ton annual production capacity and two converters of 60 ton. The waste gases are fed through coal gas pipes to 475t/h gas fired boilers where the mixed gas is fired to heat the water in the boilers to generate medium pressure steam, then driving 225MW steam turbine generator units to generate power while saturated steam of 0.98 MPa is extracted from the turbine for self-use of Antai Group Company (Project Owner). The steam users include manufacture plants and workshops, office buildings, kitchens, shower rooms and residential buildings for employees of Antai Group. Flue gas generated in the gas firing process is delivered to a 100m high stack (d=3.2m) to be released to the atmosphere and the dust would be prevented from releasing into atmosphere by the high stack through gravity effect and pre-set dust barriers. The Project equipment consists of the waste gas recovery system and the steam turbine generation system, as shown in the following diagram:
5 Page 5 A.5. Title, reference and version of the baseline and monitoring methodology applied to the project activity: ACM 0012 V Consolidated baseline methodology for GHG emission reductions from waste energy recovery projects. The ACM0012 methodology refers to the Version 02 of the Tool to calculate the emission factor for an electricity system A.6. Registration date of the project activity: This monitoring report has been developed for the purpose of the Gold Standard verification. The project was registered at the Gold Standard registry on July 27, A.7. Crediting period of the project activity and related information (start date and choice of crediting period): As per the GS rules, pre-registration credits can be claimed for two years prior to the GS registration. Therefore, the start date of the crediting period is July 27, A fixed crediting period of 10 years has been chosen for this project activity. A.8. Name of responsible person(s)/entity(ies): Mr. Yang Xuan Southpole Carbon Project Manager x.yang@southpolecarbon.com Mrs. Huang Da Fei Southpole Carbon Supervisor f.huang@southpolecarbon.com Mr. Christoph Sutter Southpole Carbon Technical Reviewer c.sutter@southpolecarbon.com Address: Unit 2506 A, China Central Building T3, Jianguo Road 77, Chaoyang District, , Beijing Telephone: x.yang@southpolecarbon.com SECTION B. Implementation of the project activity B.1. Implementation status of the project activity 1. Starting date of operation of the project activity: April This project consists of one site only and the implementation is not phased. 2 According to GS Registration letter, a new rule has now been adopted which allows for project activities that were not registered yet on November 4th, 2010 to use the end of the fixed 8-week registration review period as the formal date of registration, regardless of the time it has taken to close all requests raised. This is of interest for retroactive project activities such as Antai project, given the 2- year rule for retroactive crediting. Therefore, the registration date for this project is therefore considered to be July 27th, 2010.
6 Page 6 2. Information regarding the actual operation of the project activity during this monitoring period, including information on special events, for example overhaul times, downtimes of equipment, exchange of equipment, etc. There were no special events during the monitoring period. No equipment was exchanged or overhauled. Due to lack of monitoring meters for heat, as per agreed in PDD, no emission reductions will claim from the heat in order to be conservative Brief description of: (i) events or situations that occurred during the monitoring period, which may impact the applicability of the methodology, and (ii) how the issues resulting from these events or situations are being addressed. No events occurred that affected the applicability of the methodology. B.2. Revision of the monitoring plan No revision of monitoring plan has been made. B.3. Request for deviation applied to this monitoring period No request for deviation was applied for during this monitoring period. B.4. Notification or request of approval of changes No notification or request of approval of changes has been made. SECTION C. Description of the monitoring system Data collection procedures Data generation: Data for electricity supply is measured by calibrated power meters, which are operated and maintained by AGC. Due to lack of reliable data for heat, as per agreed in PDD, no emission reductions will claim from the heat for this monitoring period in order to be conservative. Data recording and transfer: First, the data measured is manually recorded by onsite staffs in the daily operation report. Second, the onsite manager approves daily operation report and transfers the data to monthly report. Third, at the end of each month, GS VER supervisor will check the monthly report and send it to South Pole. Data aggregation: The calculated net power output is aggregated monthly. Calculation: See section D.2 and section E. Power generation and auxiliary use per month are the difference between the cumulative values on the power meters. Net power supplied to the plant is power output minus power auxiliary power consumption. See section E for calculations of emission reductions. ing: The calculated values are included in an Excel sheet and reported in the MR. 3 Please refer to footnote 1 in section A.1 for details.
7 Page 7 Calibration and Accuracy of meters sheet: As per the Verification Regulation of Electrical Energy Meters with Electronics (JJG ), the meters are calibrated annually by Jinzhong Institute of Quality and Technical Supervision Inspection & Measurement.
8 Page 8 Meter Measuring PDD No. Tag No. Meter Serial No. EGtotal M1 7F EGtotal M3 8F EGAUX M2 97k EGAUX M4 98k EGGrid import EGGrid export,y M5 90k M6 91k Meter type and model Electronic meter DSSD50 Electronic meter DSSD50 Electronic meter DSSD52 Electronic meter DSSD52 Electronic meter DSSD52 Electronic meter DSSD50 Manufacturer name Heilongjiang Longdian Electric Company Heilongjiang Longdian Electric Company Heilongjiang Longdian Electric Company Heilongjiang Longdian Electric Company Heilongjiang Longdian Electric Company Heilongjiang Longdian Electric Company Specific location Measurement Range Generator Generator Auxiliary equipmen t Auxiliary equipmen t Backup line Backup line Accuracy (%) Calibration date (dd/mm/yy) Valid until (dd/mm/yy) Certificate No. 07/01/08 06/01/09 DX /01/09 05/01/10 DX /01/10 04/01/11 DX /01/08 06/01/09 DX /01/09 05/01/10 DX /01/10 04/01/11 DX /01/08 06/01/09 DX /01/09 05/01/10 DX /01/10 04/01/11 DX /01/08 06/01/09 DX /01/09 05/01/10 DX2009""## 05/01/10 04/01/11 DX /01/08 06/01/09 DX /01/09 05/01/10 DX /01/10 04/01/11 DX /01/08 09/01/09 DX /01/09 08/01/10 DX /01/10 07/01/11 DX

9 Page 9 Organizational structure, roles and responsibilities A GS VER supervisor (Ms Xiao Xueqin) has been appointed and trained who is responsible for the GS VER monitoring system. Monthly recording of power meters falls under the responsibility of the site. Three level training are provided, which are company safety training, workshop safety training and team safety training. The target group of company safety training is all the employees of Antai Group, especially the new employees. They will receive intensive training on safety before practical operation. When new employees get familiar with general company safety rules, they will be allocated to different workshops. The detailed technical training will be provided during workshop training. From which employees will understand production management and equipment operation. Then employees will be allocated to different teams under workshops. Responsibilities to each individual according to his/her position will be clarified. Emergency procedures for the monitoring system The GS VER supervisor will notify the manufacturer and the equipment maintenance team in case there is doubt about the correct functioning of the meters mentioned in the monitoring plan. In that case, manufacturer or the maintenance team will check, repair and where necessary replace the meters. No GS VERs are claimed for the period during which the meters were not functioning correctly. During this monitoring period, the meters have been working properly. Line Diagram The numbers in the line diagram are tag numbers. The tag numbers are included in the table Calibration and Accuracy of Meters Sheet in section C.
10 Page 10 SECTION D. Data and parameters D.1. Data and parameters determined at registration and not monitored during the monitoring period, including default values and factors Data / Parameter: EFelec,i,j,y(also referred to as EFelec,y) Data unit: tco 2 /MWh Description: CO2 emission factor for the electricity source i (i=gr (grid) or i=is (identified source), displaced due to the project activity, during the year y in tons CO2/MWh Source of data used: Calculated according to the procedure outlined in B.6.1 of the registered PDD Value(s) : Indicate what the data are Baseline emission used for (Baseline/ Project/ Leakage emission Calculated on an ex-ante basis. The emission factor will not be updated calculations) during the crediting period. "##$%$&'()*&++,'%- For this and other descriptions relating to this parameter, see the description in Section B.6.2 of the registered PDD, Data and parameters that are available at validation. Data / Parameter: Data unit: Description: Source of data used: Value(s) : Indicate what the data are Project emission EFCO2,EL,y(in the context of this project activity, identical EFelec,y) tco 2 /MWh CO2 emission factor for the electricity source i (i=gr (grid) or i=is (identified source), displaced due to the project activity, during the year y in tons CO2/MWh Calculated according to the procedure outlined in B.6.1 of the registered PDD
11 used for (Baseline/ Project/ Leakage emission calculations) ""#$#%&'()*%++,&$-) Data / Parameter: Data unit: Description: Source of data used: Value applied: Justification of the choice of data or description of measurement methods and procedures actually applied: Any comment: Page 11 Calculated on an ex-ante basis. The emission factor will not be updated during the crediting period. For this and other descriptions relating to this parameter, see the description in Section B.6.2 of the registered PDD, Data and parameters that are available at validation. Q OE,BL,elec MWh Electricity output that can be theoretically produced (in appropriate unit), to be determined on the basis of maximum recoverable energy from the WECM, which would have been released (or WECM would have been flared or energy content of WECM would have been wasted) in the absence of CDM project activity. Calculated based on Feasibility Study As per registered PDD, the annual theoretical electricity output according to FSR is 264,000 MWh 4. The data is from the feasibility study report and supplied by on-site specialists. This is to determine the f cap,elec D.2. Data and parameters monitored Data / Parameter: Data unit: Description: Measured /Calculated /Default: Source of data: Value(s) of monitored parameter: Indicate what the data are used for (Baseline/ Project/ Leakage emission calculations) Monitoring equipment (type, accuracy class, serial number, calibration frequency, date of last calibration, validity) Measuring/ Reading/ Recording frequency: Calculation method (if applicable): QA/QC procedures applied: EG total,y MWh Total electricity production by the project activity in cogeneration plant during the year y Measured Power meters 703,173.6 Baseline emission Please refer to Calibration and Accuracy of Meters Sheet in section C. Read and recorded on daily basis and aggregated monthly N/A EG total is measured at central controlling room with meters. Meters are 4 For this monitoring period of 888 days, the theoretical output is 264,000*888 days/365 days=642,279.4 MWh
12 Page 12 properly maintained with regular testing and calibration schedules developed as per the technical specification requirements to ensure accuracy by AGC Data / Parameter: Data unit: Description: Measured /Calculated /Default: Source of data: Value(s) of monitored parameter: Indicate what the data are used for (Baseline/ Project/ Leakage emission calculations) Monitoring equipment (type, accuracy class, serial number, calibration frequency, date of last calibration, validity) Measuring/ Reading/ Recording frequency: Calculation method (if applicable): QA/QC procedures applied: Data / Parameter: Data unit: Description: Measured /Calculated /Default: Source of data: Value(s) of monitored parameter: Indicate what the data are used for (Baseline/ Project/ Leakage emission calculations) Monitoring equipment (type, accuracy class, serial number, calibration frequency, date of last calibration, validity) EGAux,y MWh Electricity consumption by the auxiliary equipment in cogeneration plant during the year y Measured Power meters 41,647.7 Baseline emission Please refer to Calibration and Accuracy of Meters Sheet in section C. Read and recorded on daily basis and aggregated monthly N/A EG Aux is measured at central controlling room with meters. Meters are properly maintained with regular testing and calibration schedules developed as per the technical specification requirements to ensure accuracy by AGC EG y "#$%&%'(')* MWh Net electricity production by the project activity in cogeneration plant during the year y Calculated Calculated by deducting electricity consumption by the auxiliary equipment from total electricity generation 661,525.9 Baseline emission Please refer to Calibration and Accuracy of Meters Sheet in section C.
13 Measuring/ Reading/ Recording frequency: Calculation method (if applicable): QA/QC procedures applied: Data / Parameter: Data unit: Description: Measured /Calculated /Default: Source of data: Value(s) of monitored parameter: Indicate what the data are used for (Baseline/ Project/ Leakage emission calculations) Monitoring equipment (type, accuracy class, serial number, calibration frequency, date of last calibration, validity) Measuring/ Reading/ Recording frequency: Calculation method (if applicable): QA/QC procedures applied: Data / Parameter: Data unit: Description: Measured /Calculated /Default: Source of data: Value(s) of monitored parameter: Indicate what the data are used for (Baseline/ Project/ Leakage emission calculations) Monitoring equipment (type, accuracy class, serial number, calibration frequency, date of last calibration, validity) Read and recorded on daily basis and aggregated monthly Calculated by deducting electricity consumption by the auxiliary equipment from total electricity generation This data item is calculated value using other data items. No QA/QC required EG"#$%#&'(")*+%,-../*+0 MWh Electricity imported from the grid during the year y Measured Power meters 13,710.1 Project emission Please refer to Calibration and Accuracy of Meters Sheet in section C. Read and recorded on daily basis and aggregated monthly N/A EG Grid import,y is measured at central controlling room with meters. Meters would be properly maintained with regular testing and calibration schedules developed as per the technical specification requirements to ensure accuracy by AGC. EGGrid export,y MWh Electricity export to the grid during the year y Measured Power meters 0 Baseline emission Page 13 Please refer to Calibration and Accuracy of Meters Sheet in section C.
14 Measuring/ Reading/ Recording frequency: Calculation method (if applicable): QA/QC procedures applied: Page 14 The project is a captive cogeneration plant by design and specified by government approval. The electricity generated would be consumed by the project owner s industrial facilities. It is unlikely electricity would be export to the grid. Monitoring of the parameter is implemented to ensure compliance of Gold Standard s eligibility requirement. The amount of electricity monitored exporting to the grid would not be accounted in calculation of baseline emissions. N/A EGGrid export,y is measured at central controlling room with meters. Meters would be properly maintained with regular testing and calibration schedules developed as per the technical specification requirements to ensure accuracy by AGC. Since no emission reductions will be claimed from heating supply 5, the parameters related to monitoring of steam are not applicable here, as listed below. In future, PP plans to install the meters required for steam measurement in 2011 and In 2011, PP will contact professional institutes regarding this matter and carry research on installation and management since it is beyond PO s capacity of managing so many meters. In 2012 the practical plan will be carried out and data will be available 6. Data / Parameter: Data unit: Description: Measured /Calculated /Default: Source of data: Value(s) of monitored parameter: Indicate what the data are used for (Baseline/ Project/ Leakage emission calculations) HGy TJ Net quantity of heat supplied by the project activity during the year y in TJ. Calculated. Net quantity heat supplied by the project is expressed as the enthalpy between the steam supplied and the feed water, both in energy units, which will be measured by the flow meter, thermometer and manometer, installed on consumption side. It means for each consumption point, six meters should be installed: three meters for feed water and three meters for steam. However, it is found that the project activity has various steam users which include Antai manufacture plants, workshops, office buildings, kitchens, shower rooms and residential buildings for employees of Antai Group. Installation and management of so many meters is difficult and beyond the capacity of the project owner, thus project owner has only installed meters at generation side for operation status control. Therefore calculation of net quantity heat supply is not applicable. 5 Please refer to footnote 1 for details. 6 The explanation letter with the proposed plan has been provided to DOE.
15 Page 15 Monitoring equipment (type, accuracy class, serial number, calibration frequency, date of last calibration, validity) Measuring/ Reading/ Recording frequency: Calculation method (if applicable): QA/QC procedures applied: Data / Parameter: Data unit: Description: Measured /Calculated /Default: Source of data: Value(s) of monitored parameter: Indicate what the data are used for (Baseline/ Project/ Leakage emission calculations) Monitoring equipment (type, accuracy class, serial number, calibration frequency, date of last calibration, validity) Measuring/ Reading/ Recording frequency: Calculation method (if applicable): QA/QC procedures applied: Data / Parameter: Data unit: Description: Measured /Calculated /Default: Source of data: Value(s) of monitored parameter: Indicate what the data are Q OE,y,heat TJ Quantity of heat supplied by the project activity measured at generation side during the year y in TJ. Calculated. To calculate this parameter, quality, temperature and pressure of saturated steam and feed-in water should be continuously recorded. The project owner has installed meters at generation side, however the purpose is only for operation status control and no continuous data is recorded, therefore calculation of Q OE,y,heat is not applicable. S Tonnes Amount of saturated steam supplied by the proposed project activity during the year y Measured. No meters are installed at consumption side, thus measurement of this parameter is not applicable.
16 Page 16 used for (Baseline/ Project/ Leakage emission calculations) Monitoring equipment (type, accuracy class, serial number, calibration frequency, date of last calibration, validity) Measuring/ Reading/ Recording frequency: Calculation method (if applicable): QA/QC procedures applied: Data / Parameter: T1 Data unit: Description: Temperature of steam by the proposed project activity during the year y Measured /Calculated Measured. No meters are installed at consumption side, thus /Default: measurement of this parameter is not applicable. Source of data: Value(s) of monitored parameter: Indicate what the data are used for (Baseline/ Project/ Leakage emission calculations) Monitoring equipment (type, accuracy class, serial number, calibration frequency, date of last calibration, validity) Measuring/ Reading/ Recording frequency: Calculation method (if applicable): QA/QC procedures applied: Data / Parameter: P1 Data unit: Description: Temperature of steam by the proposed project activity during the year y Measured /Calculated /Default: Measured. No meters are installed at consumption side, thus measurement of this parameter is not applicable. Source of data: Value(s) of monitored parameter: Indicate what the data are used for (Baseline/ Project/
17 Page 17 Leakage emission calculations) Monitoring equipment (type, accuracy class, serial number, calibration frequency, date of last calibration, validity) Measuring/ Reading/ Recording frequency: Calculation method (if applicable): QA/QC procedures applied: Data / Parameter: T2 Data unit: Description: Temperature of feed waster supplied to the boilers during the year y Measured /Calculated Measured. Since emission reduction from heating supply is excluded /Default: due to lack of meters installed at consumption side, measurement of the parameters related with calculation of heating supply emission reduction is not needed. Source of data: Value(s) of monitored parameter: Indicate what the data are used for (Baseline/ Project/ Leakage emission calculations) Monitoring equipment (type, accuracy class, serial number, calibration frequency, date of last calibration, validity) Measuring/ Reading/ Recording frequency: Calculation method (if applicable): QA/QC procedures applied: Data / Parameter: Data unit: Description: Measured /Calculated /Default: Source of data: Value(s) of monitored parameter: Indicate what the data are used for (Baseline/ Project/ P2 MPa Temperature of feed waster supplied to the boilers during the year y Measured. Since emission reduction from heating supply is excluded due to lack of meters installed at consumption side, measurement of the parameters related with calculation of heating supply emission reduction is not needed.
18 Page 18 Leakage emission calculations) Monitoring equipment (type, accuracy class, serial number, calibration frequency, date of last calibration, validity) Measuring/ Reading/ Recording frequency: Calculation method (if applicable): QA/QC procedures applied: Data / Parameter: Data unit: Description: Measured /Calculated /Default: Source of data: Value(s) of monitored parameter: Indicate what the data are used for (Baseline/ Project/ Leakage emission calculations) Monitoring equipment (type, accuracy class, serial number, calibration frequency, date of last calibration, validity) Measuring/ Reading/ Recording frequency: Calculation method (if applicable): QA/QC procedures applied: Data / Parameter: Data unit: Description: Measured /Calculated /Default: Source of data: Value(s) of monitored parameter: Indicate what the data are used for (Baseline/ Project/ F2 t/y Quantity of feed water supplied to the boiler during the year y Measured. Since emission reduction from heating supply is excluded due to lack of meters installed at consumption side, measurement of the parameters related with calculation of heating supply emission reduction is not needed. FFi,y t/y Quantity of coal consumed by the stand-by boilers during the year y Measured. Since emission reduction from heating supply is excluded due to lack of meters installed at consumption side, measurement of the parameters related with calculation of heating supply emission reduction is not needed.
19 Page 19 Leakage emission calculations) Monitoring equipment (type, accuracy class, serial number, calibration frequency, date of last calibration, validity) Measuring/ Reading/ Recording frequency: Calculation method (if applicable): QA/QC procedures applied: Data / Parameter: Data unit: Description: Measured /Calculated /Default: Source of data: Value(s) of monitored parameter: Indicate what the data are used for (Baseline/ Project/ Leakage emission calculations) Monitoring equipment (type, accuracy class, serial number, calibration frequency, date of last calibration, validity) Measuring/ Reading/ Recording frequency: Calculation method (if applicable): QA/QC procedures applied: Data / Parameter: Data unit: Description: Measured /Calculated /Default: Source of data: Value(s) of monitored parameter: Indicate what the data are used for (Baseline/ Project/ NCVi,y TJ/ton Net calorific value of the coal consumed by the stand-by boilers Measured. Since emission reduction from heating supply is excluded due to lack of meters installed at consumption side, measurement of the parameters related with calculation of heating supply emission reduction is not needed. EFCO2,coal Ton CO 2 /TJ CO2 emission factor of coal Measured. Since emission reduction from heating supply is excluded due to lack of meters installed at consumption side, measurement of the parameters related with calculation of heating supply emission reduction is not needed.
20 Page 20 Leakage emission calculations) Monitoring equipment (type, accuracy class, serial number, calibration frequency, date of last calibration, validity) Measuring/ Reading/ Recording frequency: Calculation method (if applicable): QA/QC procedures applied: D.3. Other relevant data and parameters No 1 Indicator Air quality during operation Mitigation measure N/A Repeat for each parameter Chosen parameter Emission Concentration of dust and SO 2 contained in the flue gas Situation of parameter before Dust 10mg/m 3 ; SO 2 30 mg/m 3 `Future target for parameter Less than Dust 10 mg/m 3 ; SO 2 30 mg/m 3 Description of monitored parameter: Less than Dust 10 mg/m 3 ; SO 2 30 mg/m 3 Way of monitoring How Local EPA monitors responsible parameters and issues report When Once per three months By who Local EPA Comment Dust was also a concern by the Stakeholders during the SC and is herewith monitored. Chosen parameter Dust during construction (dust shall not disturb neighbourhood) Current situation of parameter N/a Future target for parameter Spraying water during construction (mitigation measure) Description of monitored parameter: Neighborhood was not disturbed. Way of monitoring How Local EPA monitors responsible parameters and issues report When Construction period By who EPA No 2 Indicator Noise Mitigation measure Repeat for each parameter Chosen parameter Situation of parameter before Future target for parameter Description of monitored parameter: Install noise reduction equipment and protection measures for personnel Implementation of noise reduction equipment for generators and protection measures for personnel N/a N/a Noise reduction equipment for generators and protection measures for personnel have been implemented
21 Page 21 Way of monitoring How When By who Project owner will check the installation and protection measures. Interviews will be performed as well. Annually Project owner No 3 Indicator Access to affordable and clean energy services Mitigation measure N/A Repeat for each parameter Chosen parameter Net electricity generation by project activity (EG y ) Situation of parameter before 0 Future target for parameter 264,000MWh/year (FSR page 8) Description of monitored parameter: The electricity from the project displaces electricity generation from grid connected fossil fuel-fired power plants. Way of monitoring How As mentioned in Section A.1, electricity generation of the project has started since April 5 th 2007, and the project has been continuously operational to provide clean electricity. When By who Net electricity generation is calculated by deducting electricity consumption by the auxiliary equipment from total electricity generation. The electricity consumption by auxiliary equipment and total electricity are measured by power meters. Please refer to Section D.2 Continuous Project owner No 4 Indicator Quantitative employment and income generation Mitigation measure N/A Repeat for each parameter Chosen parameter Number of full time jobs Situation of parameter before 0 Future target for parameter 154 (FSR 46~47) Description of monitored parameter: 180 full time jobs are created (please refer to Section F) Way of monitoring How Accounting report by human resource office of the plant. The number of people engaged, the gender, the responsibilities of them, the training and income they take will all be covered in the report. When Once a year By who Project owner No 5 Indicator Water consumption Mitigation measure N/A Repeat for each parameter Chosen parameter Access to water for villagers Situation of parameter before n/a Future target for parameter n/a
22 Description of monitored parameter: Way of monitoring How When By who Comment Page 22 Interviews with villagers show access to water for villagers are not affected Interview villagers Annually Project owner This was a concern by the stakeholders during the SC and shall herewith be monitored in future. No 6 Indicator The status of water recycling Mitigation measure N/A Repeat for each parameter Chosen parameter Construction status of wastewater treatment plant. Recycling of industrial wastewater. Situation of parameter before Domestic sewage is discharged into municipal sewage system. Other industrial water is recycled. Future target for parameter A wastewater treatment plant will be constructed to ensure the recycling of domestic water. Cooling water, chemical acidalkali, recycling wastewater will be recycled as always. Description of monitored parameter: Instead of simply discharge, recycling of wastewater reduces the impacts of the project on the environment greatly. Way of monitoring How Onsite confirmation and documentation review. When Annually By who Project owner SECTION E. Emission reductions calculation E.1. Baseline emissions calculation A summary table including the calculation of baseline emissions, applying actual values, formulae and descriptions is as below. Please refer to Annex 1 for monthly generation and emission reduction calculation sheet.
23 Page 23 E.2. Project emissions calculation A summary table including the calculation of project emissions, applying actual values, formulae and descriptions is as below. Please refer to Annex 1 for monthly generation and emission reduction calculation sheet. E.3. Leakage calculation There is no leakage for the project. E.4. Emission reductions calculation / table A summary table including the calculation of emission reductions, applying actual values, formulae and descriptions is as below. Please refer to Annex 1 for monthly generation and emission reduction calculation sheet.
24 Page 24 E.5. Comparison of actual emission reductions with estimates in the CDM-PDD According to the registered PDD of this project, the annually expected emission reduction of the project from electricity generation is 262,099 tco2e 7. This monitoring period covers 27/07/ /12/2010, which is 888 days in total. Then the estimated emission reduction from electricity for this monitoring period should be: 262,099/365*888= 637,655 tco2e. The breakdown of each year is also given. Item Values applied in ex-ante calculation of the registered GS- PDD (From electricity only) Actual values reached during the monitoring period (From electricity only) Emission reductions (tco 2 e) 637, , 043 Where for each year: 07/27/ /12/2008 (158 days) 113,457 77, /01/ /12/2009 (365 days) 262, ,309 01/01/ /12/2010 (365 days) 262, , 903 *Only emission reductions from electricity are considered. E.6. Remarks on difference from estimated value in the PDD The ex-ante estimation according to the registered PDD is 13,612 tco 2 e higher than the actual value, which shows the emission reduction amount of the present monitoring period are more or less in line with the registered PDD s estimation amount (only 2.13% lower, as shown below). The reason is that the plant follows the original design and remains in stable operation during the monitoring period. Emission Reduction Comparison Calculation: The difference between actual and estimated emission reductions = 637, ,043 = 13,612tCO 2 e (The ER amount of the present monitoring period is less from the registered PDD amount) The percentage= 13,612 / 637, 655= 2.13% For each year, the result is summarized as below: 7 Only emission reductions from electricity are considered, which are 262,099 tco2e /year. 311,196 tons of CO2 is the total emission reduction, which include emission reductions both from electricity replacement and heat replacement


25 Page 25 Period Difference (Actual value minus exante value) Percentage Note 07/27/ /12/ /01/ /12/ /01/ /12/ , % Actual operation under performs compared to the design, due to low waste gas supply. 12, % Actual operation is in line with design. Difference is minor, i.e. less than 5% and would not impact additionality. 9, % Actual operation is in line with design. Difference is minor, i.e. less than 5% and would not impact additonality Except for the period of 2008 due to low waste gas supply, the differences for the periods of 2009 and 2010 are minor, only 4.66% and 3.74% separately. SECTION F. Sustainable Indicators "#Air quality# # The emission concentration of dust and SO 2 during the monitoring period is below 10 mg/m 3 and 30 mg/m 3 and the dust did not disturb the neighbourhood during construction period. # 2. Noise # Noise reduction equipment for generators and protection measures for personnel have been implemented. Please refer to Annex 2 for photos and interviewees list.

26 Page Access to affordable and clean energy services The project utilizes waste gas for electricity generation and displaces electricity generation from grid connected fossil fuel-fired power plants, thus Access to affordable and clean energy services is achieved. 4. Quantitative employment and income generation The project contributes to employment generation in the region by employing an important number of human workforces. 5. Water consumption Therefore the access to water for villagers is not affected by the project activity. Please refer to Annex 4 for interviewee records. 6. Waste water recycling Wastewater treatment plant is being implemented. Please refer to Annex 5 for photos.

27 Page 27 Annex 1"The monthly sheet for generation and emission reduction " 1. 27/07/ /12/2008
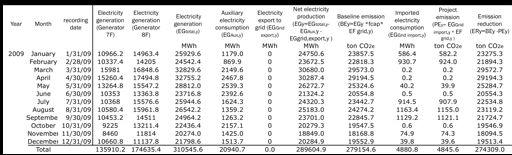
28 Page /01/ /12/2009

29 Page /01/ /12/2010
30 Page 30 Note: No generation occurred in Generator 8F (i.e. the TG2 /meter tag no: 8F) from 6 th September until 12 th December of 2008, while Generator 7F (i.e. TG1) remained operational. The outage of Generator 8F (TG2) was planned due to low supply of waste gas, but not due to operation failures of the plant. At the same time, to guarantee supply for auxiliary consumption, electricity was imported from the grid for the auxiliary consumption during that period.


31 Page 31 Annex 2 Noise reduction measures and interviewee list Pictures and Summary Noise reduction shield Separate operation room Interviewees Gender Work location Yang Xiaoli Female Electric room Qin Chunni Female Maintenance room Wang Feilong Male chemicals room Liu Chaihong Female Coordination room Guo Xiaohong Female Electric room Yan Shaoyong Male Coordination room Xu Junmei Female Boiler monitoring room Liu Weilin Male Coordination room Song Xiaoyong Male Maintenance room Wu Tianlong Male Electric room
32 Page 32 Annex 2 Noise reduction measures and interviewee list - Interview samples:
33 Page 33 Annex 3 Air quality certificate - Construction period
34 Page 34 Annex 3 Air quality certificate - Operation period ( ) Operation period-2008 Operation period-2009
35 Page 35 Annex 3 Air quality certificate - Operation period (2010)
36 Page 36 Annex 4: Water consumption interview records-summary No. Interviewee Home location Distance to the plant Villagers comments on water access 1 Li Xiaoyan Dong Shenquan village 1 km No impacts 2 Kang Shoulian Xi village 2 km No impacts 3 Chen Yuyan Yi an village 1 km No impacts 4 Li xiqiang Yi an village 1km No impacts 5 Wang haixia Dayin village 3 km No impacts 6 Zhang Xiaofang Yi an village 1 km No impacts 7 Ren zhiyu Yi an village 1 km No impacts 8 Jianli Zhang Xi men 0.5 km No impacts 9 Chen Mingfen Yi an village 1 km No impacts 10 Yan Xiaokai Dongkan village 1 km No impacts 11 Ren qianjuan Yi an village 2 km No impacts 12 Liqin Sun Dong Quan village 2.3 km No impacts 13 Kangjian Yi an village 1 km No impacts 14 Qin Shumei Yi an village 1 km No impacts 15 Ren Xianhui Yi an village 2 km No impacts 16 Chen Shifu Yi an village 2 km No impacts 17 Yue Sun Dong Quan village 1 km No impacts 18 Zhang Runpin Yi an village 1 km No impacts 19 Qin Pinliang Yi an village 1 km No impacts 20 Duan Jianlan Yi an village 2 km No impacts
37 Page 37 Annex 4: Water consumption interview records-interview samples


38 Page 38 Annex 5: Wastewater treatment plant


39 Page 39 Annex 6: Documents regarding labour standards Quality Management System Certificate Environment Management System Certificate Valid from Mar until Mar 20, 2011 Valid from Mar until Mar 20, 2011
40 Page 40 Business Permit (2008) Business Permit (2009)
41 Page 41 Business Permit (2010)