Flood Inundation Mapping of Tadi River
|
|
|
- Abel Bridges
- 5 years ago
- Views:
Transcription
1 Flood Inundation Mapping of Tadi River CE 547 GIS in Water Resource Engineering Final Report Submitted By: Aayush Piya May 5, 2017
2 Contents 1 Motivation & Background Introduction Objective Methods Data sources Projection used Analysis Delineating Watershed Area Hydrological Analysis Flood Inundation Mapping Results Watershed Delineation Hydrological Analysis Mean monthly flow and Flow Duration Curve Rating Curve Flood Forecast Analysis Flood Inundation Mapping Conclusion Future work APPENDIX
3 1 Motivation & Background Nepal with its fragile geology, steep slopes, high relief, and variable climates, is prone to water induced disasters such as floods and landslides. Over the last twenty years from , floods and landslides caused 6,466 deaths and more than US $ 200 million in damage. In the absence of information about the nature of flood events, exposure of life and properties and capabilities to cope with disasters, it is difficult to prepare and implement pre-disaster activities. Lack of information is likewise a major constraint in implementing and coordinating the rescue and post-disaster management activities effectively. The necessity of understanding the phenomenon of flooding of the river and to identify and map vulnerable areas for proper management and mitigation of floods is becoming essential to minimize the damages incurred annually. 2 Introduction Flood inundation mapping(fim) is required to understand the affects of flooding in an area and on important structures such as roadways, railways, streets, buildings and airport. FIM provides important information, like depth and spatial extent of flooded zones, required by the municipal authorities to inform the citizens about the major flood prone areas and adopt appropriate flood management strategies. In this Project, the catchment area of a river at site location is determined and a flood inundation map has been developed for the river within the catchment area caused by the 100-year return period flood. 3 Objective The main objective of this project was to explore and learn the basic function of HEC-RAS and HEC-GeoRAS and prepare a flood inundation map using this modelling tools. The specific objectives were as follows: i. Delineate watershed area of a section of Tadi river
4 ii. iii. Perform Hydrological calculation Use HEC-RAS and HEC-HEC-GeoRAS to develop flood inundation map of the section of river in ArcGIS 4 Methods 4.1 Data sources i. Hydrological data (daily flow records) from the existing Station No. 448 at Tadipul, Belkot, Nuwakot in Tadi Khola published by Department of Hydrology and Meteorology (DHM), Government of Nepal (GoN). ii. Digital Maps of Topography Base Map with Index sheet no B and D 4.2 Projection used A modified projection named Nepal Central Projection was used. It is CGS Everest Bangladesh 1937 modified to following parameter. This projection overcomes the inconveniences caused by the negative numbers in Rectangular Coordinate system. Projection: False_Easting: False_Northing: 0.0 Central_Meridian: 84.0 Scale_Factor: Latitude_Of_Origin: 0.0 Linear Unit: Meter (1.0) 4.3 Analysis Delineating Watershed Area Tadi Khola is located in Rautbeshi, Shikarbeshi and Ghyanphedi Village Development Committees (VDCs) of Nuwakot District in Central Development Region of Nepal. Digital maps were used to determine the catchment area. However, only two digital maps were available which entailed only upper section of the river. Because of unavailability of all the digital maps
5 only a section of the river was considered for this project. A point with coordinates E and N was taken as reference to delineate the watershed area Hydrological Analysis In this project, the hydrological analysis deals with the flow analysis to obtain the mean monthly flow at the provided point of reference using catchment correlation, flood at different return periods and in short it provides a basis of forecasting. If two basin are hydro-meteorologically similar, data extension may accomplished simply by multiplying the available long term data at the Hydrometric station with the ratio of the basin areas of the base station (proposed site under study) and the index Hydrometric station. In this contest, more accurate results can be obtained using Dicken s formula. Q = Qo A Ao Where, Q and Qo are the discharge at the base and index stations, respectively, and A and Ao are the corresponding basin areas. Using this method, flow duration curve (FDC) and rating curve at the proposed site was developed. For flood frequency analysis Gumbel s extreme value distribution was used Flood Inundation Mapping The flood inundation map was developed for a section of Tadi river. For this work, the HEC- RAS was used to calculate water-surface profiles; ArcGIS was used for GIS data processing. The HEC-GeoRAS for ArcGIS was used to provide the interface between the systems. HEC- GeoRAS is an ArcGIS extension specifically designed to process geospatial data for use with HEC-RAS. The extension allows users to create an HEC-RAS import file containing geometric attribute data from an existing digital terrain model (DTM) and complementary data sets. HEC- GeoRAS automates the extraction of spatial parameters for HEC-RAS input, primarily the threedimensional (3D) stream network and the 3D cross-section definition. Results exported from
6 HECRAS are also processed in HEC-GeoRAS. The general procedure adopted for inundation modelling consists basically of five steps: i) preparation of terrain (DEM or TIN) in ArcGIS, ii) HEC-GeoRAS for pre-processing to generate a HEC-RAS import file, iii) running of HEC-RAS to calculate water-surface profiles, iv) post-processing of HEC-RAS results, and v) floodplain mapping Data in HEC-RAS The geometric data were imported from HEC-GeoRAS. The imported file includes river streamline along with the bank lines and flow path. The file also includes cross section of the river. Geometric data also requires Manning s roughness coefficient. For simplicity, a constant Manning s coefficient was used. Tadi river is a mountain stream with no vegetation in channel and large boulder at bottom. The n value fitted for this description was 0.04, 0.05 and 0.07 for minimum, normal and maximum respectively. Similarly, for flow data, a constant flow was assumed throughout the stream. A peak flood discharge for 100-year return period was estimated using Gumbel s method. This discharge was used as constant flow for steady flow analysis. For boundary condition, rating curve was used.

7 5 Results 5.1 Watershed Delineation The total catchment area of the basin at the point of reference was calculated 101Km 2.

8 Flow, m 3 /s 5.2 Hydrological Analysis Mean monthly flow and Flow Duration Curve Month Jan Feb Mar Apr May June July Aug Sept Oct Nov Dec Mean monthly flow at St. No. 448, m 3 /s Estimated mean monthly flow at proposed site, m 3 /s FLOW DURATION CURVE Exceedence Level Of Flow, %
9 Stage (m) Rating Curve Rating Curve Discharge (m3/s) Gauge Height Log. (Gauge Height) Flood Forecast Analysis Gumbel Parameters Mean (x) Std deviation(σ) Reduced Mean (y) Reduced stdev s Return Period (yrs) Reduced Variate (yt) Frequency Factor (K) Estimated Discharge (Xt) (m 3 /s)

10 5.3 Flood Inundation Mapping
11 6 Conclusion The flood inundation map was developed using HEC-GeoRAS and HEC-RAS. The flood map covered area of 2km 2 with depth ranging from 0 m to 31 m. This project helped to learn basic function of these modelling tools. For any flow analysis, the flow data along with boundary condition are very important. In this project, for simplicity, constant value were used whereas in real life these value changes for each cross section. Selecting proper boundary condition is very important. While developing the inundation map, there were several times that the output polygon for flood area was not continuous. The main cause for this irregularity was found to be cross-section. The cross section is very essential for developing these maps and it is imperative that there is enough cross section provided in the geometric data. 7 Future work While carrying out this project, only a section of the river was considered. It would be very interesting to see how the map develops when whole river is considered for analysis. As mentioned before, constant data such as constant flow and manning s equation were used. An only one boundary condition was applied. In future, this project can be conducted with detailed flow data.

12 APPENDIX Nepal Index Sheet

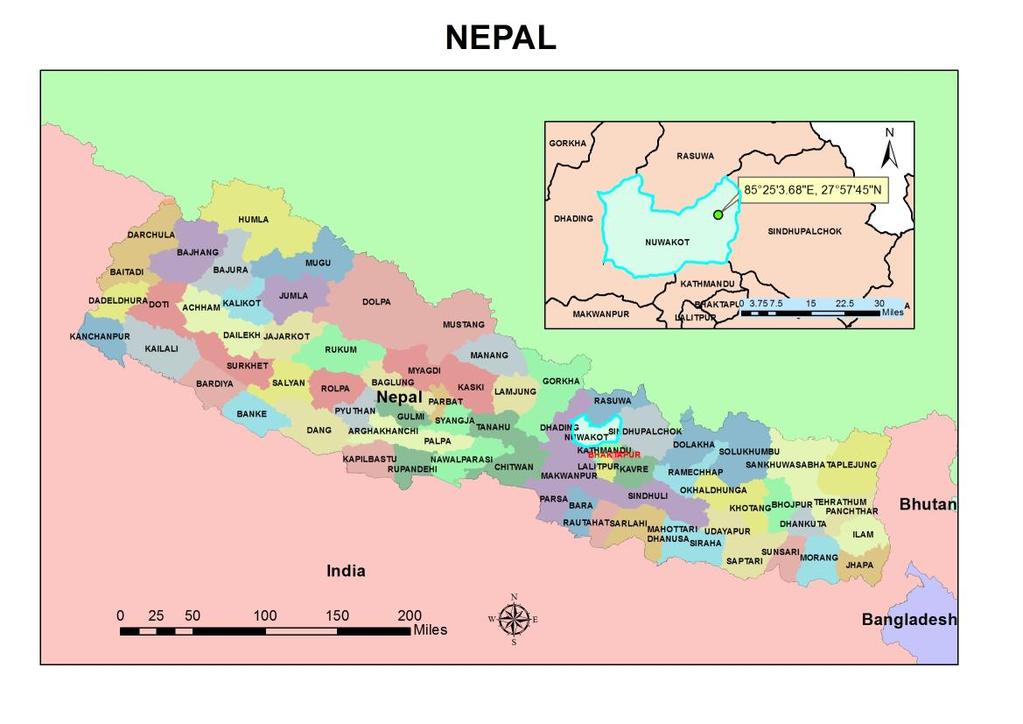
13 Site Location
14 Hydrological Analysis Mean monthly flow Mean Monthly Data (Correlated) Year: Jan. Feb. Mar. Apr. Hay June July Aug. Sep. Oct. Nov. Dec. Year Average:
15 Gumbel s Method for Flood Forecast Analysis GUMBEL'S METHOD Year Discharge Order no. (m) Flood Discharge Tp Gumbel Parameters Mean (x) Std deviation(σ) Reduced Mean (y) Reduced stdev s
16 Flow (m³/s) Return Period Reduced Variate (yt) Frequency Factor (K) Estimated Discharge (Xt) Flood Forecast Gumbel Method Return Period (yrs)
17 Stage (m) Rating Curve Stage (ft) Flow(cfs) Rating Curve Discharge (m3/s) Gauge Height Log. (Gauge Height)

18 Flood Inundation Mapping Geometric Data Data imported from HEC-Geo RAS

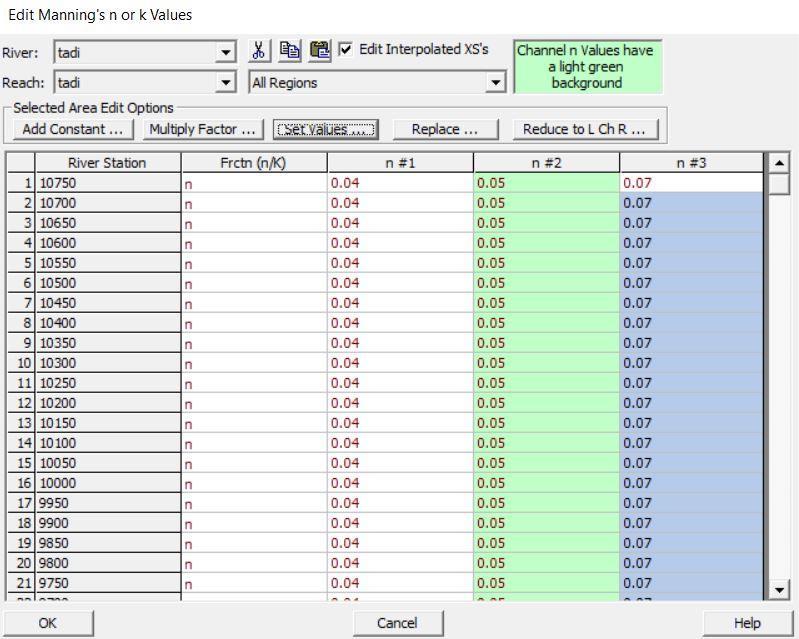
19 Assigning Manning s Roughness Coefficient


20 Steady Flow Data Assign a constant flow in cfs. Modify Reach Boundary Condition Rating curve was provided in this project.

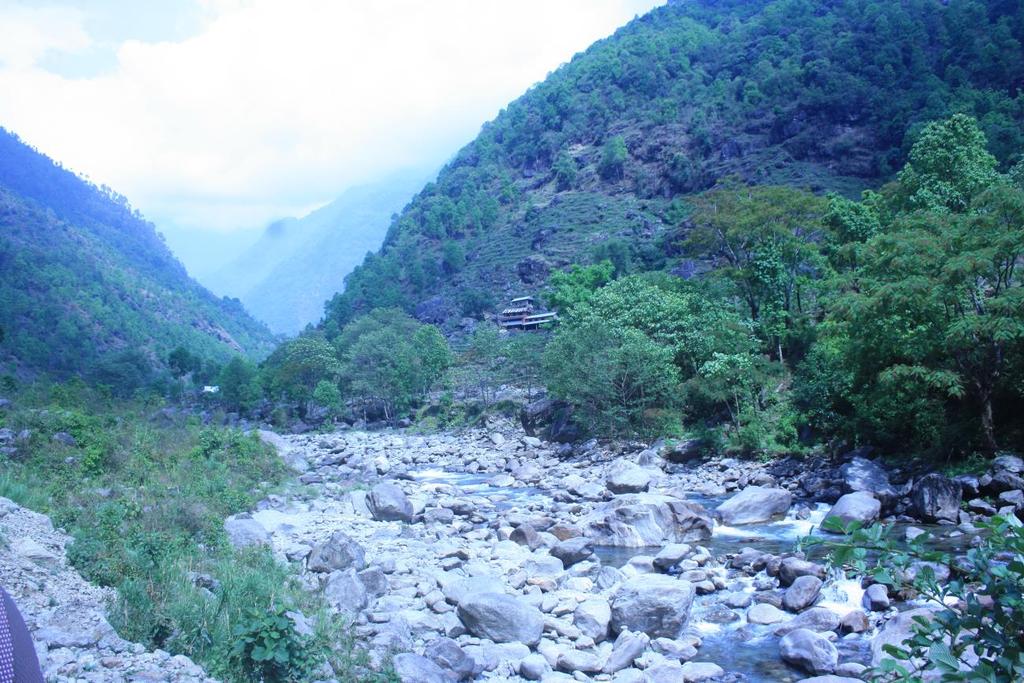
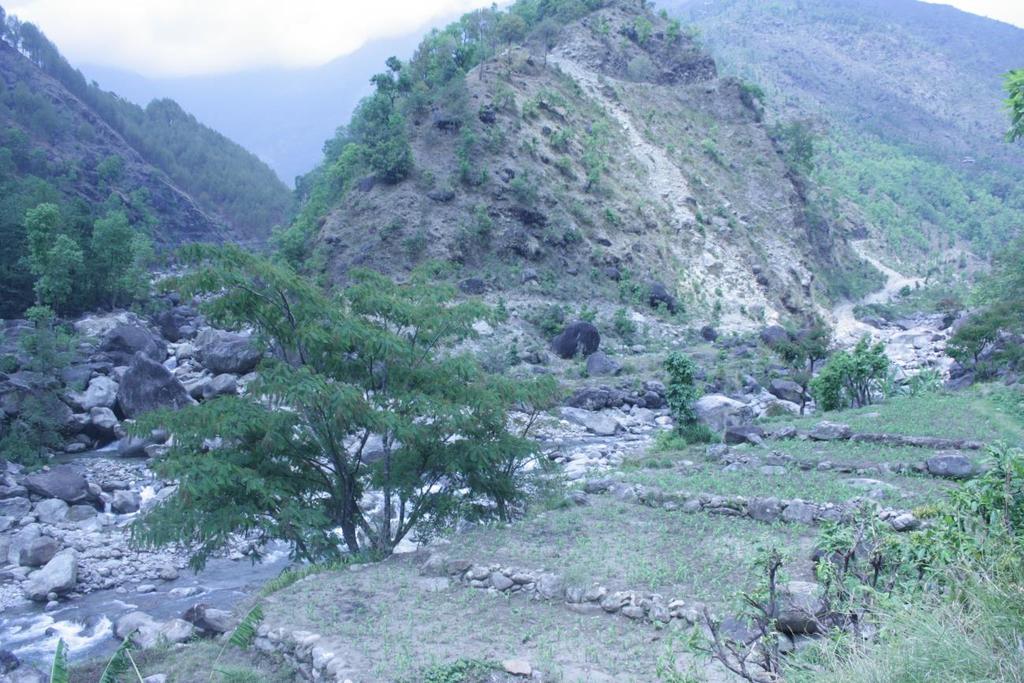
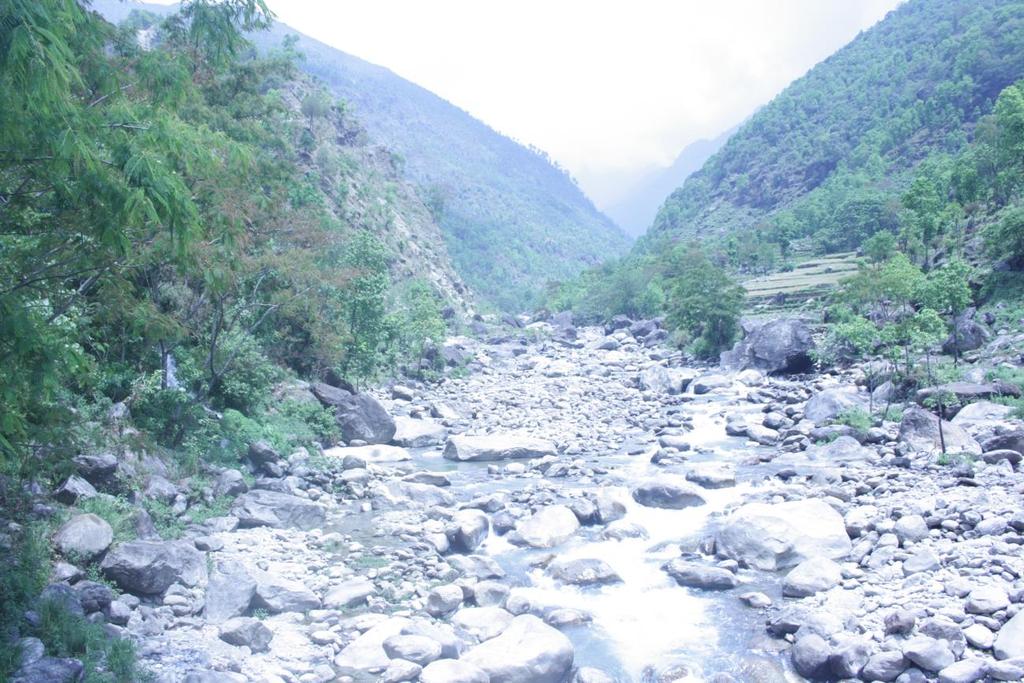
21 Photos of site
22