La Plata Electric Workshop June 8, Brad Nebergall Senior Vice President
|
|
|
- Logan Todd
- 5 years ago
- Views:
Transcription


1 Brad Nebergall Senior Vice President
2 Tri-State Background Founded in th anniversary year Not-for-profit, cooperative wholesale power supplier owned by the 43 distribution cooperatives it serves Diversity: residential, industrial, irrigation, tourism Serve >1.5 million customers (rural & lower income) Generation and purchased power portfolio 4,000 MW including coal, gas, oil, wind, solar & hydro Transmission: > 5,500 miles of 115, 230 & 345 kv Employees: 1,585 La Plata Electric ~ 6% of Tri-State member usage 2

3 Tri-State 2016 Financial Data Revenue: $1.4B Assets: $4.9B Liabilities: $3.8B Equity: $1.1B La Plata equity = ~$75M La Plata owns ~ 8% Financial Ratings: A 3

4 2016 Average Retail Rates Source: FERC Form 1, Utility Annual Reports, and RUS Form 7 Reports Cents / kwh *Data for San Miguel Power Association is from
5 Class A Rate Forecast $90 $80 $ % 0.30% 0.00% 1.40% 0.82% 0.00% 0.00% 0.76% 0.48% $60 $/MWh $50 $40 $30 $20 $10 $ LTFF Class A Rates 5

6 Tri-State Governance Board of Directors plays unusually strong role Approves all contracts > $500,000 value Meet monthly. Each member has one vote Strategic planning twice each year Common Priorities 1. Safety 2. Compliance 3. Reliability 4. Cost 6

7 Current Tri-State Resources
8 Tri-State Cost Components Generation 79% of overall Tri-State expense Majority of generation cost is fixed Some fuel and some operations and maintenance expense is variable Incremental cost is approximately $.02 / kwh Transmission: 21% of overall Tri-State expense 100% fixed cost 8
9 2016 Tri-State Resource Mix 2016 Capacity (%) 2016 Energy As a % of gross member sales Renewable 24% Oil <1% Market Purchases 12% Basin 12% Coal 43% Renewable 27% Coal 50% Oil 2% Natural Gas 19% Basin 9% Natural Gas 2% 9
10 U.S. Baseload Generation FPC Regulates Wellhead Prices Mid-1970s Severe Natural Gas Shortages Power Plant & Industrial Use Act 1978 Craig, LRS & Escalante
11 Coal Generation 13,500,000 13,000,000 12,500,000 12,000,000 MWh/Year 11,500,000 11,000,000 10,500,000 10,000,000 9,500,000 Reflects 16% reduction in amount of power generated from coal due primarily to market economics. The plants generating less energy are generally the two that are being retired due to cost
12 Tri-State Total CO2 Emissions 16,000,000 15,000,000 14,000,000 Short Tons/year 13,000,000 12,000,000 11,000,000 10,000,000 9,000,000 Reflects 19% CO2 reduction from 2011 peak without any coal unit retirements 8,000,
13 Tri-State Total NOx Emissions 20,000 19,000 18,000 17,000 Short Tons/year 16,000 15,000 14,000 13,000 12,000 11,000 10,000 Reflects 30% NOx reduction via controls and less fossil generation


")


14 Environmental Controls Sulfur Dioxide Removal Particulate Collection / Removal Nitrogen Oxide Reduction / Removal Flue Gas Desulfurization (FGD) Scrubber System Fabric-Filter Baghouses Electrostatic Precipitators Low Nitrogen Oxide Burners Selective Catalytic Reduction (SCR) Selective Non- Catalytic Reduction (SNCR) Combustion Optimization Craig Nucla Escalante Laramie River San Juan #3 Springerville #3 All of Tri-State s facilities meet or exceed Federal and State Clean Air and Water Standards 14
15 Coal Retirements & Renewables Three announced coal unit retirements Employee and community transition Costs Incremental cost of existing baseload generation is cheaper than variable renewables Employee transition Reclamation Accelerated depreciation 15

16 SCHEDULED COAL UNIT RETIREMENTS Unit Total Capacity (MW) Tri-State Capacity (MW) Retirement Date Original Retirement Date Increased Depreciation Expense San Juan #3 Waterflow, NM Nucla Nucla, CO Craig #1 Craig, CO $8.2 M $8.4 M $2.3 M TOTALS 1, $19 M
17 Resource Additions Year Resource Fuel Megawatts 2008 Rawhide Natural Gas Shafer Natural Gas Brush Natural Gas Kit Carson Wind Cimarron Solar Shafer Natural Gas Basin Electric Unspecified Colorado Highlands Wind Boulder Canyon Hydro CHW 2 Wind Ridgway Hydro Vallecito Hydro Shoshone Hydro Carousel Wind San Isabel Solar Solar Williams Fork Hydro Alta Luna Solar Twin Buttes Wind present Member Generation Various 113 * 18 Resource Additions Renewables: 592 MW Natural gas: 442 MW Unspecified: 75 MW Total 1,109 MW * Tri-State provided financial incentives 17
18 Summer Capacity Position 2017 LTFF Base Case Scenario 5000 Member Load and Losses + Planning & Operating Reserves + Contract Sales New resource need Gas and Oil Key Assumptions San Juan, Nucla & Craig 1 retired Brush capacity purchase expires 2019 Springerville Sale to SRP expires 2036 Normal load growth Coal Contract Purchases Federal Hydro

19 Industry Excess Capacity 19
20 Renewables
21 Tri-State Federal Hydropower Two purchased power agreements Colorado River Storage Projects Upper/Lower Molina, McPhee, Towaoc, Elephant Butte Loveland Area Projects Big Thompson, Estes, Flatiron, Green Mountain, Seminoe 2016 Data $82.4M power purchase expense Approximately 600 MW & 2,350,000 MWH/Year Served 15% of Tri-State member load 21

22 Tri-State & Member Renewables Excludes WAPA Hydro 22
23 Tri-State Wind & Solar Generation 2016 LPEA Total Load was 945 GWH 1,800 1,600 1,400 1,200 GWh/Year 1,
24 Tri-State Wind & Solar Expenditures $80 $70 $60 $ Millions/Year $50 $40 $30 $20 $10 $
25 Renewable Pricing Trends Price of new renewable generation is heavily impacted by federal tax credits & MACRS Wind PTC = +60% Solar ITC = +30% Utility-scale projects PPA prices New wind generation: 2 to 3 cents / kwh New solar generation: 3 to 4 cents / kwh Must add Integration costs to get total costs Dispatchable back-up redundant units Balancing Authorities charge.1 to.5 cents / kwh Transmission is a major issue for wind 25
26 Tri-State Renewable Prices Falling Wind & Solar Weighted Average Purchase Prices $90 Cimarron Solar Kit Carson Wind $80 $70 Colorado Highlands Opportunistically adding new projects Tri-State has benefited from improved technology & falling prices $60 $50 All Current Projects Average price is less than half the levels when we contracted for our first renewable projects $40 $30 Carousel Wind $20 Alta Luna, San Isabel & Twin Buttes

27 Relative Costs of Solar Generation Rooftop 2 kw: 10.3 / kwh Retail Rate: 12.5 / kwh Solar Garden 500 kw: 6 / kwh Tri-State Class A Rate: 7.4 / kwh Utility Scale Solar 30 MW: 4 / kwh Wholesale Market: 3 / kwh * Solar pricing assumes full ITC qualification; tax incentives set to phase out 27
28 Tri-State Solar Project Generation May 25, 2017 MW 28
29 Tri-State Wind Project Generation May 25, 2017 MW Because of high variability, Xcel charges ~ $5/MWh to integrate wind 29
30 Tri-State Load, Coal, Wind & Solar May 25, 2017 MW 30
31 Implications Wind and solar need to be supplemented and backed-up with conventional hydro, coal and gas generation Today, you cannot realistically replace coal 1:1 with intermittent renewables Battery or other storage technology could change this situation 31
32 Renewable Generation April 2017 Alta Luna 2% San Isabel 1% Other Renewables 1% Policy 115 5% Basin 9% RENEWABLES = 379 GWH 26% of Total Power Supply 32% of Member Sales Colorado Highlands 9% Carousel 17% WAPA - LAP 19% Cimarron 1% Kit Carson 5% WAPA - CRSP 33%
33 Member Generation
34 Tri-State Member Generation In 2001 Tri-State and each of its Members signed a new Wholesale Electric Service Contract that had provisions to allow for (but not require) 5% Member self-generation Tri-State Board Policy contains the specifics of the implementation details concerning this option Many cooperative generation and transmission organizations do not allow any member generation 34
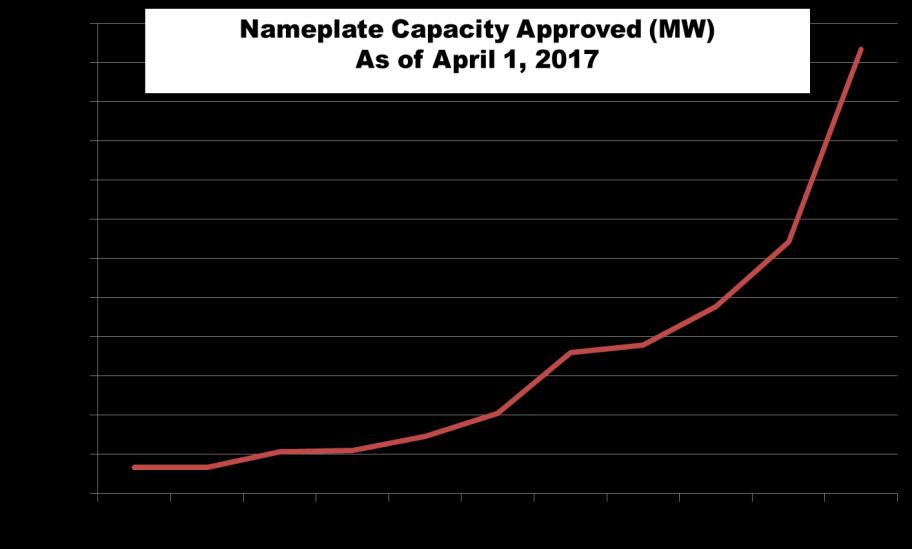
35 Member Generation Today 113 MW 61 Projects 18 Member Systems 35
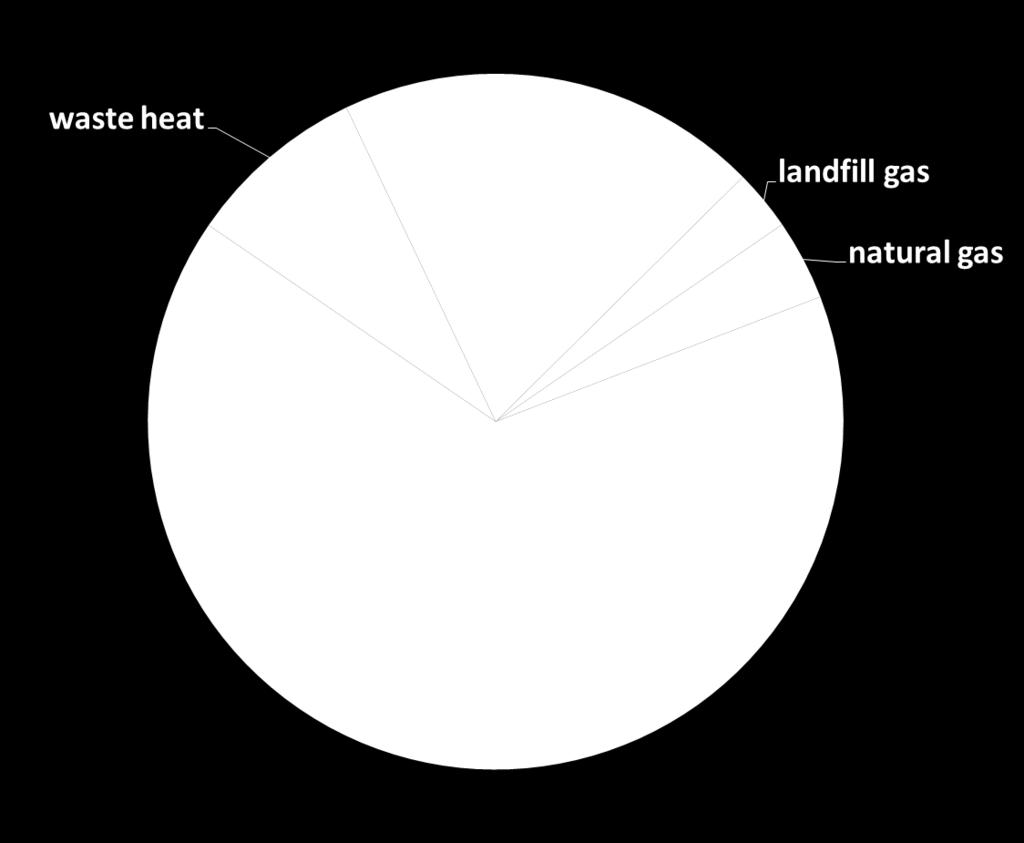
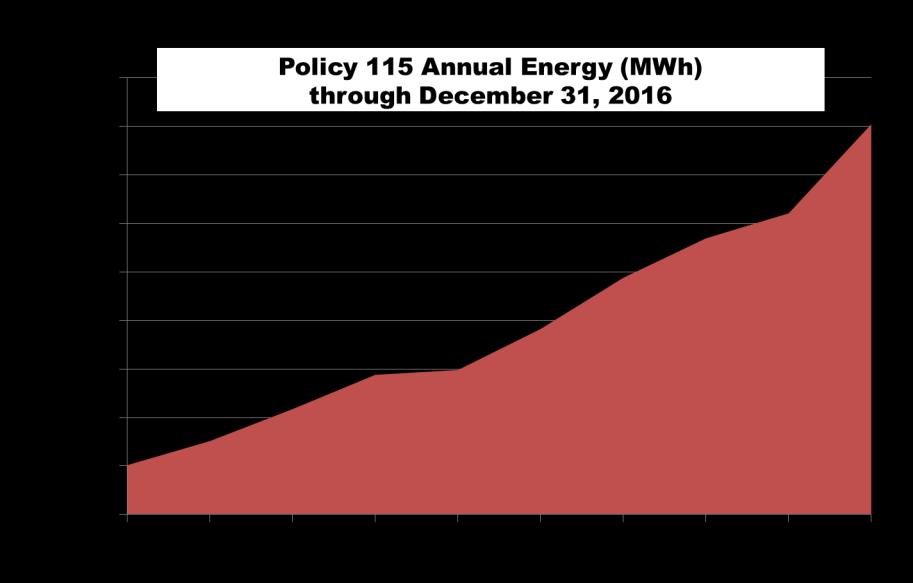
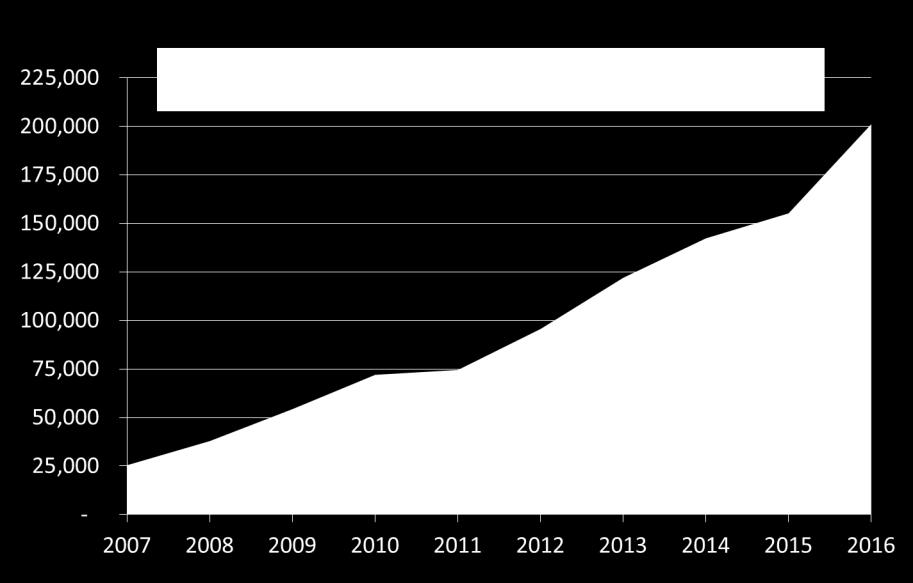
36 Policy 117 Payment History Year Policy 115 Projects Net Metered Projects Total Policy 117 Member Payments 2009 $270,483 $123,258 $393, $394,765 $326,699 $721, $1,089,958 $492,188 $1,582, $1,482,466 $238,979 $1,721, $2,108,641 $294,773 $2,403, $2,057,831 $364,931 $2,422, $2,181,250 $627,039 $2,808, $2,068,064 $522,580 $2,590,644 Total $14,643,905 36
37 La Plata Concerns
38 Two Questions 1. Why can t Tri-State members generate more than 5%? 2. Why can t Tri-State retire coal faster and add more renewables? 38
39 5% Member Generation Creates upward rate pressure Wholesale Electric Service Contract To increase 5% would need to be renegotiated Members can generate above 5% Sell to Tri-State Sell to others 39
40 Why Can t We Do More, Faster? Creates upward rate pressure Adding generation above our incremental cost increases rates Current Class A rate: ~ 7 cents/kwh Current market rate: ~ 3 cents/kwh Current incremental cost: ~ 2 cents/kwh Wind and solar, despite price reductions in recent years, are still priced above our incremental cost Don t need new capacity until 2025 Retiring units = accelerated depreciation & closure costs 40
41 Summary Tri-State is financially strong Tri-State & Members are currently leaders in renewable energy and more being done Three coal units are being retired Added MW of renewable and natural gas in last 10 years Aggressively pursuing RTO membership Operating efficiencies, reduced costs & easier to integrate variable resources (wind and solar) Tri-State rate forecast best in last 10 years 41
42