Hydrogeology of the Merti Aquifer. Impact of abstractions on drawdown of water level and salinity. Arjen Oord Jan de Leeuw (presenter)
|
|
|
- Gyles McDaniel
- 5 years ago
- Views:
Transcription


1 Hydrogeology of the Merti Aquifer Impact of abstractions on drawdown of water level and salinity Arjen Oord Jan de Leeuw (presenter)
2 Impacts of abstractions? Abstractions have two major geo-hydrological risks Boreholes running dry What is expected drawdown of groundwater as a result of the proposed abstractions Boreholes turning saline What is the risk of water from boreholes turning saline? Additional risks of reduced recharge (Climate change, dams and abstractions upstream) Acacia Water did research to assess these two risks 2
3 Overview of the presentation Current knowledge about the Merti Aquifer The Wajir Habaswein project Impacts on water level drawdown Impacts on salinity level of the groundwater Impacts of oil mining Impacts of dams upstream Mitigation options Conclusion 3
 50 billion m 3 fresh water Large")
4 What do we know about the Merti Aquifer Area Water Paper (2011) in Dutch 139,000 km 2 Merti Beds and related units 61,000 km 2 fresh-brackish groundwater 10,000 km 2 fresh water Habaswein + downstream Vertical Water depth: ~100 m Known aquifer thickness: m Possible thickness up to m Water volume: billion m 3 (fresh-brackish) 50 billion m 3 fresh water Large uncertainty around estimates
5 5


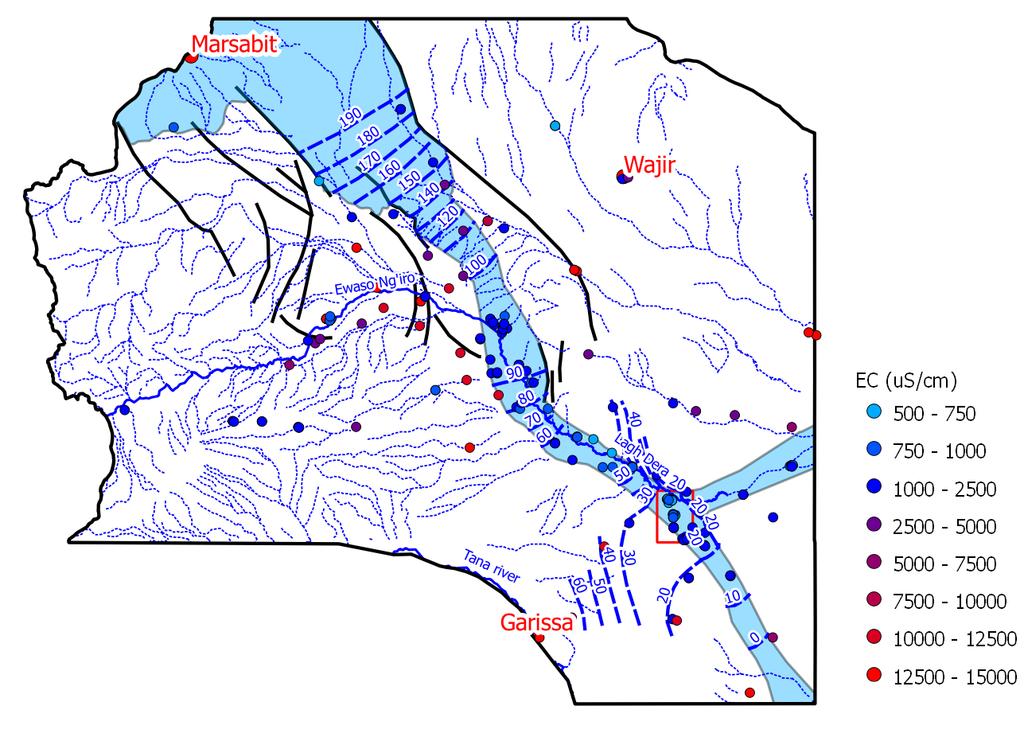
6 Geology of the Merti Aquifer Archers Post (150 km) Ewaso Ng iro fresh Habaswein Wajir (100 km) meter * * * * * * * * * * * * * salt * *
7 The Wajir Habaswein Water Supply Project Total proposed yield Habaswein well field: 6000 m3/day Well field: multiple wells (12) at safe distance (> 700m apart) Fresh water is currently abstracted in Habaswein, this much is certain The proposed water abstraction is far greater than current abstraction rates around Habaswein 7
 If groundwater levels drop below pump level / well screen à failure Drawdown depends on aquifer properties (thickness,")
8 Drawdown and the drying Boreholes? Pumping leads to lowering of groundwater levels (drawdown) If groundwater levels drop below pump level / well screen à failure Drawdown depends on aquifer properties (thickness, conductivity, storativity) and recharge. Most of these parameters are uncertain Uncertainty Modelling will give better estimates and insight 8
9 Modeling Drawdown MODFLOW (USGS) is a model that allows to estimate drawdown for a given set of parameters Model was run multiple times (stochastic model) using a range of parameters Variables included (95% confidence intervals): Volume abstracted: 6000 m 3 /day (from project report) Recharge: 0.6 to 40 Million m 3 /year Aquifer thickness: m Conductivity: 2 30 m/day (fine to coarse sand) Uncertainty of the variables that affect the range of calculated drawdowns Model was run 5000 times, using randomly selected parameter values from the estimated parameter ranges 9

10 Results Drying Boreholes Maximum drawdown: 10 m in 2050 Not a problem: modern wells have screens of 20 m or more Sphere of influence 10 km (in 2050) 10

11 Increased salinity Two processes responsible for increased salinity risk Upconing of groundwater from below Lateral flow of water from peripheral areas fresh 11
12 Salinity Large volumes of fresh groundwater known to exist in central Merti Aquifer (Habaswein) Quality (salinity) underneath fresh water is unknown Quality is decreasing in some boreholes, so saline water is expected to exist underneath fresh water Depth to saline layer? At least 40 m underneath current boreholes (or we would have seen more saline boreholes). Could be more than 200 m So, uncertainty approach 12
 13")
13 Risk of upconing Upconing is upward movement of saline groundwater caused by the abstractions Significant cause of salinity increase in similar situations elsewhere (e.g. coastal water supply the Netherlands) 13

14 Source: Deltares.nl 14
15 Upconing Wells located over saltwater can draw the saltwater upward, creating a saltwater cone that might reach and contaminate the well Severity is influenced by: Depth to salt water ( m below top aquifer) Density of salt water Degree of mixing (or sharp interface) Aquifer properties (e.g. porosity) National Limit Kenya salinity: 1500 mg/l 15
16 Modeling approach upconing To predict the upward movement of the saline water, the 3D MODFLOW groundwater model was used, combined with a transport routine (MT3DMS/SEAWAT) Transport modelling is slow (one complex model run can take hours or even a full day) Therefore, a limited number of (simplified) model runs was done, using different combinations of aquifer parameters and, more importantly, depth to the saline water. Sensitivity analysis of the parameter shows that depth to the saline layer is the most sensitive parameter. Unfortunately, this is very uncertain. 16

17 MODFLOW model 17
18 Salinity Model parameters Aquifer properties: Conductivity ( 2 30 m/day) Aquifer thickness ( m) Depth to saline layer (40 m 200 m) Assumptions: Sharp interface between fresh and saline layer Salinity is lower than seawater If the salinity in the well is higher than the national limit, the borehole cannot be used for water supply (failure) 18
19 Results upconing studies Model was run several times with various depths of the fresh to saline water layer Result: there is a 50% risk of boreholes turning saline in 2050 when depth is m below top aquifer Risk is much reduced at depth of >120 m below top aquifer Lateral movement of salt water: very small chance One run of the salinity risk assessment: 19
20 Salinity in 2050 This illustrates the differences in salinity in 2050, depending on at what depth the saline water is found currently: if more than 140 m below top aquifer, chances of drawing saline water decrease 20
21 Conclusion salinity risk assessment Risk of salinity depends on depth of boundary between fresh and saline water : It is very high when the boundary is at 40 m below aquifer top It is very low when boundary is at m below top aquifer Depth of boundary layer is unknown 21
22 Mitigation options salinity Establish depth of fresh to saline water boundary before implementation of phase 2 of the project Design create separate boreholes for Habaswein 1 to 10 km away from the main borehole field Provide artificial groundwater recharge Intercept saline water below the boreholes Mitigation is costly: should be incorporated in feasibility studies 22


")
23 Freshwater Injection Examples of mitigation Interception well (River) water infiltration 23
24 Scenarios Oil drilling Scenario: Oil Drillings Comes with significant groundwater abstraction Distance to nearest exploration site: more than 20 km Assumption: abstraction will be less than Estimated additional abstraction 400 m3/day nearest site In 2050, the Habaswein well field is not (yet) influenced by oil exploitation: oil drilling outside sphere of influence (based on current exploitation sites) If oil drilling takes place at a distance of less than 20 km, (chances of project failure will increase) 24
25 Scenarios - Upstream Dams Upstream Storage dams Plans for large scale storage dams in Ewaso Ng iro Dams decrease flooding, but increase baseflow Recharge Merti is believed to (partly) depend on flooding of Ewaso Ng iro Scenario: dams decrease Ewaso Ng iro recharge by 50% (rough estimate) Decrease in recharge as a result of dams is a slow process. Groundwater levels will not (yet) be influenced by dams in 2050, due to current distance to the flood area (over 50 km) These scenarios do not change the situation in Habaswein until
26 Conclusions hydrological risks Drawdown - Maximum drawdown 250 is 10 m; planned abstractions unlikely to lead to drying of boreholes. Existing (shallower) boreholes in Habaswein might be effected, depending on their depth. Salinity this could be a serious (irreversible) problem. Two ways to manage this Establish depth to the fresh to saline water boundary allowing more accurate predictions of upconing. Design the boreholes such as to mitigate negative effects on water supply to Habaswein (costly) Abstractions upstream not considered a threat in 2050, might be significant in the longer run 26

27 27