Urban Stormwater Management Achieving Compliance Goals
|
|
|
- Neil McCoy
- 5 years ago
- Views:
Transcription


1 Celebrating 20 Years of Excellence in Environmental Science & Engineering Urban Stormwater Management Achieving Compliance Goals MWEA Annual Conference June 25, 2013 K. Brian Boyer, P.E. Environmental Engineering Manager and Mark S. Kieser Senior Scientist Kieser & Associates, LLC

2 Overview Western Michigan University (WMU) Setting WMU Stormwater Concerns MS4 permit history and policy shift Compliance planning & sustainability SW controls and progress towards goals Implications of strategic planning The future of urban stormwater management


3 Kalamazoo River Watershed Lake Allegan Kalamazoo River Watershed 2,020 sq. miles SCALE (MILES) WMU MICHIGAN Portage & Arcadia Creek Subwatershed
 Control of land/infrastructure WMP for 64,000-acre Portage & Arcadia")
4 Setting Highly urbanized campus/watershed 807-acre campus 25,000 students 75% impervious cover Classified as high density residential MS4 (Phase II) Control of land/infrastructure WMP for 64,000-acre Portage & Arcadia Creeks


5 WMU Stormwater Concerns Direct SW discharges 64 outfalls to Arcadia Creek Preservation of facilities Protect infrastructure Reduce flood potential Regulatory compliance Bernhard Student Center Waldo Football Stadium Steam lines from Power Plant

6 WMU Stormwater Policy WMU voluntary stormwater permit (2000) Formal MS4 permit 2003 Internal 2008 Guidelines for SW Controls No new outfalls or discharges will be created Projects over 1-acre will have ZERO discharge Modeling required to evaluate stormwater systems Contractor requirements Routine maintenance Testing throughout construction
 TMDL Total Suspended Solids (tons/yr) Downstream City Flood Control Structure Runoff volume (ft 3")

7 TMDL Compliance Planning Project Identify stormwater footprint (1998 & present) Establish performance metrics for stormwater controls Phosphorus (lbs/yr) TMDL Total Suspended Solids (tons/yr) Downstream City Flood Control Structure Runoff volume (ft 3 /yr; gal/yr; acre-ft/yr) Campus flooding/infrastructure protection Determine WMU TMDL compliance status Identify future BMP options Integrate SW planning for campus projects Future BMP monitoring plan Pursue Stormwater Neutral TM goal Net-zero phosphorus load

8 GIS & Design Data Utility Infrastructure Data 1,426 storm structures 64 outfalls >28 miles of storm sewer piping Aerial Imagery Catalog Base Mapping Impervious vs. pervious surfaces LiDAR elevation data (2008) Engineering Designs Basis-of-design calculations As-built documents
 151.7 acres treated 18.")
9 1998 Campus SW Control Areas Campus area = 807 acres (including BTR park) acres treated 18.8% of campus TP Load = 764 lbs/yr


10 Methods/Tools DEQ Water Quality Trading Rule calculations Rainfall data to generate runoff Land use and impervious surface areas Event mean concentrations by land use (locally confirmed with monitoring) Kzoo River Urban Stormwater BMP Screening Tool Selectively calculates runoff volume, TP and TSS loading Calculates general stormwater treatment and costs Used in Kalamazoo River WMP
11 NPS Loading Calculations MI Trading Rules ML = EMC L x R L x K (Eq. 1) Where: M L = Loading factor from land use L (pounds/acre/year) EMC L = Event mean concentration of runoff from land use L (mg/l) R L = Total average surface runoff from land use L computed from Eq. 2 (in acres-in/year) K = Unit conversion factor of Runoff Equation: R L = [C P + (C I C P ) x IMP L ] x A L x I (Eq. 2) Where: R L = Total average annual surface runoff from land use L (acre-inches/year) C P = Pervious area runoff coefficient (0.20) C I = Impervious area runoff coefficient (0.95) IMP L = Fractional imperviousness of land use L A L = Area of drainage unit (acres) I = Long term average annual precipitation (inches/year)

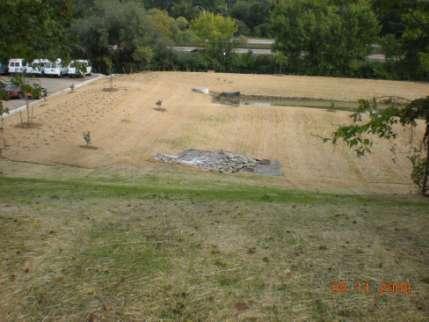


12 Parking Lot 23 Sediment Forebay Wet Detention/Infiltration Native vegetation Serves 32 acres Project Control Type Annual TP Reduction Annual TSS Reduction Annual Volume Reduction Parking Lot 23 Detention/ Infiltration 28 lbs 50% 4 tons 50% 30 ac-ft 50%


13 Chemistry Building Infiltration Vegetated Swales Native vegetation Serves 10.5 acres Project Control Type Annual TP Reduction Annual TSS Reduction Annual Volume Reduction Chemistry Building Infiltration 15 lbs 100% 2 tons 100% 18.5 ac-ft 100%

14 Richmond Center / Kohrman Hall Sub-Surface Retention & Infiltration Preserves Open-Space Serves 14 acres Project Control Type Annual TP Reduction Annual TSS Reduction Annual Volume Reduction RCVA/ Kohrman Infiltration 23 lbs 100% 3 tons 100% 27 ac-ft 100%


15 Howard / Stadium CMI Wet Detention & Infiltration Floodplain Enhancement Native Vegetation Streambank Restoration Serves 102 acres Project Control Type Annual TP Reduction Annual TSS Reduction Annual Volume Reduction Howard/ Stadium CMI Detention/ Infiltration 86 lbs 50% 27 tons 50% 120 ac-ft 50%


16 WMU Parkview Campus On-site Retention & Infiltration Native Vegetation Serves 197 acres Project Control Type Annual TP Reduction Annual TSS Reduction Annual Volume Reduction BTR/Parkview Campus Retention/ Infiltration 123 lbs 100% 24 tons 100% 150 ac-ft 100%

 59.")
17 Campus SW Control Areas 15 BMPs since acres treated including BTR (blue areas) 59.8% of campus BTR Park Off-Campus Contributing Areas
18 2011 WMU TMDL Compliance 1998 TMDL Baseline 764 lbs/yr On-Campus Controls only TMDL Goal 382 lbs/yr On-Campus and Off- Campus Controls (i.e., offsets) Off-Campus controls financially supported by WMU
19 Progress Towards Goals Current 2013 Status TMDL Compliance Stormwater Neutral TM (Net zero TP discharge) Runoff Volume Off- Campus Offsets
20 Arcadia Creek Loading to K-zoo River Total Phosphorus (TP) 2,091 lbs/yr Total Suspended Solids (TSS) 539 tons/yr Volume 769 Mgal/yr Table 3-1 of Portage-Arcadia Creek WMP. See : WMU Stormwater Reductions TP (lbs/yr) TSS (tons/yr) Volume (Mgal/yr) WMU BMPs Arcadia Creek Total 2, WMU Reduction to Creek (%)
21 Percent (%) Next Steps and New Opportunities Future On-campus SW Control Options 315 acres of main campus remain untreated Prioritization of future efforts Stormwater Control Location Lot 48-North of BHC Oaklands-Davis Hall Lawson- Lot 63 Lawson- Lot 64 Remaining Lot 23 Cost ($) $37,490 $51,280 $39,477 $88,036 $19,500 Vol ($/ac-ft) $18,256 $13,826 $10,783 $8,574 $70,020 TSS ($/ton) $4,109 $4,888 $4,916 $6,136 $6,060 TP ($/lb) $693 $698 $930 $1,207 $1,069 Priorities! Lot 48-North of BHC Stormwater Runoff Volume: Relative Comparison Percent of Combined Total (ac-ft/yr) Oaklands-Davis Hall Lawson- Lot 63 Lawson-Lot 64 Remaining Lot 23
22 Goldsworth Valley Pond Schnieder Hall upgrades Valley Dr. Arcadia Creek CMI Power Plant Streambanks Parking Lot 23 Lot 48 - North of BHC The Oaklands*/Davis Hall* Parking Lot 76 Lot 97 College of Health & Hum. Serv. Lawson Ice Arena - Lot 63, 75 Lawson Arena - Lot 70 Remaining Lot 23 Lawson Ice Arena - Lot 64, 63 Schneider Hall Read Arena Floodplain Chemistry Building Western View (Knollwood ) Apts. Parking Lot 95 Parking Lot 55 Kohrman Hall/RCVA KCMS Parking Lot Oliver/Cass Street Reconstruction Read Fieldhouse Sidewalk Baseball Field Brown Hall Lot 94 Rain Lot 94 Gardens Rain Garden (FTCH) TP Load Reduction ($/lb) Existing/Proposed BMPs Existing BMPs and Proposed BMPs TP Load Reduction Analysis ($/lb) TP Load Reduction Analysis ($/lb) (20-yr life cycle costs) $70,000 $60,000 $50,000 Existing BMPs TP ($/lb) Proposed BMPs TP ($/lb) Rain Garden $63,580/lb $40,000 $30,000 $20,000 $10,000 Increased Weir Height $96/lb Infiltration $1,879/lb $0
23 Cost Implications (2013 $s) Total Phosphorus Total Suspended Sediment Runoff Volume Area Served $150 - $5,500/lb $400 - $30,000/ton $180 - $13,000/ac-ft $200 10,500/acre ($5.3M valuation in 2013 $s) $4.18M initial investment 702 lbs/yr TP reduction = ~$5,950/lb (= ~$377/lb TP in 2013 $s) Compliance Planning Costs: ~$1,200/outfall (64 outfalls) ~1.5% of overall SW control initial investments (~14,040 lbs TP over 20 yrs)

24 Project Benefits and Outcomes Confirmed TMDL LA achieved (52% reduction) First MS4 to reach local TMDL reduction goal 59% of campus now treated by 15 BMPs New SW prioritization scheme with established metrics Approaching Stormwater Neutral TM goal Template for other MS4s

25 The Future for MS4s Pending EPA Stormwater Rule Expansion of MS4 areas/situations & programs New development performance standards Redevelopment performance standard Retrofit requirements Technology-based requirements Quantitative effluent or load limits

26 Questions? Brian Boyer, P.E. Environmental Engineering Manager Kieser & Associates, LLC Peter J. Strazdas Associate Vice President, Facilities Management Western Michigan University Celebrating 20 Years of Excellence in Environmental Science & Engineering