Barnegat Bay Water Quality and Quantity Monitoring Program
|
|
|
- Kerrie Lawson
- 5 years ago
- Views:
Transcription

1 Barnegat Bay Water Quality and Quantity Monitoring Program Helen Pang, Trish Ingelido, Ariane Giudicelli, Barbara Hirst, Amanda Lotto and Jill Lipoti Water Monitoring and Standards NJDEP 2013 Delaware Estuary Science & Environmental Summit January 29, 2013


2 Outline Background Monitoring Objectives & Components Selected Monitoring Results


3 Barnegat Bay Stressors and Ecological Concerns Ecological concerns include: - Degrading water quality - Loss of SAV - Occurrences of macroalgae & brown tide - Declining hard clams - Increasing stinging nettle populations Stressors include: - Rapid population increase, LU/LC Changes, intensive boating uses, nuclear facility cooling water discharge, nutrient & other pollutant loadings
 1. Close Oyster Creek Nuclear Facility Early 2.")


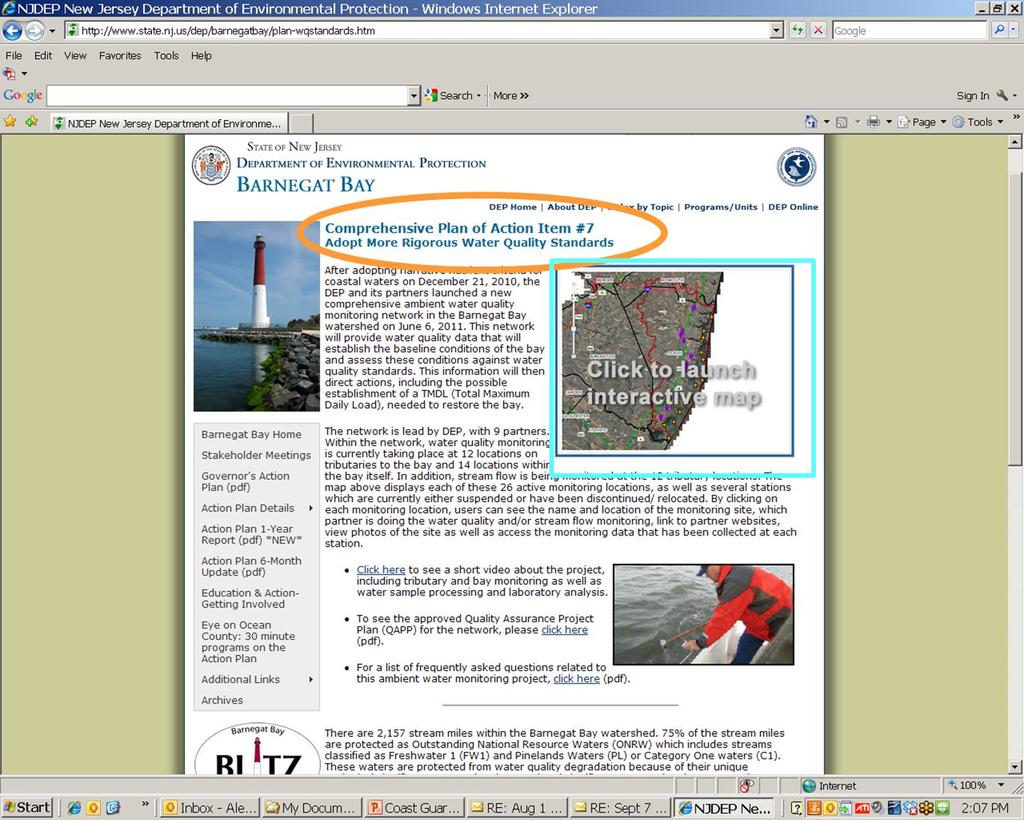
4 Governor s Action Plan for Barnegat Bay December 9, 2010 (to address ecological health of bay) 1. Close Oyster Creek Nuclear Facility Early 2. Fund Stormwater Mitigation Projects 3. Reduce Nutrient Pollution from Fertilizers 4. Require Post-Construction Soil Restoration 5. Acquire Land in the Watershed 6. Est. Special Area Management Plan 7. Adopt More Rigorous Water Quality Standards Monitoring Consortium & Model Development 8. Educate the Public 9. Fill Research Gaps 10 projects developed 10. Reduce Water Craft Impacts


5 Objectives of Barnegat Bay Water Monitoring Program Determine the locations and extent of water quality impairments Calibrate and validate modeling tools Identify numeric criteria or loading targets for nutrients Simulate the effect of potential future conditions Direct water quality restoration and/or TMDL development for the bay


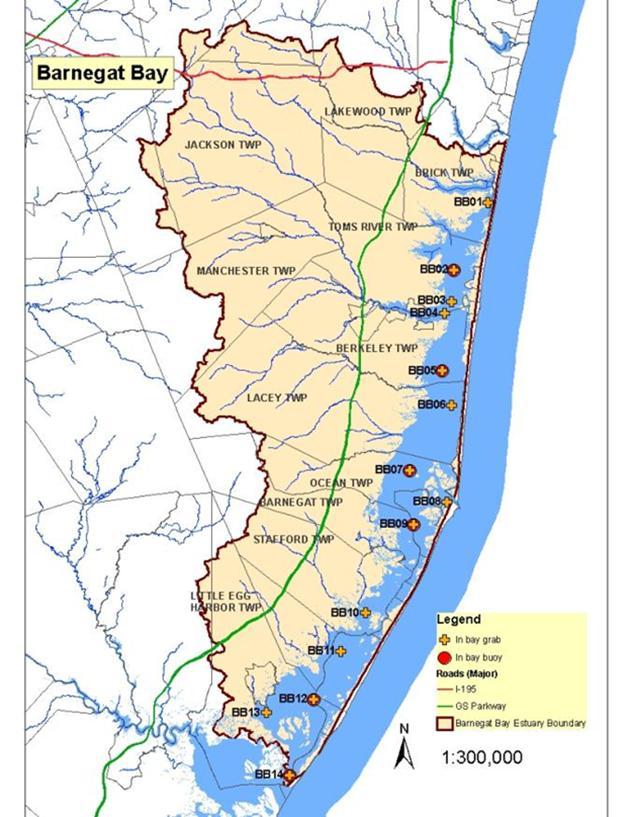
6 Monitoring Program Flow Monitoring DEP & USGS Tributaries: Manual measurement and gaging stations Bay: gaging stations and tide gage Water Quality Sampling DEP & Many Partners Discrete Water Quality Samples tributary and bay stations Continuous Monitoring fixed and buoy Intensive sample events summer 2012


7 Flow Monitoring Gaging stations 7 along the tributaries 3 on bay inlets 3 on the bay Manual measurements At the tributary stations where there is no gaging stations

 major tributaries for")


8 Water Quality Monitoring Stations Tributaries Stations (BT) Above the head of tide 13 (12) major tributaries for grab samples One fixed continuous monitoring station In-bay station (BB) 15 grab sample stations 1 fixed continuous WQ station 4 buoys

 12 Trib stations & 15 Bay stations March")


9 Discrete Sample Collection Phase 1 (6/11-3/12) - 13 Trib stations & 14 Bay stations - ~ biweekly sampling frequency - A total of 18 sampling events completed Phase 2 (4/12-12/12) 12 Trib stations & 15 Bay stations March to Sept.:4 times / month; Oct- Dec.: 2 times / month A total of 27 sampling events Surface and bottom samples Phase 3 (01/13 06/13) 7 Trib stations & 15 bay stations Jan and Feb 2 times/month, March- June 4 times/month Less bottom samples


10 Field Parameters Parameters Temp, DO, DO Sat, ph, Specific Conductance, Turbidity Laboratory Parameters TSS, BOD5, CBOD5, CBOD20, Dissolved and Total Nutrients, Alkalinity, Silica, TOC, DOC, Chlorophyll a Bay Only Surface and bottom samples, Salinity, Secchi Depth


11 Intensive Sampling Summer 2012 Two 4-days events July 23rd-26th August 13th-16th Bay 6 grab samples/day Tributaries 2 grab/day on day 1&4 Sondes deployed for duration of both events DO, DO Saturation, ph, Temp, Conductivity


12 Continuous Data Two fixed stations Salinity, Temp, DO, DO%, SC, ph, Turbidity Nitrate at Toms River Chl a at Mantoloking NWIS 4 buoys Salinity, Temp, DO, DO%, SC, ph, Chl a, Turbidity BB04, BB7A, BB10, BB14 Interactive Map
")
13 Avg Nitrogen Concentration at Tributary Stations (discrete sample 6/11 to 8/12)
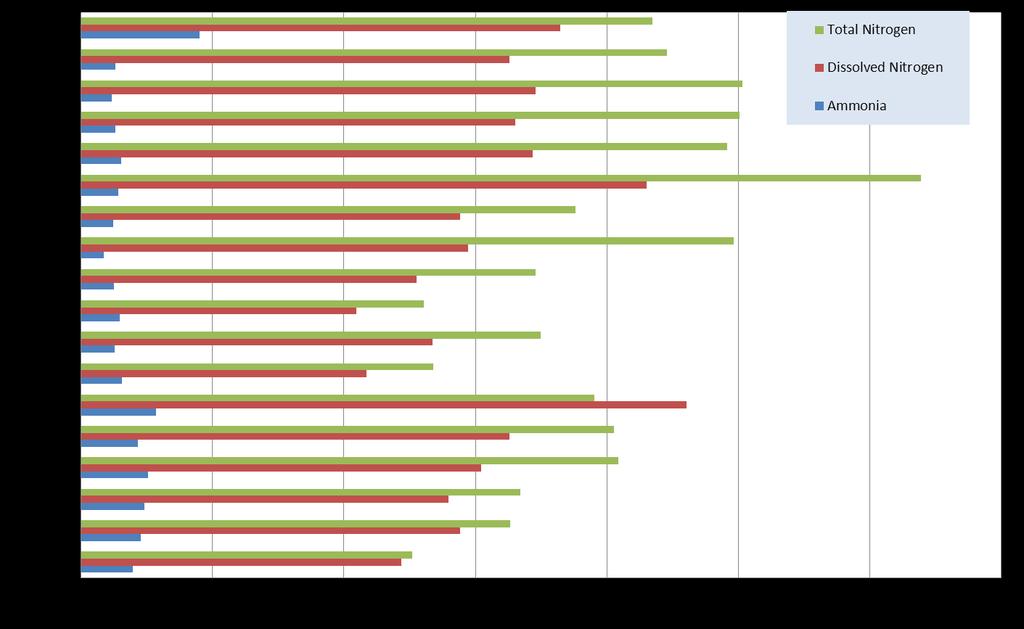

14 Avg Nitrogen Concentration at Bay Stations (discrete sample 6/11 to 8/12)


15 Avg Phosphorus Concentration at Tributary Stations (discrete sample 6/11 to 8/12)


16 Avg Phosphorus Concentration at Bay Stations (discrete sample 6/11 to 8/12)

17 July Intensive DO in Tributaries
18 DO, mg/l July Intensive DO in Bay BB00 BB04a BB05a BB07a BB10 BB13 BB08 BB Events

19 TP, mg/l July Intensive TP in Bay BB00 BB04a BB05a BB07a BB10 BB13 BB08 BB Events
20 July Intensive TP in Bay (cont.)
21 July Intensive TP in Bay (cont.)
22 TN, mg/l July Intensive TN in Bay BB00 BB04a BB05a BB07a BB10 BB13 BB08 BB Events

23 Chlor a, ug/l July Intensive Chl a in Bay BB00 BB04a BB05a BB07a BB10 BB13 BB08 BB Event


24 Data Use Adjustment of the future sampling Spatial distribution informs the segmentation of the bay model Populate, calibrate and validate the model Barnegat Bay-specific assessment

25


26 Partners

27 QUESTIONS?