EVALUATION CRITERIA OF URBAN TRANSPORT PROJECTS. Sonia Arora Urban Transport Expert IUT
|
|
|
- Garry Jenkins
- 5 years ago
- Views:
Transcription
1 EVALUATION CRITERIA OF URBAN TRANSPORT PROJECTS Sonia Arora Urban Expert IUT
2 Need & Objective Ministry of Urban Development, Government of India provides financial assistance to ULBs for implementation of various urban transport projects. Need to address Sustainable elements Social inclusive mobility solutions (accessibility and affordability), Environmental compatibility and Economic efficiency 2

3 In order to make sure that these projects are sustainable, IUT is preparing evaluation criteria for urban transport projects. 3
4 Methodology Issues with existing evaluation criteria Literature Review Categorisation of Urban Projects Stakeholder s Consultation Develop Final Evaluation Criteria 4
5 Literature Study (Policy) -Findings Criteria Emphasised by Different Policies % Land Use Integration Public NMT Infrastructure Freight Traffic Traffic Safety Reducing Management GHG Emissions Sustainable Indicators ITS Use of Cleaner Technologies Innovative Financing Mechanism NATIONAL CASE STUDIES INTERNATIONAL CASE STUDIES NUTP, 2006 NTDPC Report NMSH Brazil Singapore London WB Switzerland USA Czech Republic Finland Poland Russia 5
6 Literature Study (Reports) Indicators SOCIAL Public and NMT Modal Shift Network Coverage Accessibility Others Reduction in Accidents Road Security Reduction in Motorized Traffic on road ECONOMIC Per Capita Expenditures % Of GDP Contributed by Staff per Bus Ratio Travel Speed and Time Reduction in Fuel Dependency Land Consumption by Infrastructure ENVIRONMENT Energy / Fuel Consumption GHG Emissions Emissions Per Capita (No2, So2, SPM And RSPM) Percentage of Vehicle Fleet on Clean Fuels Benchmarking: Increase in Level of Service (Urban ) 6


7 Categorization of UT Projects Planning Public Infrastruct ure Non Motorised Urban Freight 7
8 Structure of Evaluation Criteria Format Introduction About Proposal Funding Governance Benefits Focus of discussion is on Benefits (Social, Economic and Environmental) 8
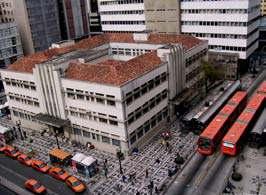
9 SOCIAL Public Benefits ECONOMIC AND FINANCIAL ENVIRONMENTAL 9 INCREASE IN Modal Shift Total Route Coverage (in %) Accessibility -% of population within 500 m of Bus Stops Average Number of Private Cars and 2W on Road per day Peak Hour Traffic per day (in PCU) INCREASE IN LOS Public Level of Usage of ITS Facilities INCREASE IN Earning per km Travel Time Per Capita Expenditure on INCREASE IN LOS Average Waiting Time for Public Users Average Speed of Buses in PT Route Extent of Non Fare Revenue Staff per Bus Ratio Operating Ratio INCREASE IN Percentage Share of Bus on Clean Fuels GHG Emissions per Capita Noise Pollution Energy Consumption INCREASE IN LOS Annual Mean Concentration Range (in µg/m3) NO2, SO2, SPM, RSPM
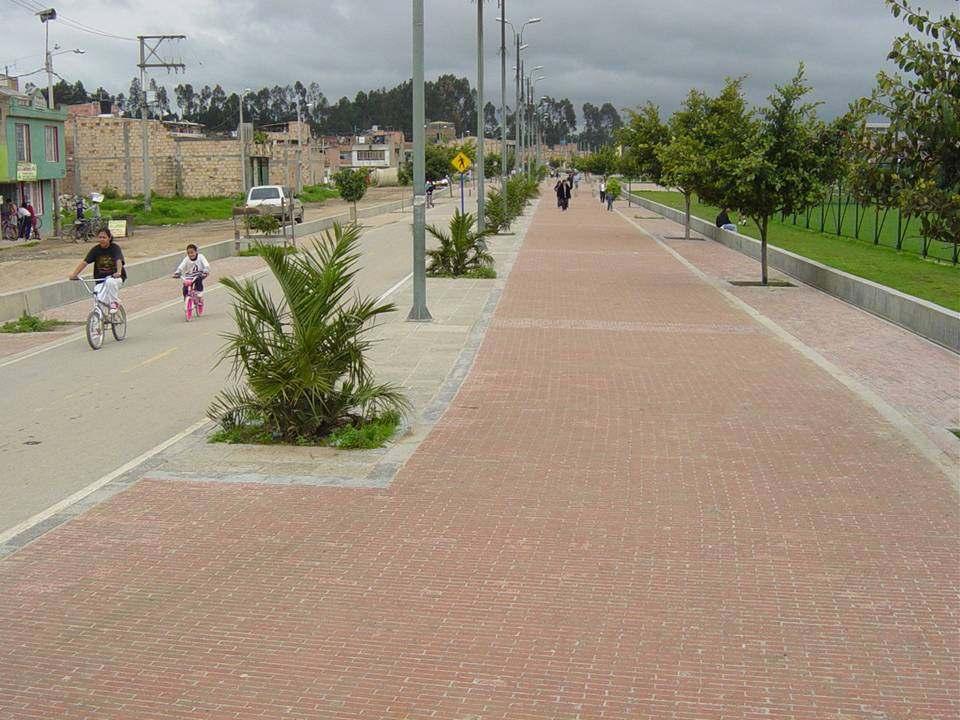
10 Non Motorized Benefits 10 SOCIAL INCREASE IN Modal Shift NMT Infrastructure - Pedestrian Crossings and Cycle Stands etc Vehicle km per Day (%) INCREASE IN LOS Street lighting (Lux) Percentage of City Covered with footpaths (wider than 1.5 meters) NMT Coverage (% network covered) NMT parking facilities at Interchanges (%) Fatality rate for pedestrian and NMT (%) ECONOMIC AND FINANCIAL Fuel Dependency Waiting Time for Pedestrians at Intersections INCREASE IN LOS Signalized intersection delay (%) ENVIRONMENTAL GHG Emissions per Capita Noise Pollution Energy Consumption INCREASE IN LOS Annual Mean Concentration Range (in µg/m3) NO2, SO2, SPM, RSPM
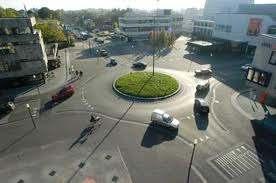
11 Infrastructure Benefits SOCIAL INCREASE IN LOS Availability of paid public parking spaces (%)(for parking) Difference in maximum and minimum parking fee in the city Fatality rate per lakh population Fatality rate for pedestrian and NMT (%) ECONOMIC AND FINANCIAL Waiting Time for Vehicles at Intersections (for improved junctions) Travel Time Average Waiting Time for Pedestrian at Signalised Intersection (for improved junctions) INCREASE IN LOS Average travel speed of personal vehicles Average travel speed of public transport ENVIRONMENTAL GHG Emissions per Capita Noise Pollution Energy Consumption (in million tonnes oil equivalent) INCREASE IN LOS Annual Mean Concentration Range (in µg/m3) NO2, SO2, SPM, RSPM 11
12 Urban Freight Benefits SOCIAL ENVIRONMENTAL Freight Vehicles during Day Time (%) Freight Vehicles during Night Time (%) Accidents due to Freight Vehicles INCREASE IN Percentage Share of Goods Vehicles on Clean Fuel GHG Emissions Noise Pollution Energy Consumption 12
13 Planning Benefits Social INCREASE IN Modal Shift from Various Modes to PT and NMT (%) Route Coverage for PT and NMT (%) PT and NMT Infrastructure REDUCTION/DECREASE IN Average Annual Growth of Cars & 2W Annual Reduction in Vehicle km Peak Hour Traffic / day (PCU) INCREASE IN LOS Public Pedestrian Infrastructure NMT facilities Level of usage of ITS facilities Parking Safety Integrated Landuse Economic REDUCTION/DECREASE IN Travel Time for Vehicles Waiting Time for Pedestrians at Intersections Waiting Time for PT Users Per Capita Expenditure on INCREASE IN LOS Average travel speed of personal vehicles Average travel speed of public transport Environmental INCREASE IN % Share of Motorised Vehicles on Clean Fuel REDUCTION/DECREASE IN GHG Emissions per Capita Noise Pollution Energy Consumption INCREASE IN LOS Annual Mean Concentration Range (in µg/m3) Nitrogen Dioxide Sulphur Dioxide SPM RSPM 13
14 Discussion Points SO OCIAL INDICATORS ECONOMIC INDICATORS ENVIRONMENT AL INDICATORS 14 Sustainable Indicators Modal Shift to PT and NMT Network Coverage of PT and NMT Infrastructure Traffic Volume Traffic Accidents Delivery of Service Quality Security - Street Light; PIS, GPS and CCTV Installation Accessibility to PT Total per capita transport expenditures % of GDP contributed by transport Staff per Bus Ratio Travel Speed and Time Reduction in Fuel Dependency Operating Ratio for Public Energy / Fuel Consumption by Mode GHG Emissions per Capita Emissions per Capita (NO2, SO2, SPM and RSPM) Traffic Noise Levels Percentage of Vehicle Fleet on Clean Fuels Planning Urban Project Categories Non Public Motorised Infrastruct ure Urban Freight
 Delhi -110 092. Tel.: (91) 11 66578700-09, Fax.: (91) 11 66578733 www.")
 with U shape seating arrangement IUT Member library with reading")
15 Thank You Office Address 1st Floor, AnandViharMetro Station Building, (Entry adjacent to Gate No 1) Delhi Tel.: (91) , Fax.: (91) Training room (1) with U shape seating arrangement IUT Member library with reading tables Training room (2) with group seating arrangement IUT administration section