Chesapeake Bay Updates. Agricultural Advisory Board June 18, 2014 Andy Zemba Interstate Waters Office
|
|
|
- Marlene Caldwell
- 5 years ago
- Views:
Transcription
1 Chesapeake Bay Updates Agricultural Advisory Board June 18, 2014 Andy Zemba Interstate Waters Office
2 Updates Total Maximum Daily Load (TMDL) Chesapeake Bay Watershed Agreement
3 Chesapeake Bay TMDL Progress December 2010: Chesapeake Bay TMDL published by EPA January 2011: Phase 1 Watershed Implementation Plan (WIP) 2011: EPA Revises Watershed Model Issue revised TMDL allocations March 2012: Phase 2 WIP Draft County Planning Targets
4 Chesapeake Bay TMDL Progress 2017 Evaluation: Have practices and controls in place that are expected to achieve 60 percent of load reductions necessary to achieve applicable water quality standards compared to 2009 levels. 2018: Phase 3 WIP 2025: Have all practices and controls installed by 2025 to achieve the Bay s DO, water clarity/sav and chlorophyll-a standards.
5 Two Year Milestones Chesapeake Bay Watershed Model Best Management Practices (BMPs) Loading (lb/yr) of Nitrogen, Phosphorous and Sediment Programmatic Milestones Regulatory Grants, Projects and Partnerships EPA Evaluation Measuring Progress


6 Chesapeake Bay TMDL Progress Where we are: Since 1985: Completed 27% of N reductions needed to meet the TMDL Additional 31.4 million pounds to be reduced by 2025 Downward revisions made to 2010 FSAsupplied data
7 Chesapeake Bay TMDL Progress Nitrogen Loads (Millions of Pounds/Yr) Checkpoint (60% of WIP) Reductions by 2017 Total % % % % Agriculture % % % % 8.51 Urban Runoff % % % % 2.63 Wastewater & CSO % % % % Septic % % % % 0.13 Forests % % % % -0.99

8 Chesapeake Bay TMDL Progress Since 1985: Completed 58% of Phosphorus reductions needed to meet the TMDL Additional one million pounds needed by results meet 2013 milestone goal WWTP Phosphorus loads met 2013 MS and on track for 2017 midpoint loads
9 Chesapeake Bay TMDL Progress Phosphorous Loads (Millions of Pounds/Yr) Checkpoint Reductions by 2017 Total % % % % Agriculture % % % % Urban Runoff % % % % Wastewater & CSO % % % % Forests % % % %

10 Chesapeake Bay TMDL Progress Since 1985: Completed 40% of TSS reductions needed to meet the TMDL Additional 648 million pounds to be reduced by 2025 Downward revisions made to 2010 FSAsupplied data
11 Chesapeake Bay TMDL Progress Total Suspended Solids (Millions of Pounds/Yr) Checkpoint Reductions by 2017 Total 2,998.8 % 2,553.6 % 2,565.0 % 2,353.1 % Agriculture 1, % 1, % 1, % 1, % Urban Runoff % % % % 79.9 Wastewater & CSO % % % % Forests % % % % -9.7
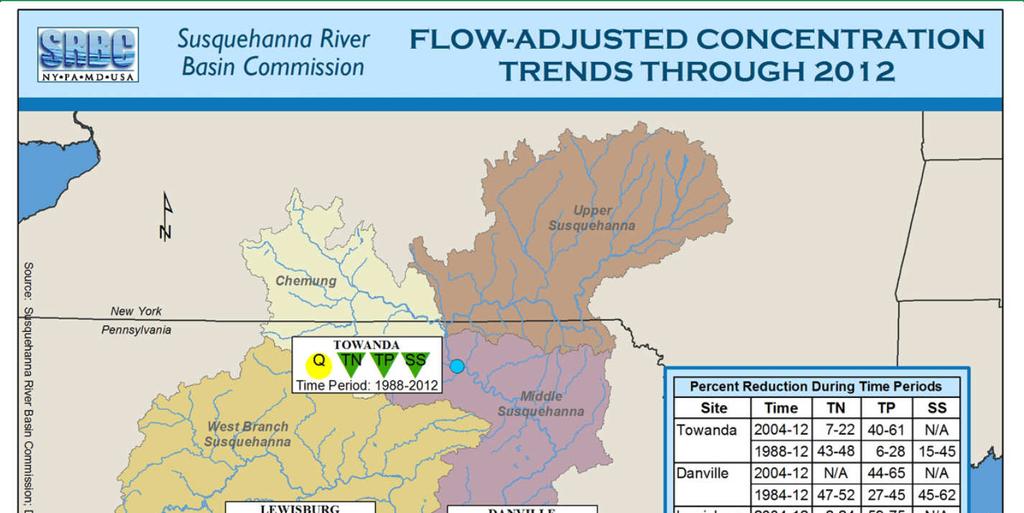
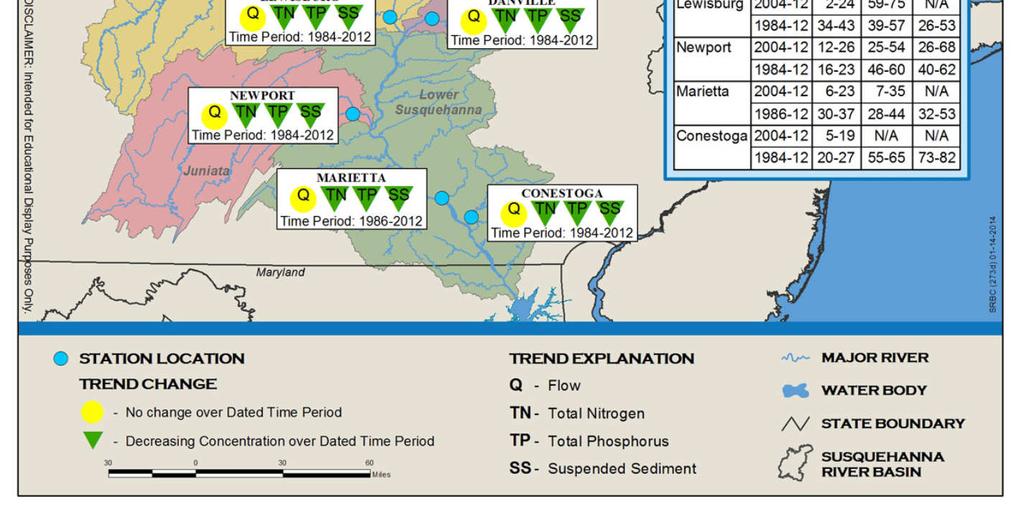
12 Monitoring 12
13 Chesapeake Bay TMDL Progress University of Maryland Center for Environmental Science annual report card Sectors have made steady progress Newly issued WWTP permit limits have reduced point-source phosphorus loads to below 2017 midpoint loading rates More aggressive implementation will be needed in other areas to meet 2017 goals
14 New Chesapeake Bay Watershed Agreement

15 Chesapeake Bay Program
16 New Chesapeake Bay Watershed Agreement Why Now? The Chesapeake 2000 Agreement is largely outdated Federal Agencies - Executive Order (EO) of 2009 The Congressional General Accountability Office called for the alignment of the federal EO Chesapeake Bay Strategy goals and the Chesapeake Bay Program Agreement goals Process started in 2011 Signatories eligible to receive funding
17 New Chesapeake Bay Watershed Agreement What s New? Headwater states (NY, DE and WVA) are invited to sign for the first time This agreement is shorter than ones in the past Goals with focused outcomes Management Strategies will be developed for outcomes Jurisdictions have flexibility to choose level at which they will participate
18 New Chesapeake Bay Watershed Agreement Sustainable Fisheries Goal: Blue Crab Abundance Outcome Blue Crab Management Outcome Oyster Outcome Forage Fish Outcome Fish Habitat Outcome
19 New Chesapeake Bay Watershed Agreement Vital Habitats Goal: Wetlands Outcome Black Duck Stream Health Outcome Brook Trout Fish Passage Outcome Submerged Aquatic Vegetation (SAV) Outcome Forest Buffer Outcome Tree Canopy Outcome
20 New Chesapeake Bay Watershed Agreement Water Quality Goal: 2017 Watershed Implementation Plans (WIP) Outcome 2025 WIP Outcome Water Quality Standards Attainment and Monitoring Outcome
21 New Chesapeake Bay Watershed Agreement Toxic Contaminants Goal: Toxic Contaminants Research Outcome Toxic Contaminants Policy and Prevention Outcome Healthy Watersheds Goal: Healthy Waters Outcome
22 New Chesapeake Bay Watershed Agreement Stewardship Goal: Citizen Stewardship Outcome Local Leadership Outcome Diversity Outcome
23 New Chesapeake Bay Watershed Agreement Land Conservation Goal: Protected Lands Outcome Land Use Methods and Metrics Development Outcome Land Use Options Evaluation Outcome Public Access Goal: Public Access Site Development Outcome
24 New Chesapeake Bay Watershed Agreement Environmental Literacy Goal: Student Outcome Sustainable Schools Outcome Environmental Literacy Planning Outcome Climate Resiliency Goal: Monitoring and Assessment Outcome Adaptation Outcome

25 New Chesapeake Bay Watershed Agreement What s Next? Development of Management Strategies for Outcomes Implementation
26 Andy Zemba DEP Interstate Waters Office