Significant Impact Levels (SILs) Guidance: Technical Basis. R. Chris Owen, EPA-OAQPS Tuesday, Nov. 15, 2016
|
|
|
- Darcy Logan
- 5 years ago
- Views:
Transcription

1 Significant Impact Levels (SILs) Guidance: Technical Basis R. Chris Owen, EPA-OAQPS Tuesday, Nov. 15, 2016
2 Basis for SILs technical analysis EPA position: insignificant impact = change in air quality that is less than the observed variability of air quality. Air quality based on ambient data, so analysis used ambient monitoring data. Compliance based on DVs, analysis accounts for the form and level of the NAAQS. Air Quality Variability approach: inherent variability in the observed ambient data due to the intrinsic variability of the emissions and meteorology controlling transport and formation of pollutants uses statistical theory and methods to model that intrinsic variability 2
3 Statistical method overview: bootstrapping Non-parametric resampling with replacement A method to determine variability of sample estimates Determine confidence intervals of sample estimate A sample statistic of interest (e.g., annual average) is computed many times for each monitoring site with historical data by recreating the sample via resampling, with replacement The results used to determine the amount of variability that typically occurs for ozone and PM in relation to the level and form of NAAQS.
4 Bootstrap methods Is based on AQS over the study period ( ). Accounts for the form of the NAAQS. For each monitoring site with data: Each 3-year scenario created by resampling the actual data to get 365 values for each of 3 hypothetical years. Then computed annual mean and 98 th percentile for PM or the 4 th high 8-hr mean for ozone for each year Combined 3 yearly (re)samples to compute 3-yr DVs, following CFR procedures for DVs This was repeated 20,000 times for each monitoring site Result distribution of 20,000 samples of the DVs for each site to estimate confidence interval for the DV (measure of variability) December 5,
5 Bootstrap(ish) example PM means Mean of estimates 95% CI 50% CI Counts Estimate of population mean from sample
6 Applying the results to determine SILs A goal of the analysis was to determine what impact levels would not be significant. EPA has selected the 50% confidence interval to represent a level of change that can be considered statistically insignificant. EPA has determined that the representativeness of air quality is best achieved by averaging the national variability from the three most recent 3-year design value periods, which will reflect recent air quality and also remove any bias from unusual years. December 5,
7 Results of the analysis When you consider relative variability (determined as a percentage of the NAAQS): No trends across the range of design values (i.e., variability not higher or lower at higher or lower concentrations). No spatial biases (i.e., no clusters of highly variably monitors and no regions of the US with higher variability) EPA has chosen to aggregate the results from individual monitors to a single national SIL Approach consistent with the historical approach of the Agency. Percentage variations are easily converted to concentration values (the mathematical form commonly used for SILs). December 5,

8 PM2.5 annual and 24-hr 50% confidence intervals

9 PM2.5 annual and 24-hr 50% confidence intervals
10 5.00% PM2.5 annual median PM hr median PM2.5 annual mean PM hr mean 4.00% Relative uncertainty 3.00% 2.00% y = x R² = y = x R² = % Design value year PM2.5 annual and 24-hr 50% confidence intervals, temporal trends Year/NAAQS 2014 annual 2013 annual 2012 annual Difference, median bootstrap vs actual 0.03% 0.03% 0.03% Avg. 25% CI span 0.78% 0.80% 0.82% Avg. 50% CI span 1.65% 1.70% 1.74% Avg. 75% CI span 2.83% 2.90% 2.96% Avg. 95% CI span 4.81% 4.95% 5.05% Year/NAAQS hr hr hr Difference, median bootstrap vs actual 0.79% 0.89% 0.84% Avg. 25% CI span 1.78% 1.79% 1.79% Avg. 50% CI span 3.75% 3.66% 3.63% Avg. 75% CI span 6.50% 6.37% 6.43% Avg. 95% CI span 11.41% 11.10% 11.30% Number of sites

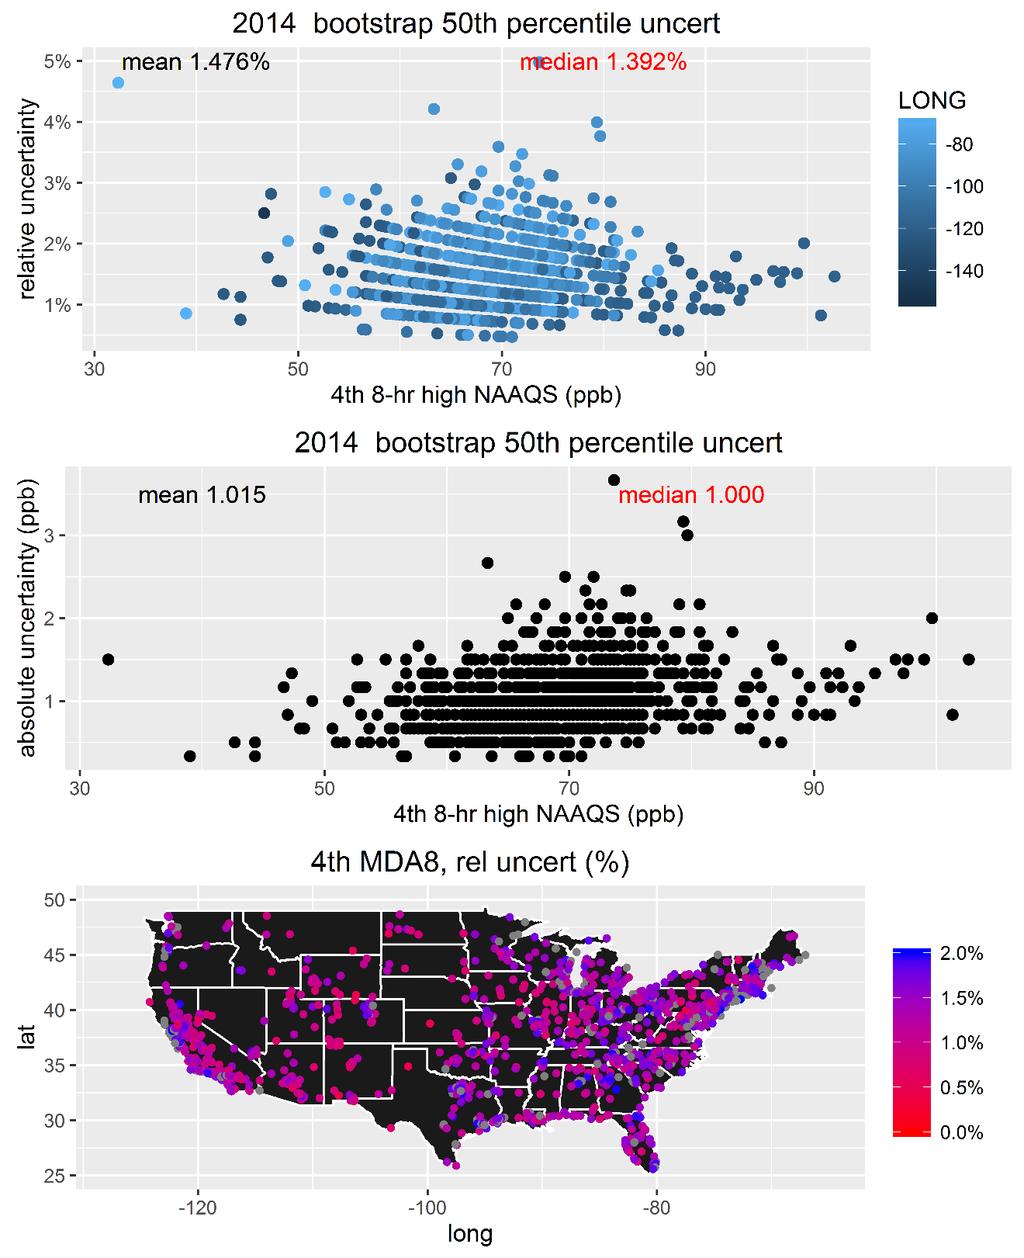
11 Ozone 50% confidence intervals
12 2.00% ozone daily median ozone daily mean y = x R² = Relative uncertainty y = x R² = % Design value year Year/NAAQS 2014 annual 2013 annual 2012 annual Difference, median bootstrap vs actual 0.47% 0.46% 0.45% Avg. 25% CI span 0.70% 0.71% 0.72% Avg. 50% CI span 1.39% 1.43% 1.45% Avg. 75% CI span 2.44% 2.52% 2.56% Avg. 95% CI span 4.28% 4.44% 4.52% Number of sites Ozone 50% confidence intervals, temporal trends
13 SILs Technical Basis Document Report includes several sensitivity analyses for: Temporal trends (inter-annual and intra-annual); and Regional spatial variability (comparisons of near-by monitors). Technical Basis for the EPA s Development of Significant Impact Thresholds for PM2.5 and Ozone, EPA-454/D , July,