Training of Auditors. Dr. Johannes Fresner
|
|
|
- Jasmine Snow
- 5 years ago
- Views:
Transcription

1

2 Training of Auditors Dr. Johannes Fresner
3 PiNE Audit
4 Scope Assessing energy costs Systemic view of the need for energy in the processes and infrastructure Implementation of good housekeeping measures Active involvement of company representatives Development of an improvement programme Implementation of a set of indicators Support of the companies in implementation of the suggested measures Auditing//

5 Energy audit
6 Implementation of full audit Detailed analysis of costs for electricity and heat and efficiency of use Written documented analysis of consumers (regarding technology used, operational procedures, control) using the PINE Audit tool Metering of specific energy consumption Perform these audits together with an internal auditor Carry on with the improvement process after the end of the PINE audit Focus on main production process, on infrastructure and premises
7 Implementation of measures (1) Support of the organisational implementation of good housekeeping and organisational measures Information or training for employees Providing (or assistance in) definition of process instructions Implementation of key performance indicators for energy Monitoring and controlling Implementation of the continuous improvement cycle
8 Implementation of measures (2) Economic feasibility or cost effectiveness analyses (payback period): Providing of information for investment assistance Support in the budgeting process Lists of suppliers Providing budget prices Assistance in producing requests and tendering documents Assistance in evaluation of proposal and selection of offers
9 Implementation of measures (3) Risk analyses of identified measurements Planning, resources and availability (human, time frame, budget, material, etc.) Legal advice Producing documents for permitting process Discussing the project with the authorities Assistance in the permitting process Emissions trading (where relevant)
10 Results for each companies Suggestions for corrective measures Estimates of implementation cost, on the basis of budget prices Estimation of potential operating cost savings and simple payback periods Comprehensive list of opportunities for energy conservation measures Proposed implementation programme Identification of potential funding sources Internal auditor is capable of carrying out the programme
11 PiNE - Indicators
12 How to perform an energy audit?
13 Key qualifications of auditors Diplomacy Ability to listen and good communication skills Critical attitude Flexibility in adapting to a company s culture Authority, recognition and support within the organisation Access to expert knowledge of relevant laws, regulations, codes and organisational standards Access to all levels of the organisation Access to senior decision-makers
14 Interview steps Interview persons at their workplace Conduct interviews during normal hours Explain your purpose Verify responses (confirm understanding) Check the facts (use other sources) Take notes, pictures and use checklists Make tentative conclusions (no secrets) Give opportunity to discuss other topics Thank for their time and cooperation
 Ask for explanations and examples Rephrase your question")

15 Questioning Techniques Ask question and then actively listen Rely primarily on open-ended questions Avoid closed questions (except to confirm) Ask for explanations and examples Rephrase your question for clarification Restate answer for your understanding Keep neutral; don t disagree or interrupt Ask suppose or what if questions Find basic flaws with simple questions Learn from remarks of nearby people

16 Steps of an energy audit
17 Schedule for an initial audit Meeting with director (company policy, products, plans) General technical introduction (introduction to site, responsibilities, layout, flow sheet) Site visit (in operation) Take notes (preliminary data, flowsheet, pictures: ASK BEFORE) Feedback session

18 Energy efficiency opportunities
 They love")

19 What to look at (1) They love his fried potatoes on exhaust heat
: Type Design Age")

20 What to look at (2) Plants and machinery (follow process flow): Type Design Age Maintenance Control General impression Consumption of energy Losses per plant, type and quantity

21 What to look at (3) Cable sizing and loss reduction Transformer optimization Motor loading Lighting system Electrical heating and melting furnaces Electric ovens

22 What to look at (4) Fans and blowers Exhaust ventilation system Pumps and pumping system Compressed air system Air Conditioning and refrigeration system Cooling tower system


23 What to look at (5) Steam generation boilers Steam audit and conversation Steam trap Condensate recovery system Thermal insulation Energy and material balance for unit operation Heat exchanger Waste heat recovery system Heat distribution system
24 Consider Options
25 Boilers (1) 5 % reduction in excess air increases boiler efficiency by 1% (or 1% reduction of residual oxygen in stack gas increases boiler efficiency by 1%) 22 C reduction in flue gas temperature increases boiler efficiency by 1% 6 C rise in feed water temperature brought about by economiser/condensate recovery corresponds to a 1% saving in boiler fuel consumption. 20 C increase in combustion air temperature, pre-heated by waste heat recovery, results in a 1% fuel saving. A 3 mm diameter hole in a pipe carrying 7 kg/cm 2 steam would waste 2,650 litres of fuel oil per year
26 Boilers (2) 100 m of bare steam pipe with a diameter of 150 mm carrying saturated steam at 8 kg/cm 2 would waste 25,000 litres furnace oil in a year 70 % of heat losses can be reduced by floating a layer of 45 mm diameter polypropylene (plastic) balls on the surface of a 90 C hot liquid/condensate A 0.25 mm thick air film offers the same resistance to heat transfer as a 330 mm thick copper wall A 3 mm thick soot deposit on a heat transfer surface can cause a 2.5 % increase in fuel consumption A 1 mm thick scale deposit on the inside could increase fuel consumption by 5 to 8 %
27 Compressed air Every 5 C reduction in intake air temperature would result in a 1 % reduction in compressor power consumption Compressed air leaking from a 1 mm hole at a pressure of 7 kg/cm 2 means power loss equivalent to 0.5 kw A reduction of 1 kg/cm 2 in air pressure (8 kg/cm2 to 7 kg/cm 2 ) would result in a 9 % saving in input power A reduction of 1 kg/cm 2 in line pressure (7 kg/cm 2 to 6 kg/cm 2 ) can reduce the quantity leaking from a 1 mm hole by 10 %
28 Refrigeration Refrigeration capacity reduces by 6 % for every 3.5 C increase in condensing temperature Reducing condensing temperature by 5.5 C results in a % decrease in compressor power consumption A reduction of 0.55 C in cooling water temperature at condenser inlet reduces compressor power consumption by 3 % 1 mm scale build-up on condenser tubes can increase energy consumption by 40 % A 5.5 C increase in evaporator temperature reduces compressor power consumption by %
29 Electric motors High efficiency motors are 4 5 % more efficient than standard motors Every 10 C increase in motor operating temperature beyond the recommended peak is estimated to halve the motor s life If rewinding is not done properly, efficiency can be reduced by 5 8 % Balanced voltage can reduce motor input power by 3 5 % Variable speed drives can reduce input energy consumption by 5 15 %; as much as 35 % of energy can be saved for some pump/fan applications Soft starters/energy savers help to reduce power consumption by 3 7 % of operating kw
30 Lighting Replacement of incandescent bulbs with CFL s offers % energy savings Replacement of conventional tube lights with new energyefficient tube lights with electronic ballast helps reduce power consumption by % 10 % increase in supply voltage will reduce bulb life by one-third 10 % increase in supply voltage will increase lighting power consumption by an equivalent 10 %
31 Buildings An increase in room temperature of 10 C can increase the heating fuel consumption by 6 10 % Installing automatic lighting controls (timers, daylight or occupancy sensors) saves % of energy. Switching off 1 tonne window A/C for 1 hour daily during lunch hour avoids consumption of 445 kwh.
32 Indicators
33 Aims of indicators Comparison of actual to planned situation (controlling) 0 Comparison of companies (benchmarking) Comparison in time (internal benchmarking)
34 Definition of Indicators Which figures show the goals (of my department) best? What shows best, if we do not meet these goals? How can we measure critical deviations best? What shows best, who is responsible for critical deviations? For which indicators can we get information easily and efficiently?
35 Indicators Relative indicators, which connect Energy consumption with production characteristics, costs, number of employees, building characteristics e. g.: - Emission intensity - Consumption indicators - Specific consumption - Efficiency - Specific cost
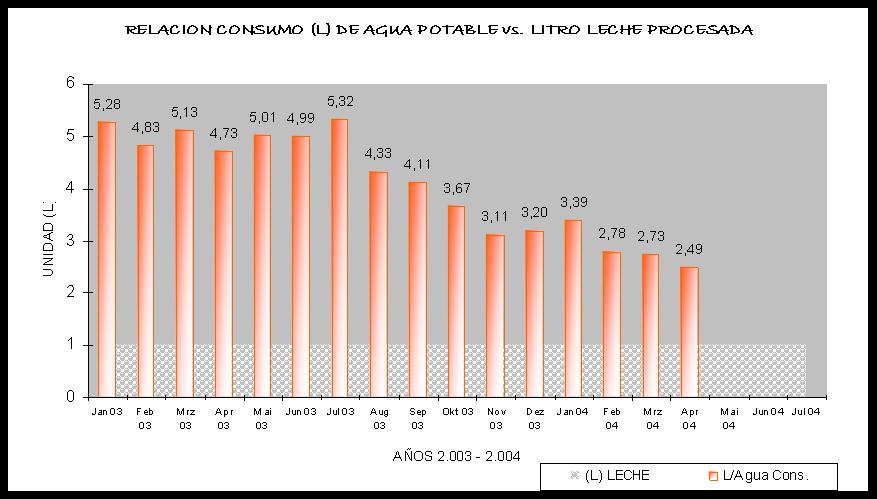
36 Indicator Examples Dairy: Consumption of energy (electricity and fuel) per liter of fresh milk Steam consumption per kilogram of butter Brewery: Heat consumption per liter of beer produced Electricity consumption per liter of beer produced
37 Example


38 Controlling A feedback system combines planning, reporting, status analysis, deviation analysis and corrective measures Planning Status Corrective action Deviation analysis Compare results with objectives and standards Take necessary action in case of deviation


39 Development of a set of indicators Targets: reduction of material losses, energy consumption, waste Improvement of awareness Comparison of the actual to the planned situation Comparison of companies


40 Objectives Specific Measurable Ambitious Realistic Short Term Medium Term Long Term Terminated


41 Specific heat consumption of a brewery
42 Definitions of Benchmarking A management technique to improve business performances. Used to compare performance between different organizations or different units within a single organizations undertaking similar processes on a continuous basis Aim to document and measure a key process and then compare the resulting data with those relating to similar process in other organizations
43 Benefits Improved understanding of work flows, processes and procedures Continuous improvement in work flows, processes and procedures New ideas leading to continues improvement and breakthrough change A view of work flows, procedures and processes in other organizations Breakdown of traditional barriers between branches and management and staff Improved productivity

44 Benchmarking - Example


45 Regression analysis Electricity consumption vs. milk production Fixed consumption Proportional consumption
46 Please note Define system boundary: Brewery: With/without canning, bottling, cleaning, Define base: Per hectoliter, per m³, kg, ton Check units: kwh, MWh, GWh, MJ, l, hl, m³, gal,
47 Intersectoral benchmarking Intersectoral units: Boiler Refrigeration units Air handling units Pumps


48 We go where we are looking!

49 If we know where we want to go, we can take small steps!

50 Continuous improvement Plan Do Check Plan and organise, Preassessment Detailed assessment, evaluate feasibility, implement pilot measures Check results Act Create basis for continuous improvement


51 PDCA Etc. Do Plan Plan Do Act Do Check Check Plan Act
52 Summary As a consultant, it is our first task to develop trust with the entrepreneur and the management team An audit is not a fault-finding exercise The objective is to identify opportunities for improvements Appreciate good practices when you spot them Safety considerations Be alert loose wires, moving parts, hot surfaces No loose clothing Covered shoes

53