Sumit Sharma, Ved Prakash Sharma, R Suresh TERI GRIHA SUMMIT 2016
|
|
|
- Kelly Copeland
- 5 years ago
- Views:
Transcription


1 Sumit Sharma, Ved Prakash Sharma, R Suresh TERI GRIHA SUMMIT 2016
2 Goal SDG Linkage Goal 1 Goal 2 Goal 3 End poverty in all its forms everywhere End hunger, achieve food security and improved nutrition and promote sustainable agriculture Ensure healthy lives and promote well-being for all at all ages 50% PM2.5 emissions from biomass based cooking 36% loss of grains due to Ozone pollution ~million die annually due to IAP Goal 7 Goal 13 Ensure access to affordable, reliable, sustainable and modern energy for all Take urgent action to combat climate change and its impacts Coal and biomass based energy Black carbon, Ozone contributors to warming


3 Contribution to OAP Contribution to global pool of warmers


4 Outdoor pollution inflow The quality of air inside buildings as represented by concentrations of pollutants and thermal (Temperature and Relative Humidity) conditions that affect the health, comfort, and performance of occupants Picture adapted from
5 While ambient air quality is slowly attracting attention, Indoor air quality is still ignored. US EPA: indoor air pollution poses a greater risk than outdoor air pollution - people spend 80-90% of their time indoors (Yu and Browers, 2013) IAQ is directly linked to health of the occupants of a building IAQ is an important concern both rural and urban VOCs indoors could be 2 to 5 times higher than outdoors IAP is a global issue due to adverse effects on human health (Tsakas, Siskos and Siskos, 2011) IAP ranked among the top five environmental health risks to the public by EPA.
6 IAP caused an estimated ~a million deaths in 2010 GBD-Lancet, 2012

7

8 Location Sources Pollutant Offices, government buildings HVAC systems, carpets, painting & polishing, household cleaners, aerosols, insecticides, pesticides and personal care products Primary: PM, VOCs Additional : CO, NOx, SO2 Parking areas Vehicular movement Primary : PM, CO, NOx, HC Additional : SO2, PAHs, Public places such as restaurants, hotels, libraries, shopping malls (misc. sources Rural households using biomass HVAC systems, carpets, painting & polishing, insecticides, pesticides, smoking, constriction activities Biomass burning for cooking, heating, waste burning. Kerosene burning for lighting, Primary: PM, VOCs, Nicotine Additional : CO, NOx, SO2 Primary: PM, CO, BC Additional : VOCs
9 Enclosed space inhabited by humans produce the following effects Oxygen level or CO 2 level Increase in temperature and humidity Increase in bio-aerosol and odor Accumulation of air pollutants
10 Domestic 58% Industry 0% 2010 Automobile Ind(Proc.) 0% 2% Paints Personal 8% care Oil& 2% Gas Printing 2% 3% Transport Food & oil 9% 1% Open burning 6% Evap. Trans Refinery 3% DG sets 2% 1% Forests 4% Refinery 3% Evap. Trans 19% Open burning 3% Ind(Proc.) 4% Waste 0% DG sets 0% Tyres 0% Printing 6% Oil& Gas Personal 4% care 5% 2030Transport Forests Food & oil 9% 2% 1% Industry 1% Paints 25% Domestic 15% Power 0% Automobile 1% In 2010, paints contribute to 8% NMVOC emissions in India. In next 20 years, the share is about to grow to 25%. This has implications over outdoor and indoor air quality.
11 Source profiles from SPECIATE, Wei et al, 2013

12
13

14 Solid-fuel using households Balakrishnan et al (SRU group)
15 Gautam et al, 2012
16 Project SURYA
17 Pollutant NO 2 CO VOCs RSPM Pesticides SO 2 Asbestos O 3 Health effects Type: Immediate: Causes: irritation to the skin, eyes and throat, cough etc Type: : Immediate; Causes: headache, shortness of breath, higher conc. May cause sudden deaths. Type: : Immediate; Causes: Liver, kidney disorders, irritation to the eyes, nose and throat, skin rashes and respiratory problems. Type: : Cumulative, Causes: Respiratory Illness (upper and lower), Acute (Asthma) and chronic (COPD), Lung cancer, Type: : Immediate; Causes: Skin diseases Type: : Immediate; Causes: lung disorders and shortness of breath Type: : Cumulative; Causes: Lung cancer Type: : Immediate; Causes: eyes itch, burn, respiratory disorders, lowers our resistance to colds and pneumonia.

18 Building occupants experience acute health and comfort effects which is linked to time spent in the building, but no specific illness or cause identified. Not a clinically diagnosable disease. Causes of SBS 60% 50% 40% 30% 20% 10% 0% Inadequate ventilation Contamination from inside building Contamination from outside building Microbial contamination Contamination from building fabric Unknown sources EPA

19
20 Effect of temperature, RH and CO2 Temperature Relative humidity CO 2 direct impact on perceived comfort and, concentration and productivity As per ASHRAE Standard 55, recommended temperature ranges termed "comfortable" are 22.8 to 26.1 C in the summer and 20.0 to 23.6 C in the winter. Too high RH can contribute to the growth and spread of biological contaminants RH below 25% - increased discomfort and drying of skin and mucous membrane As per ASHRAE Standard 55, indoor humidity levels to be maintained between percent for optimum comfort. Provides good indication of ventilation rates Generated in indoor primarily through human metabolism CO 2 build up in indoor is attributed to inefficient or nonfunctioning of ventilation system As per ASHRAE, above 1000ppm CO 2 requires adjustment of building s ventilation system Building shows SBS symptoms if CO 2 concentration > 1000
21 1. Canada 2. Singapore 3. UK 4. Germany 5. USA 6. China 7. India??
22 Parameter WHO guideline value* ASHRAE** OSHA*** NAAQS/EPA (2000)**** PM 10 50µg/m 3 (24-hr mean) -- 15mg/m 3 (total) 150µg/m 3 (24-hr) PM µg/m 3 (24-hr mean) -- 5mg/m 3 (resp.) 65µg/m 3 (24-hr) SO 2 20µg/m 3 (24-hr mean) -- 5ppm (8-hr) 140ppb (24-hr) 75ppb (1-yr) NO 2 200µg/m 3 (1-hr) 40µg/m 3 (annual mean) -- 5ppm (8-hr) 53ppb (annual) 100ppb (1-hr) CO 10ppm (8-hr) 9ppm (8-hr) 50ppm (8-hr) 9ppm (8-hr) CO ppm (8-hr) 5000ppm Humidity -- 30% - 65% -- Temperature F 74.5 F ( o C)(winter) 73 F 79F o C)(summer) -- *** Occupational Safety and Health Administration Permissible Exposure Limit this level is a time-weighted average and is an enforceable standard that must not be exceeded during any eight-hour work shift of a 40-hour work week ** ASHRAE (American Society of Heating, Refrigerating and Air-conditioning Engineers Inc.) Standard 55 * WHO air quality guidelines global update 2005 and WHO guideline value for the classical air pollutants (WHO 1999a **** The National Ambient Air Quality Standards (NAAQS) were developed by the U.S. Environmental Protection Agency (EPA) under the Clean Air Act (last amended in 1990). These enforceable standards were developed for outdoor air quality, but they are also applicable for indoor air contaminant levels. The concentrations are set conservatively in order to protect the most sensitive individuals, such children, the elderly, and those with asthma.
23 *Unless otherwise specified, values are given in parts per million (ppm) *Where no time is specified, the averaging time is eight hours.
24
25 Source Management Preventing use of substances containing harmful materials Administrative Engineering Controls Controls Controlling Controlling human factors activities causing causing exposure indoor air Policy making pollution
26 Lot of indoor air pollutants directly linked to items of daily use Cleaning items Fuels and cook-stoves (low VOC products) (Clean fuels) Building materials and furnishings (low VOC products) Building occupants may be the source of pollutants - perfumes or colognes, cigarette smoke (OSHA, 2011)
27 Work schedules Education and Awareness Eliminate or reduce the amount of time a worker is exposed to a pollutant Reduce the amount of chemicals being used by or near workers Control the location of chemical use Inform about the sources and effects of pollutants Inform about proper operation of ventilation system Awareness about clean alternatives, mitigation solutions Housekeeping Prevent dirt from entering the environment Dispose garbage timely Store food properly Choose cleaning products, methods that minimize introduction of pollutants into the building
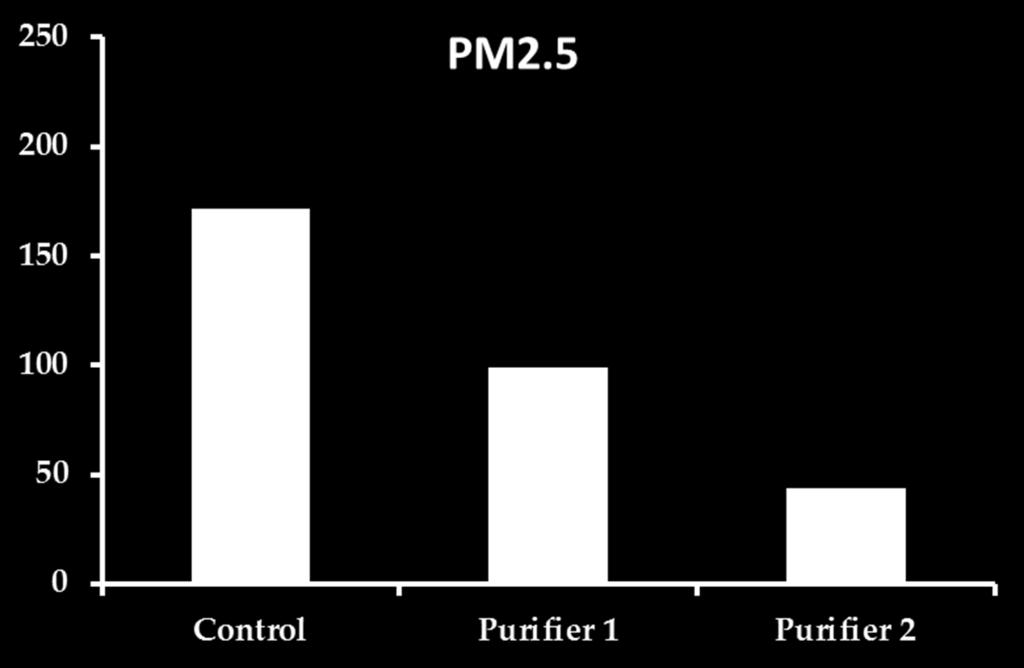
28 HVAC (heating, ventilation, and air conditioning systems) control and management IAQ improving plants Air purifiers
29

30
31 National standards and/or guidelines on indoor air quality Verifying claims of products certifications Evaluation of important existing buildings GRIHA Rating evaluation to be included in building projects Improving outdoor air quality will help in improving IAQ also and vice versa.

32 Thank you