MULTI SITE PERFORMANCE REVIEW OF LIQUID ACTIVATED CARBON FOR GROUNDWATER TREATMENT. Carlos Ortiz REGENESIS
|
|
|
- Miles Holmes
- 5 years ago
- Views:
Transcription
1 MULTI SITE PERFORMANCE REVIEW OF LIQUID ACTIVATED CARBON FOR GROUNDWATER TREATMENT Carlos Ortiz REGENESIS


2 Carbon Acronyms/Definition CBI Carbon Based Injectates GAC Granular Activated Carbon PAC Powdered Activated Carbon LAC Liquid Activated Carbon GAC PAC LAC
3 Principal Technology Features Rapid reduction of groundwater concentrations Multiple order of magnitude concentration reductions in days / weeks Acceleration of contaminant biodegradation Elimination of low concentration performance tailing Ability to secure stringent clean up targets Wide subsurface dispersion Efficient fieldwork Ability to address areas of restricted access, deep plumes etc. Long term efficacy The reagent is not consumed it regenerates in situ
4 The Reagent what it is Colloidal activated carbon (1 2 µm) Size of a bacterium suspends as liquid Huge surface area extremely fast sorption A highly dispersive, injectable sorbent and microbial growth matrix Sorbent Rapid drop in dissolved phase contaminant concentration Immediate risk reduction Microbial growth matrix Accelerated bio destruction of sorbed mass Ability to secure clean up to much lower targets
 Granular Activated Carbon (GAC) Powdered")
5 Technical Challenge How do we Distribute Carbon In Situ? Physical Differences Between PAC vs LAC Carbon Type Particle Size (micrometers) Granular Activated Carbon (GAC) Powdered Activated Carbon (PAC) Liquid Activated Carbon (LAC)
 Medium Sand 8-50 Fine Sand 5-20 Silt 3-8 *Pore throat diameters of typical aquifer materials range (Nelson, 2009): CBI Product Type Particle Size")
6 Technical Challenge How do we Distribute Carbon In Situ? Grain Size Pore Throat Diameter (micrometers) Medium Sand 8-50 Fine Sand 5-20 Silt 3-8 *Pore throat diameters of typical aquifer materials range (Nelson, 2009): CBI Product Type Particle Size (microns) Application Pressure Required Results in Aquifer Fracturing? Granular Activated Carbon (GAC) High Pressure (>60 psi) YES Powdered Activated Carbon (PAC) High Pressure (>60 psi) YES Liquid Activated Carbon (LAC) 1-2 Low Pressure (<60 psi) NO

,")
7 2015, T. Fox, Colorado Division of Oil and Public Safety, Petroleum Remediation Using In-situ ActivatedCarbon (A review of results), presented at the National Tank Conference, Phoenix, AZ.


8 PlumeStop Powdered Activated Carbon
9 Evidence of Dispersive Flow (low pressure application) Pre-app Post-app Distribution of PlumeStop through target zone visually apparent Even dispersion evident through permeable strata 2015 All Rights Reserved. REGENESIS and REGENESIS product(s) are registered trademarks of REGENESIS Remediation Products.


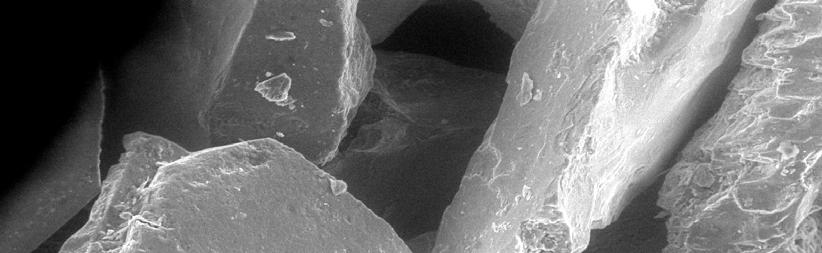
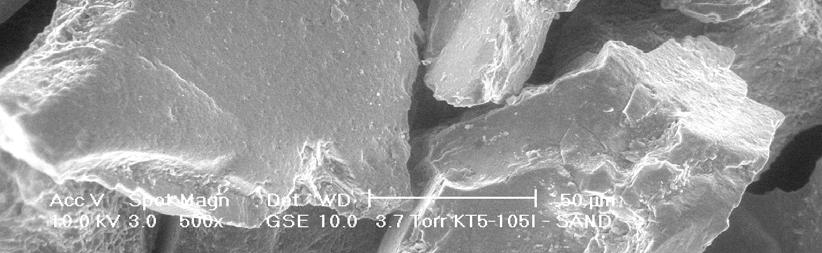
10 Electron Microscopy (SEM) of Soil Particles Before PlumeStop After PlumeStop

11 PlumeStop : reagent distribution

12 Contaminants Sorbed, Now What? 3 Primary Methods of Contaminant Destruction Monitored Natural Attenuation/Intrinsic Remediation Aerobic Treatment Electron Acceptor Addition, Sparging Anaerobic Treatment Slow release electron donors Lactate, recirculation systems 2015 All Rights Reserved. REGENESIS and REGENESIS product(s) are registered trademarks of REGENESIS Remediation Products.
13 What it Treats? CVOCs including ethenes and ethanes Petroleum Hydrocarbons (TPH, BTEX, etc.) MTBE Pesticides PFCs 2015 All Rights Reserved. REGENESIS and REGENESIS product(s) are registered trademarks of REGENESIS Remediation Products.
14 PlumeStop + PFOA/PFOS: retardation factor Example: PlumeStop barrier width 16 (single application at mid range dose) 160 per year seepage velocity 100 µg/l influent concentration Groundwater transit time 36.5 days PFOA transit time* = 20,800 days ( 57 years) PFOS transit time* = 73,000 days (200 years) This is at 100 µg/l At lower influent concentrations, the retardation quickly becomes much greater. * transit time peak based on individual components
15 PlumeStop Applications July 2017
")

 = 50")

16 Numbers Sites = 112 States = 28 Countries = 6 (USA, Canada, Italy, Belgium, UK, Sweden) Scale Pilot 25 (22%) Full 87 (78%) PlumeStop Applications July 2017 Contaminants Principally Hydrocarbons (aerobic bio) = 43 Principally Solvents (anaerobic bio) = 50 Comingled / no dominant class = 6 Other contaminants of note: PAH, freon 11, MtBE, TBA, chlorobenzene, PFAS
17 >95% reduction within 90 days - 65% (typically to < MDL) >90% reduction within 90 days - 70% >80% reduction within 90 days - 90% <65% reduction within 90 days - 10%
18 Stability to date?
19 70% show no change or drop further 85% remain within 10% of initial result Data Set: Long term is up to 738 days Average is 199 days The remainder (bar one) were pilot tests
20 Field Performance How fast does it work? How long does it last? Is biodegradation occurring? 2015 All Rights Reserved. REGENESIS and REGENESIS product(s) are registered trademarks of REGENESIS Remediation Products.

21 Midwest Chlorinated VOC Site Former electronics facility Contaminants: TCA, TCE, etc. TCE 1,390 µg/l TCA 3,550 µg/l Treatment Area: Plume area only, no NAPL PlumeStop: 10-pt low pressure injection grid around MW-6 HRC electron donor applied upgradient Site Characteristics: Sandy to silty sand; v = 12 ft/yr DTW = ft bgs 2015 All Rights Reserved. REGENESIS and REGENESIS product(s) are registered trademarks of REGENESIS Remediation Products.
22 10 x reduction 100 x reduction 1000 x reduction proliferation of VOC degrading microflora dissolved phase VOC at/close to ND now >2 years non detect projected sorptive saturation from influx 1 year and counting 18 months and counting
23 Constituent RISC Residential Closure Criteria 1 Industrial Closure Criteria 1 y (µg ) MW-6 y (µg ) MW-6 Sep-13 Dec-13 Mar-14 Jun-14 Sep-14 Dec-14 Mar-15 Jun-15 Sep-15 Dec-15 Mar-16 1,1-Dichloroethane , ND (5) ND (5) ND (5) ND (5) ND (5) ND (5) ND (5) ND (5) ND (5) ND (5) 1,2-Dichloroethane 5 31 ND (5) ND (5) ND (5) ND (5) ND (5) ND (5) ND (5) ND (5) ND (5) ND (5) ND (5) 1,1-Dichloroethene 7 5, ND (5) ND (5) ND (5) ND (5) ND (5) ND (5) ND (5) ND (5) ND (5) ND (5) cis-1,2-dichloroethene 70 1, ND (5) ND (5) ND (5) ND (5) ND (5) ND (5) ND (5) ND (5) ND (5) ND (5) trans-1,2-dichloroethene 100 2,000 ND (5) ND (5) ND (5) ND (5) ND (5) ND (5) ND (5) ND (5) ND (5) ND (5) ND (5) Methylene chloride ND (5) ND (5) ND (5) ND (5) ND (5) ND (5) ND (5) ND (5) ND (5) ND (5) ND (5) Tetrachloroethene 5 55 ND (5) ND (5) ND (5) ND (5) ND (5) ND (5) ND (5) ND (5) ND (5) ND (5) ND (5) 1,1,1-Trichloroethane ,000 3, ND (5) ND (5) ND (5) ND (5) ND (5) ND (5) ND (5) ND (5) ND (5) 1,1,2-Trichloroethane 5 50 ND (5) ND (5) ND (5) ND (5) ND (5) ND (5) ND (5) ND (5) ND (5) ND (5) ND (5) Trichloroethene ,420 ND (5) ND (5) ND (5) ND (5) ND (5) ND (5) ND (5) ND (5) ND (5) ND (5) 1,2,3-Trichlorobenzene NL NL ND (5) ND (5) ND (5) ND (5) ND (5) ND (5) ND (5) ND (5) ND (5) ND (5) ND (5) Trichlorofluoromethane 1,700 31,000 ND (5) ND (5) ND (5) ND (5) ND (5) ND (5) ND (5) ND (5) ND (5) ND (5) ND (5) Vinyl chloride 2 4 ND (2) ND (2) ND (2) ND (2) ND (2) ND (2) ND (2) ND (2) ND (2) ND (2) ND (2)
24 Field Performance How fast does it work? 92% Reduction in 2 weeks, ND 6 months How long does it last? >2 years and counting Is biodegradation occurring? Yes. Sorption saturation should have occurred at 8.3 months due to upgradient contaminant mass flux 2015 All Rights Reserved. REGENESIS and REGENESIS product(s) are registered trademarks of REGENESIS Remediation Products.


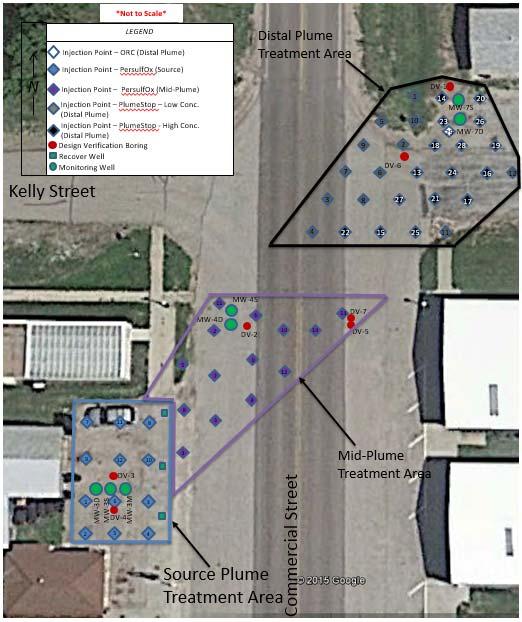
25 CASE STUDY: PETROLEUM RELEASE SITE, NEBRASKA UST Site: TPH/BTEX Remedial Strategy: PersulfOx source/mid plume PlumeStop/ORC distal plume/barrier Concerns for Remedial Injections: Identify permeable zones/target injection intervals Confirm injection rates Confirm contaminant mass

26
27 CASE STUDY: POST APPLICATION RESULTS
28 CASE STUDY: POST APPLICATION RESULTS

29 Field Performance Chlorinated solvents Post sorption degradation Lines of evidence 2015 All Rights Reserved. REGENESIS and REGENESIS product(s) are registered trademarks of REGENESIS Remediation Products.
30 California Site Dune Sand formation 33 ft/year groundwater flow High redox conditions (aerobic) No attenuation evident PCE 550 µg/l No daughter products PlumeStop Electron donor and bacteria (DHC) 2015 All Rights Reserved. REGENESIS and REGENESIS product(s) are registered trademarks of REGENESIS Remediation Products.
31 Historic Data Steadily increasing PCE No daughter products (aerobic conditions) 2015 All Rights Reserved. REGENESIS and REGENESIS product(s) are registered trademarks of REGENESIS Remediation Products.
32 Application PCE immediately to ND (<5µg/L) Micro parameters increase post-app then decrease after ~two months 225 % 3,000 x (init. ND) 676 % 541 % (no methanogenesis) 2015 All Rights Reserved. REGENESIS and REGENESIS product(s) are registered trademarks of REGENESIS Remediation Products.
33 Application < MQL (5 µg/l; 0.5µg/L) through 7 consecutive sampling rounds 451 days (15 months) and counting (case studies)
34 Data Summary >99% (two OOM) PCE concentration reduction within 14 days 550 µg/l to non detect (<5 µg/l) Optimal dehalorespiration conditions established Redox from +254 mv to 150 mv (±30 mv) sweet spot Competing electron acceptors depleted Post inoculation microbial trends Increase then decrease in dechlorination species and enzymes Consistent with solvent metabolism and depletion


35 Thank You! Questions? Carlos A. Ortiz South Central District Technical Manager