Energy and the Built Environment
|
|
|
- Shanna Carr
- 5 years ago
- Views:
Transcription
1 photo: shelfcloud by michael a. Energy and the Built Environment UKC 2011 Park City, Utah Jae D. Chang, Ph.D. Associate Professor The University of Kansas, U.S.A. School of Architecture, Design & Planning

2 Energy Use Worldwide photo: earth at night by NASA
")
3 Source: U.S. Census Bureau, Statistical Abstract of the United States: 2011, 130 th Edition (International Statistics pg 865)
4 Source: U.S. Census Bureau, Statistical Abstract of the United States: 2011, 130 th Edition (International Statistics pg 868)

5 Total Energy Consumption and CO 2 Emissions 2010 top 10 countries Country Unit (Mtoe) Population Population World Ranking China 2,493 1,330,141,295 1 United States 2, ,232,863 3 India 692 1,173,108,018 2 Russia ,390,205 9 Japan ,804, Germany ,644, Brazil ,103,330 5 France ,768, Canada ,759, South Korea ,636, Country Unit (MtCO 2 ) China 7,366 United States 5,380 India 1,626 Russia 1,585 Japan 1,058 Germany 754 South Korea 545 Canada 522 United Kingdom 491 Saudi Arabia 452 Sources: Enerdata, Global Energy Statistical Yearbook 2011 and U.S. Census Bureau, International Data Base (February 23, 2011)

6 Source: U.S. Energy Information Administration, International Energy Outlook 2010 (July 27, 2010)
 Energy Consumption in")
7 Source: U.S. Department of Energy, 2008 Renewable Energy Data Book (July 2009) Energy Consumption in the USA


8 Source: U.S. Department of Energy, 2008 Renewable Energy Data Book (July 2009)


9 Energy Consumption in South Korea

10 Health & Environment photo: can t live with pollution III by louise z.

11


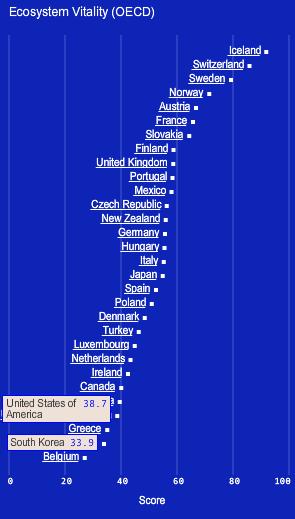
12

13 EPI rank: 94 Average EPI score for income peer group: 66.1 EPI score: 57 Average EPI score for Asia and Pacific: 57.4

14

15

16

17

18

19 Impact of Buildings photo: ny sunset by
20 Importance of Energy Efficiency 65-90% of energy cost in commercial building is electricity of that approx 40% is lighting 50-90% of a commercial building s total energy costs are HVAC/mechanical systems Buildings are the single largest contributor to global warming. Air, water, soil pollution from power plants generating power for buildings and materials. (nuclear, coal, gas, to some extent even hydro) Important to reduce energy consumption in building construction, operation, and fitout. Reduce environmental pollution and consumption of nonrenewable energy sources. More renewable energy sources such as solar, wind, wave The average green building saves 30-50% on energy use and costs.
21 31% 29% 22% 18% Residential + Commercial = Building Energy Use in the USA 22% + 18% = 40% Source: U.S. Energy Information Administration, Monthly Energy Review (April 2010)


22 Source: Korea Energy Economics Institute, Energy Info. Korea 2010
23 Russia 6.2% of world (everything) Middle East 5.2% of world (everything) South Korea 2% of world (everything) USA 8.3% of world (buildings only) Africa 2.7% of world (everything) Central & S. America 5.2% of world (everything) Source: U.S. Energy Information Administration, Building Energy Data Book (April 2010) based on 2008 data
 Electrical losses associated with the")

24 Energy Use in Buildings: by Major Source Commercial (1) Electrical losses associated with the generation, transmission, and distribution of energy in the form of electricity Sources: architecture2030 and DOE


25 Site Energy Consumption by End Use RESIDENTIAL COMMERCIAL Source: U.S. Department of Energy, Energy Efficiency & Renewable Energy, 2010 Buildings Energy Data Book (March 2011)
26 Source: U.S. Energy Information Administration, Annual Energy Outlook 2011 (April 26, 2011)


27

28 Worldwide, Buildings Impact More Than Just Energy Buildings account for 17% fresh water withdrawals 25% wood harvest 33% CO 2 emissions 38% in USA 40% material and energy use 45% in China* * world s 2 nd largest economy, world s largest exporter Sources: USGBC and United Nations Environment Program

29 Renewable Energy photo: silence by adrian babalic

30
31 Climate Classification 1976 to 2000 Designing with Climate

32 Climate Classification 2051 to 2075 Designing with Climate

33

34

35
36
 Renewable Energy Cost Trends cost of energy in constant 2005")
37 Source: National Renewable Energy Laboratory, Cost Curves (November 2005) Renewable Energy Cost Trends cost of energy in constant 2005 USD

38 Sustainable Built Environment


39

40
41 Government Policies United States Energy Independence and Security Act 2007, High Performance Commercial Buildings Korea Reduce energy intensity by 3% per year, or 30% by 2015 (compared to 2003) Net zero energy use in all new commercial buildings constructed by 2025 Net zero energy use in 50% of commercial building stock by 2040 Net zero energy use in the entire commercial building stock by 2050 Generate 5% of energy from renewables by 2011, increasing to 11% by % in % reduction in carbon emissions by 2020 Songdo IBD, LEED ND pilot project and KGBCS National Institute of Environmental Research (NIER) New headquarters building claimed to be net zero carbon (net zero energy) office building 40% reduction in energy consumption Ministry of Knowledge Economy Sources: DOE and MKE
42 Green Building Rating Systems / Certification Programs Several systems/programs available and used worldwide. Some examples: Green Building Initiative s Green Globes International Initiative for a Sustainable Built Environment (iisbe) Sustainable Building Information System (SBIS) U.S. Green Building Council s (USGBC) LEED system The Leadership in Energy and Environmental Design (LEED) Green Building Rating System encourages and accelerate global adoption of sustainable green building and development practices through the creation and implementation of universally understood and accepted tools and performance criteria. (USGBC, 2008) ASHRAE s Building (Energy Quotient) EQ Just deals with energy. EPA ENERGY STAR Living Building Challenge Passive House Korea Green Building Council s (KGBC) GBCS Green Building Certification System Membership in World GBC is currently prospective


43 USGBC LEED 9 different rating systems Level of green based on point system certified points silver points gold points platinum points

44
45 KGBC Green Building Certification System (GBCS) 5 different rating systems multi-unit residential building 120 points mixed-use dwellings (residential part): 128 points mixed-use dwellings (non-residential part) 115 points office building 136 points school 124 points Level of green based on point system excellent points best 85 or more points

46

47
48 Source: U.S. Census Bureau, Statistical Abstract of the United States: 2011, 130 th Edition (International Statistics pg 868)

49 photo: tools by sonja witter Practicing What s Taught


![[LEED Platinum]](/docs-images/94/119193202/images/50-2.jpg "2007: Modular 4")


50 Studio 804 since : Prescott Passive House [LEED Platinum] 2007: Modular : Atherton Court 2009: 3716 Springfield [LEED Platinum] 2006: Modular : Marvin Yard Canopy 2008: Sustainable Prototype Arts Center [LEED Platinum] 2005: Modular : Barber School House

51 5.4.7 Arts Center Greensburg, Kansas


52


53


54 Prescott Passive House Kansas City, Kansas


55

56

57 KU Center for Design Research Lawrence, Kansas
58

59
60

61

62 Jae D. Chang, Ph.D. Associate Professor The University of Kansas School of Architecture, Design & Planning 1465 Jayhawk Blvd. Lawrence, Kansas U.S.A. +1 (785)