Modelling the Hydrologic Effects of. in the San Jose Watershed
|
|
|
- Anthony Shields
- 5 years ago
- Views:
Transcription
1 Modelling the Hydrologic Effects of Climate Change and Forest Management in the San Jose Watershed R.D. (Dan) Moore PhD PGeo Georg Jost PhD Departments of Geography and Forest Resources Management The University of British Columbia
2 What is a hydrologic model? (1) A computer code incorporating equations describing water storage and transfer Input data weather data (air temperature, precipitation, ) topography, soils, vegetation, Outputs Streamflow, soil moisture, snow accumulation and melt,


3 What is a hydrologic model? (2) A scenario building tool
4 DHSVM, VIC, HBV EC, WaSIM ETH, MIKE SHE, WATFLOOD, CRHM, Why are there so many models? Different purposes Different availability of input data Different opinions among modellers as to what is important to include
5 Comparison of model characteristics Process s repres sentatio on De tailed Simp ple BROOK-90 VIC UBCWM HBV-EC DHSVM MIKE-SHE RHESSYS CRHM Simple Detailed Spatial representation
6 YAM What models are we using? (1) accommodates changes in vegetation cover through time can incorporate new process representations designed to work with existing data sets in BC (e.g. FPI, VRI) performed better than DHSVM at Cotton Creek Experimental Watershed (East Kootenays)
7 What models are we using? (2) BROOK90 physically based stand level model
8 Challenges in modelling the San Jose watershed (1) complex hydrology wetlands evaporation is a significant ifi fraction of precipitation
9
10 Mean daily flow SAN JOSE RIVER ABOVE BORLAND CREEK 15 inter annual storage A (partial day) B (ice affected) E (estimated) 0 Di scharge [m 3 s 1 ] Date
11 Challenges in modelling the San Jose watershed (2) data limitations limited number of climate stations, snow data water licenses: measured streamflow less than actual streamflow by an unknown amount
12
13 Model calibration we have imperfect knowledge of many catchment characteristics and hydrologic functions soil depth and water storage capacity fraction of precipitation that is intercepted usual solution is to adjust these in the model to make it fit the observed outputs (streamflow, snowpack) needed to develop a new approach for San Jose watershed
14 current forest cover Scenarios run to date mature forest cover over entire catchment open condition over entire catchment

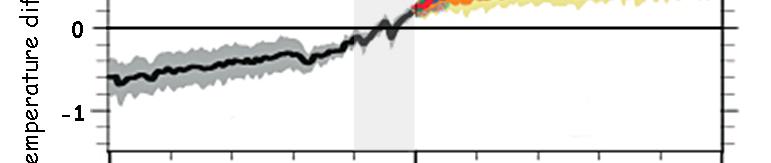
15 Current forest cover high emissions scenario 2020s 2050s 2080s

16 Open cover high emissions scenario 2020s 2050s 2080s
17 Changes to annual hydrograph, current forest cover
18 Changes to annual hydrograph, 100% forest cover

19 Changes to annual hydrograph, current forest cover

20 Changes to annual hydrograph, 100% open cover
21 Take home messages possible decrease in annual flow (but not full consensus among models) changes to timing of runoff higher flows in winter and early spring lower peaks in spring lower flows through summer/autumn potential for partial mitigation through potential for partial mitigation through forest management
22 Work to do run models incorporating results of future forest management scenarios write up results and report back
23