Mark Summerton Planning Analyst Umgeni Water Stellenbosch, 02 March 2009
|
|
|
- Alannah Turner
- 5 years ago
- Views:
Transcription


1 The possible impacts of a changing climate on WATER RESOURCES Mark Summerton Planning Analyst Umgeni Water Stellenbosch, 02 March 2009
2 Layout of Presentation 1. Background to Umgeni Water 2. Modelling Process 3. Why the Mgeni Catchment? 4. Setup of Hydrological Model 5. A note on Climate Models 6. Results impacts on water resources 7. Way forward
3 Background to Umgeni Water 1. Water Utility treat and distribute bulk potable water Ml/day 3. Durban (81%, Population 3.3M) 4. Pietermaritzburg (10%, Population 0.57M) WW and WWW 6. Transfer Infrastructure storage dams


4 Mearns Weir 5.1 million m 3 Albert Falls Dam million m 3 Midmar Dam Capacity million m 3 HFY 60.8 million m 3 /a Nagle Dam 24.6 million m 3 HFY million m3/a Inanda Dam million m 3 HFY million m3/a


5 MGENI SYSTEM: WATER RESOURCE REQUIREMENTS 99% LEVEL OF ASSURANCE Projected usage March 2007 Current Yield DEFICIT Actual usage
6 MGENI SYSTEM: WATER RESOURCE REQUIREMENTS 99% LEVEL OF ASSURANCE Projected usage March 2007 DEFICIT Current Yield DEFICIT Spring Grove Dam commissioned Actual usage
7 MGENI SYSTEM: WATER RESOURCE REQUIREMENTS 99% LEVEL OF ASSURANCE Projected usage March 2007 DEFICIT Mkomazi Water Project commissioned? Current Yield DEFICIT Spring Grove Dam commissioned Actual usage


8 Costs Technology developments Biophysical factors Legislation changes New policies Social factors SUPPLY DEMAND Economic variability Other developments The Water Planner must continually reconcile WATER SUPPLY and DEMAND Land-use changes Changing standards Institutional factors Political changes Public pressures Changing water demands Climate Change Cultural factors


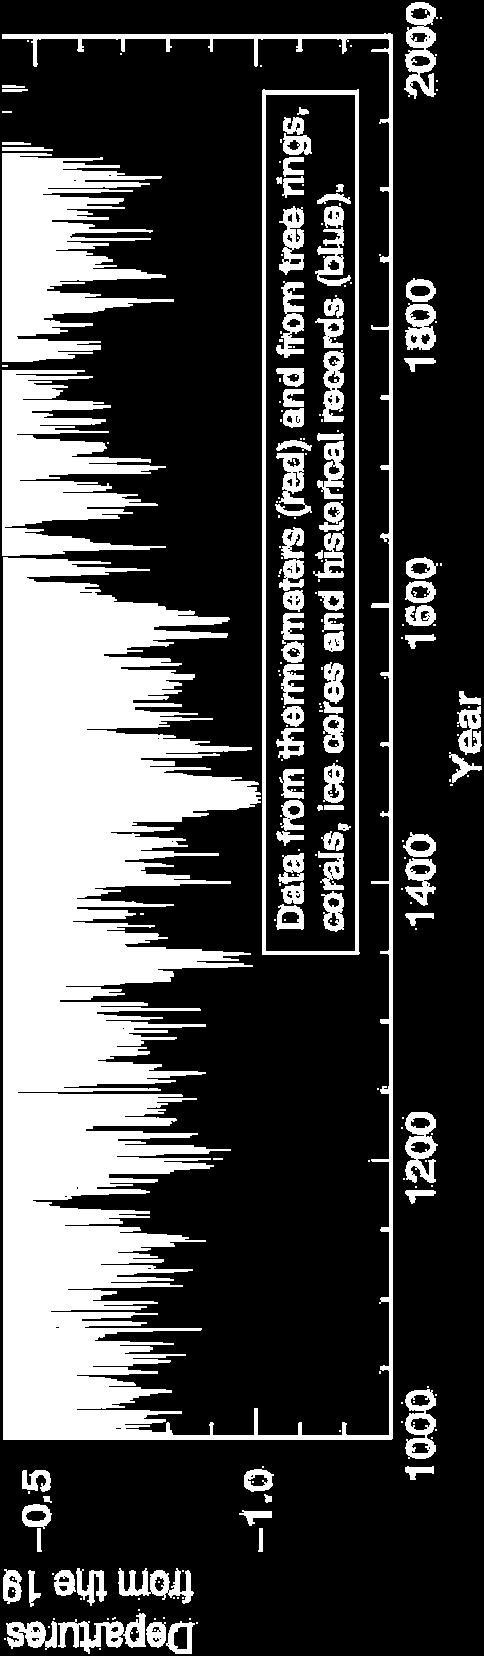
9 The Climate is Changing
 PRECIPITATION &")


10 Modelling Process WATER DEMANDS Water Allocation Models ASSURING WATER SUPPLY Climate Models (GCM s) PRECIPITATION & TEMPERATURE Hydrological Model RUNOFF Open Channel Models RIVER LEVELS LANDUSE & LANDCOVER Water Water Resource Resource Development Development Plans Plans System System Operating Operating Rules Rules Disaster Disaster Risk Risk Management Management Plans Plans
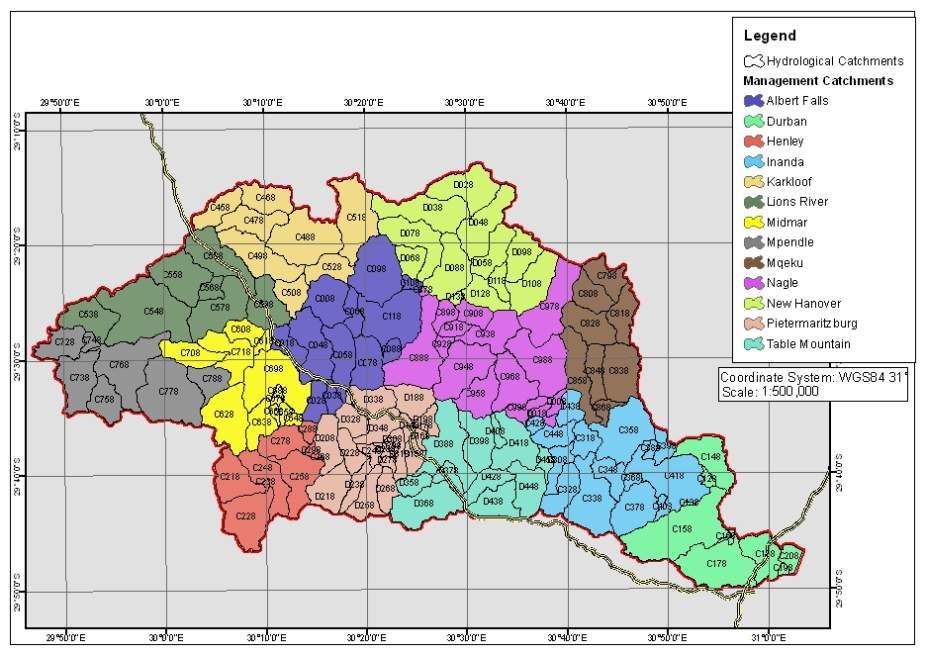
11 Why the Mgeni catchment? % of SA, 15% of SA pop, 20% GDP, % per annum increase in water demand, 3. High assurance levels (99%), % risk of failure (August 2010), 5% (2011), 25% (2016), 5. Strategic water supply catchment, 6. Stressed, and 7. Umgeni Water Corporate Risk.
12 Setup of Hydrological Model 1. ACRU, 2. Amalgamation of Agro-Hydrological Modelling Groups (AAMG), 3. Landuse 1: 5000, polygons, 20 classes, management units, 145 sub catchments, 1450 modeling catchments, 5. Daily rainfall from Lynch (2003), 6. Irrigation and Dams from DWAF, 7. A-pan reference evaporation, 8. Abstraction and return flows from Umgeni Water, 9. Soils, 10. R 2 between 0.75 and 0.90, and 11. average errors in flows and 0.13 mm/d.
13
14 A note on climate models Complex science due to: Large scale variations (GCM /RCM) Parameterization of different variables Different starting conditions Method of downscaling Emission scenarios NB: Deal with uncertainty Make robust decisions
15 Climate Models 1. Geophysical Fluid Dynamics Laboratory (GFDL) a) a2 emission scenario b) Statistically downscaled (CSAG UCT) 2. European Centre Hamburg Model (ECHAM5) a) a1b emission scenario b) Dynamically downscaled (RCAM SMHI) 3. In the near future: Community Climate System Model CCSM3 a1b and b2 and others

16 Intermediate to current streamflows (GFDL)
17 Intermediate to current mean streamflows (GFDL) Ratio Midmar Albert Falls Nagle Inanda Jan Feb Mar Apr May Jun Jul Aug Sep Oct Nov Dec
18 Intermediate to current mean CVs (GFDL)
19 Impact of Climate Change: What if GFDL scenario is accurate? SURPLUS DEFICIT DEFICIT Risk: Incur unnecessary expense to secure water that is not needed
20 Intermediate to current streamflows (ECHAM5)
21 Intermediate to current mean streamflows (ECHAM5) 2 Ratio 1 Midmar Albert Falls Nagle Inanda 0 Jan Feb Mar Apr May Jun Jul Aug Sep Oct Nov Dec

22 Intermediate to current mean CVs (Echam5)
23 Impact of Climate Change: What if ECHAM scenario is accurate? DEFICIT DEFICIT Risk: Alternate water supply not in place drought, restrictions
24 Where does this leave us? 1. Framework for impact assessment of climate change on WRM 2. Timeous decisions regarding future risk and assurance of supply 3. State of the art hydrology 4. Climate impact studies inconclusive (GCMs don t agree yet) 5. WRM adaptation based on climate change impacts per se not possible (yet!)
25 The way forward 1. Configure other key catchments 2. Improve prediction capabilities 3. Scenario analysis 4. Determine occurrence of droughts and floods 5. Include CC in assurance of supply planning 6. Include CC in DRM activities e.g dam safety 7. Develop and implement sustainable adaptation measures 8. Active consultation with all stakeholders and spheres of government
26 Lessons learned 1. GCM s are not all that they need to be 2. CC impact assessments demand daily physical modelling 3. Additional resources and management are required 4. The future is not what it used to be


27 Acknowledgements School of Bioresources Engineering and Environmental Hydrology Swedish Meteorological and Hydrological Institute