Vancouver Watershed Health Assessment. Burnt Bridge Creek Watershed
|
|
|
- Frank Wheeler
- 5 years ago
- Views:
Transcription


1 Vancouver Watershed Health Assessment Burnt Bridge Creek Watershed
2 Presentation Overview 1. Introduction 2. Study Context 3. Burnt Bridge Creek Monitoring Program and Trend Analysis 4. Watershed Health Assessment GIS based Statistical Analysis 5. Why bother?
3 What is Watershed Health? Ecological attributes (US EPA) Landscape condition Habitat condition Hydrology Geomorphology Water Quality Biological Condition
4 Existing Programs Water quality monitoring Public Education and Outreach Water Resource Education Center Urban Forestry Program And more Illicit discharge detection and elimination programs Sewer Connection Incentive Program Maintenance programs Restoration and Stormwater Retrofit BBC Gateway Improvement Project City s Greenway and Sensitive Lands Program Stormwater Retrofit Studies

5 Study Area
6 Study Context Question: Is there a relationship between watershed attributes and surface water quality? Purpose: prioritize watershed management programs and activities


7 Existing Watershed Health Insert Cover Image Burnt Bridge Creek
8 Burnt Bridge Creek Unique Aspects Historically, upper reaches flowed through marshland Most soils are well drained (good infiltration) Groundwater and surface water interactions from shallow aquifer system continue today Naturally occurring phosphorus in groundwater that contributes to creek concentrations
9 Burnt Bridge Creek Monitoring Objectives Comply with water quality standards Robust data set for further analyses such as watershed health assessment
10 Burnt Bridge Creek Flows west to Vancouver Lake

11 Burnt Bridge Creek Monitoring Stations
12 Burnt Bridge Creek Parameters 6 sampling events annually from June to October In situ Measurements Temperature Dissolved oxygen ph Specific conductivity Continuous Temperature Monitoring Laboratory Analysis Turbidity TSS Total phosphorus Orthophosphate Total Nitrogen Nitrate + Nitrite nitrogen Fecal Coliform
13 Burnt Bridge Creek Trend Analysis Statistics Temporal trends Significant changes between historic ( ) and recent ( ) data Spatial differences between stations Comparison to water quality criteria Water Quality Index

14 Existing Watershed Health Temporal Trends: Kendall s Tau Correlation Analyses: alpha level of 0.05

15 Existing Watershed Health Significant Differences Percent change in median values Mann-Whitney U test (a = 0.05)
16 Existing Watershed Health Spatial Differences Spatial Patterns: Friedman Test with Pairwise Comparison g f tributary a c tributary fg b e de cd e tributary c EPA criterion 0.04 mg/l upstream downstream

17 Existing Watershed Health Spatial Analysis Spatial Patterns Median Total Phosphorus from samples per station
18 Existing Watershed Health Water Quality Index (WQI) Developed by Washington Department of Ecology WQI: unitless number, higher # indicates better water quality Scores for each parameter are combined and aggregated over time to produce annual score for each station Good score only indicates poor WQ wasn t a chronic problem for included parameters Parameters included in WQI: Temperature ph Fecal Coliform DO TSS Total phosphorus Total nitrogen Turbidity
19 Existing Watershed Health Median Water Quality Index Ecology Water Quality Index Median Annual WQI Score for WQI Low Concern = Moderate Concern = High Concern = 1 39

20 Watershed Management Effectiveness GIS Statistical Analysis
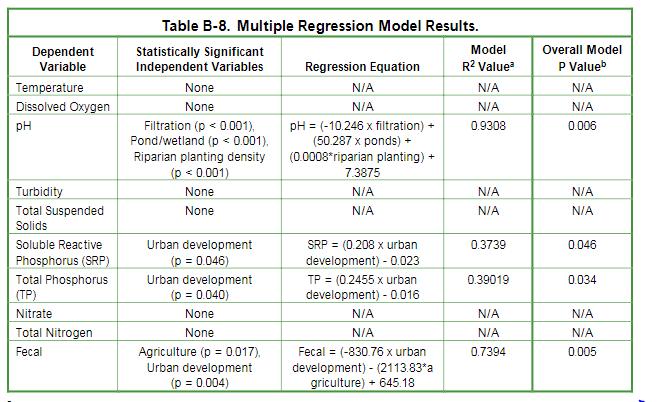
21 Watershed Management Effectiveness: GIS Statistical Analysis Goals: 1. Try to determine what watershed characteristics may be driving water quality trends in the Burnt Bridge Creek watershed. 2. Assess the effectiveness of watershed management efforts at improving water quality. Important Note: Correlation is not causation!


22 Watershed Management Effectiveness Overall Process Summarize GIS data by monitoring station Modify Input Calculations Check for correlations between datasets Analyze the results and do a reality check Select a subset of datasets and run regression
23 Watershed Characteristics Considered Watershed Characteristic Parcel-based, designated land use in seven categories Land cover in six categories Wellhead protection areas Average channel slope Septic system density Sewer system age Riparian canopy cover in the riparian buffer (100 feet wide) within the ½ mile upstream of a monitoring station Metric Percent cover Percent cover Percent cover Feet per mile Number per acre Percent cover Percent cover
24 Watershed Management and Restoration Efforts Considered Watershed Management or Restoration Efforts Stormwater facility density in six categories: Dry well Detention Sedimentation Filtration Infiltration Pond/wetland Riparian planting density Riparian planting areas Metric Number per acre Number of plantings (herbaceous, lie stakes, shrubs, transplanted, and trees) per acre Percent cover
25 Quick Terminology Overview A positive association means that as the percentage of a watershed characteristic increases, the value of the water quality parameter also increases A negative association means that as the percentage of a watershed characteristic increases, the value of the water quality parameter decreases (or vice versa) An alpha value of 0.05 means that there is a 5% probability that the association we re seeing is a result of random chance

26
27
28 Hypothesis #1: Septic systems impair surface water quality Results: Positive association between septic system density and fecal coliform, total nitrogen, and nitrate Concentrations of these parameters are high in septic system effluent, suggesting water quality may be degraded by septic system density Recommendations: Continue to invest in and expand the Sewer Connection Incentive Program (SCIP) Work with Clark County to implement and enforce septic system inspection and maintenance regulations Consider quantitative microbial source tracking to further investigate fecal coliform contamination in areas of concern from multiple sources
29 Hypothesis #2: Riparian buffers improve surface water quality Results: Tree canopy cover, riparian plantings were associated with improvement of dissolved oxygen and impairment of temperature and turbidity Expectation: Decreased temperature from canopy shading would improve DO; however, temperature was shown to increase. This is a contradiction. The analyses did not demonstrate a relationship between riparian canopy and planting density on water quality. Recommendations: Evaluate potential effects of riparian cover and plantings on temperature using alternative metrics (% stream cover, plant height) and continuous temperature data (daily max and mean) corrected for air temperature
30 Hypothesis #3: Tree cover improves surface water quality Results: Tree canopy cover was positively correlated with fecal coliform (counterintuitive) and not significantly associated with any other water quality parameters Residential land use was positively correlated with fecal coliform bacteria Indicates fecal coliform bacteria concentrations may be driven by residential land use, not tree canopy cover Recommendations: Continue efforts to increase tree canopy citywide per their Urban Forestry program Collect GIS data to compare historic trends in canopy cover with water quality
31 Hypothesis #4: Urban development impairs surface water quality Results: Urban development was positively correlated with total and soluble reactive phosphorus concentrations in Burnt Bridge Creek Recommendations: City should continue to implement phosphorus source control practices (street sweeping, fertilizer education, etc.) and stormwater treatment targeting phosphorus removal within Burnt Bridge Creek.
32 Hypothesis #5: Stormwater management facilities improve surface water quality Results: Detention, filtration, and infiltration facilities associated with improving stream temperature, impaired dissolved oxygen Dry wells and sedimentation facilities associated with improved total and soluble phosphorus concentrations Dry wells correlated negatively with commercial/industrial areas of the watershed. Improving phosphorus concentrations less in commercial/industrial areas other than other areas Recommendations: Continue implementing stormwater BMPs to improve temp and phosphorus with an emphasis in commercial/industrial areas Collect more stormwater quality data to allow future analysis of stormwater management on water quality during storm flow conditions Include catchment area and other facility characteristics, combine facilities into functional groups
33 Watershed Management Effectiveness So why do this analysis? Quantify and compare benefits of stormwater management and stream/wetland restoration activities Target watershed activities, areas, and land covers most likely to generate specific pollutants as TMDL plans are developed Identify and develop environmental policies and programs that are most effective in protecting and improving surface water and groundwater quality Develop strategies for long-term water quality monitoring and GIS data collection to produce datasets that can be used to analyze effects of watershed activities on water quality Characterize whether water quality trends are due to humancaused changes in land use and watershed management strategies Predict current water quality conditions in other unmonitored river systems
34 Acknowledgements & Contact Info Acknowledgements City of Vancouver Pacific Groundwater Group Herrera colleagues Contact Information Jess Brown: Jenn Schmidt: