Full Scale Up-Flo Filter Field Verification Tests
|
|
|
- Christine Walker
- 5 years ago
- Views:
Transcription
1 Full Scale Up-Flo Filter Field Verification Tests Yezhao Cai, Robert E. Pitt, Noboru Togawa, Kevin McGee, Kwabena Osei and Robert Andoh Abstract Full scale field tests of the Up-Flo filter have been conducted at the Bama Belle Riverwalk parking lot test site in Tuscaloosa, Alabama for the past several years. Forty storm events have been monitored and sampled, and these field performance results indicate that the Up-Flo filter has excellent removals for particulates during a wide-range of hydraulic rainfall conditions. Total suspended solids removal was about 82% for influent concentrations ranging from 11 mg/l to 571 mg/l; suspended solids concentration flow-weighted removal was about 90%; flow-weighted turbidity removal about 61%. Particle size distribution analysis determined that the influent median particle size of the 40 sampled storms was about 460µm and about 45 µm for the effluent. Nutrient reductions were about 37% and 17% for total nitrogen and total phosphorus, respectively. Metal reductions ranging from about 54% to 76% for total copper, 67% to 98% for total lead, and 79% to 83% for total zinc. Bacteria reductions were 53% for E. coli. and 57% for Enterococci. Additional event data are being collected and will be further analyzed to examine performance behavior as a function of a wide range of rainfall and runoff conditions. Keywords: field investigations, TSS, water quality, monitoring. 1 Summary The Up-Flo filter was developed by University of Alabama researchers during USEPA-supported Small Business Innovation Research (SBIR) and is commercialized by Hydro International. For typical stormwater conditions, the Up-Flo filter has been found to remove 80% of the suspended solids concentrations (SSC) during field tests, with variable amounts of treatment for other stormwater pollutants including metals, nutrients and bacteria. The main advantages of the Up-Flo filter include its high treatment flow rate in a small area, significantly decreased clogging problems compared to downflow filtration, and reduced maintenance requirements. Full scale field tests have been conducted at the Bama Belle Riverwalk parking lot test site in Tuscaloosa, Alabama for the past several years. Forty storm events have been monitored and sampled, and these field performance results indicate that the Up-Flo filter provides excellent removal of particulates during a wide range of hydraulic and rainfall conditions. During these monitored events, the flow weighted average total suspended solids (TSS) removal was about 82% for influent concentrations ranging from 11 mg/l to 571 mg/l (average 101 mg/l), while the suspended solids concentration (SSC) flow weighted removal was approximately 90%. The flow weighted turbidity removal was ~61%. The particle size distribution (PSD) analysis determined that the influent median particle size (D50) of the 40 sampled storms was ~460 µm and ~45 µm for the effluent. Nutrient reductions were less, ~37% and ~17% for total nitrogen and total phosphorus respectively. Bacteria reductions were ~53% for E. coli and ~57% for Enterococci. Metal reductions were very good, with flow-weighted removals ranging from ~54% to 76% for total copper, 67% to 98% for total lead, and 79% to 83% for total zinc. Removal ranges are due to some of the effluent concentrations being below the detection limits, and the two values were calculated substituting 0 and the detection limit for these conditions. Additional event data was collected (through March 2013) and will be further analyzed to examine performance behavior as a function of a wide range of rainfall and runoff conditions. 2 Introduction As urbanization occurs in developing areas, the amount of impervious surface increases. These impervious surfaces, such as asphalt roads and concrete pavements, cause stormwater runoff to flow through the landscape and drainage systems rapidly, instead of being absorbed by soil and plants. This results in increased flooding and erosion of the hydraulic infrastructure. Along with the runoff, pollutants from source areas, including solids, nutrients, metals, bacteria and hazardous organic compounds, enter the receiving streams and rivers. These substances can affect the water and sediment quality of the receiving water and destroy aquatic life habitats. Under these combined stresses, it is important to use advanced stormwater runoff treatment methods that are able to treat multiple pollutants with a relatively large treatment flowrate. For typical stormwater conditions, the Up-Flo filter has been found to remove at least 80% of total suspended solids during field tests, with variable amounts of treatment for other stormwater pollutants including metals, nutrients and bacteria Cai, Y., R.E. Pitt, N. Togawa, K. McGee, K. Osei and R. Andoh "Full Scale Up-Flo Filter Field Verification Tests." Journal of Water Management Modeling C365. doi: /JWMM.C365. CHI ISSN:


.")
2 screens below the filter module. The distribution metalla material distributes the flow evenly across the filter media bags, which usually contain a mixture of activated carbon, manganese-coated zeolite and peat. Runoff treatment during high flow rates is accomplished by controlled fluidization of filter media in the media bags so that fine particulates are captured throughout the depth of the media bags. During peak rainfall periods, the flow may exceed the treatment capacity, with the excess bypass flow being discharged to the outlet directly from the siphon activated bypass. A draindown is also employed in the Up-Flo filter to lower the water level below the filter media to minimize the development of anaerobic conditions in the filter media between storm events. (Togawa 2011). The main advantages of the Up-Flo filter are that it is small and can be retrofitted in small areas, it significantly decreases clogging problems compared to conventional downflow treatment devices, and it has a high treatment flow rate capacity with reduced maintenance costs. 3 Overview of the Up-Flo Filter The Up-Flo filter can be retrofitted and installed into commonly sized 4 ft (1.22 m) diameter catchbasins, and can have up to seven filter modules. The number of filter modules used depends on the annual runoff volume from the source areas being treated. Each filter module has a design hydraulic loading rate of ~25 GPM (0.66 L/s). The maximum treatment flow rate (with no bypassing) for the six filter modules Up-Flo filter being tested during this research is expected to be ~150 GPM (3.94 L/s). This should result in >90% of the typical annual flow being treated (bypass <10%). This flow performance was confirmed during previous research at the 0.9 acre (0.36 ha) Bama Belle test site (Khambhammettu et al. 2006). 4 Test Location and Landscape Profile The full scale six-module Up-Flo filter being tested during this research is located at the Bama Belle parking deck beside the Black Warrior River in Tuscaloosa, Alabama. The total contributing drainage area is about 0.9 acres (0.36 ha), and includes asphalt paved parking, concrete sidewalks, asphalt roadways, a small building, and landscaped park areas. The filter receives and treats the runoff from these land use areas, and discharges the flow to the Black Warrior River through a 30 ft (9.14 m) pipe from the filter. Table 1 and Figure 3 show the land cover details and an aerial photograph of the test site, indicating runoff flow,respectively. Table 1 Land uses of Bama Belle test site. Land Use Figure 1 Landscaped park area Asphalt parking Asphalt entrance road Concrete sidewalks Small roof area Total drainage area Impervious area Pervious area Up-Flo filter components. Area (ft2) Area (acres) Filter Inlet Figure 2 Percentage of Land Uses (%) Monitoring Station Filter module components. Figures 1 and 2 are respectively a schematic and a cross section of the Up-Flo filter. During a rain event, as the stormwater runoff enters the filter chamber and the sump water stage rises, larger sediment directly settles in the sump, and the gross debris and floatables are separated by angled screens located beneath the filter modules. The flow keeps rising and passes through the Figure 3 2 Aerial view of Bama Belle test site (Google Earth).
3 5 Test Methodology The field performance verification tests of the Up-Flo filter consist of three main sections: hydrological monitoring, water quality monitoring and sump sediment monitoring. Based on a combination of the New Jersey Department of Environmental Protection protocol (NJCAT 2008) and the Protocol for Stormwater Best Management Practice Demonstrations (NJDEP 2003; 2009), an eligible storm event for this research should meet the criteria listed below: 1. Rain depth 0.1 in. (2.54 mm); 2. Dry period between individual storm events 6 h; 3. Use automatic samplers to collect samples, except for constituents that require manual grab samples; 4. Flow weighted composite samples covering 70% of the total storm flow, including as much of the first 20% of the storm as possible; 5. Rainfall monitoring interval should be 15 min; 6. Quality control (QC) should be performed on 10% of the analyzed samples; 7. At least 10 aliquots (6 aliquots) are needed for each flow-weighted composite sample for the event which the duration is >1 h (or <1 h). For hydrological monitoring, two ISCO 4250 area velocity flow sensors are used to continuously monitor the water stage in the influent filter chamber and the discharge flow rate in the effluent pipe. The rain depth and intensity are monitored continuously using an ISCO 674 tipping bucket rain gauge installed on the top of the monitoring station. This rain gauge s main function is to trigger the monitoring samplers, instead of accurately representing rainfall information, as there are several trees closer to the monitoring station than is desirable for the best rainfall monitoring. The selection of events to monitor is based on weather prediction information, such as that provided by The Weather Channel. During water quality monitoring, the runoff samples are simultaneously collected at both influent and effluent locations in small plastic trays, where the water is cascading directly onto the sampler intakes, so reducing problems associated with stratified flows. However, the automatic samplers are not able to effectively capture all of the large particles (sampler performance decreases for particles >250 µm), so full unit mass balances will be used to indicate possible sampler losses of the larger influent particles when the sampling season ends (Clark and Pitt 2008; Clark and Siu 2008; Clark et al. 2009). The performance data presented in this paper therefore does not include the additional performance associated with the capture of the larger material in the sump. The two ISCO 6712 automatic water samplers (with 15 L composite HDPE sample containers) are initiated when the rain gauge registers 2 tips, or 0.02 in. (0.51 mm) rain, within 30 min. Both samplers obtain flow-proportional subsamples simultaneously from the influent and effluent, based on pre-programmed sample pacing that is adjusted by reliable weather forecast services, as noted above. Table 2 shows the automatic sampler programming for different sized storm events. This programming design fulfills the protocol sampling requirements and obtains the needed sample volumes for the laboratory analyses. As shown, the programmed subsample volume for all three setups is always 250 ml, with the only sampler change being the amount of flow associated with each subsample. Also, the minimum number of subsamples expected is 11 and the subsample collection rate enables subsamples to be collected every several minutes at the shortest interval. The ISCO samplers require an interval of ~1.5 min to collect each subsample, considering the required time for the initial back flush of the sample line, sample collection, and the final back flushing of the sample line (Burton and Pitt 2001). The moderate sized rain program is routinely used, unless an unusually large, or small, rain is expected. Table 2 Automatic sampler programming for different sized rain events. Small Size Rain Event Moderate Size Rain Event Large Size Rain Event Precipitation (in.) Duration (h) > 15 Runoff Volume (gal) Average Rain Intensity (in./h) Average Runoff Rate (GPM) Programmed Subsample Volume (ml) Runoff Volume per Subsample (gal/l) 120/ / /7 571 Estimated Number of Subsamples Sample Volume per Event (L) Filling Percentage of 15 L Capacity (%) Subsample Collection Rate (min for each sub-sample) Additionally, continuous water quality monitoring is conducted using two YSI 6600 water quality sondes for turbidity, conductivity and temperature (the storage and use conditions are too harsh for reliable use of the DO, ph, and ORP sonde probes without excessive maintenance). As shown in Figure 4, both sondes are installed and secured before each monitored rain in the cleaned plastic trays at the inlet and outlet sampling locations. Each measurement is taken every 5 min, setting the data resolution as high as possible to detect frequent changes and trends in stormwater quality during the events. For continuous sediment accumulation monitoring in the sump, a liquid filled (degassed water), USGS load-cell scour sensor from Rickly Hydrological Company was placed on the bottom of the filter sump at the beginning of the monitoring period. This scour sensor continuously monitors the sump sediment accumulation rate (sediment depth and mass) over the whole monitoring period, and continuously detects any sump sediment scouring during storm events, especially during peak storm flows. Manual sediment depth measurements are also taken after each storm event to evaluate the use of this unique monitoring tool. 3

 13 112 10 548 47 830 830 10 811 0.82 Volumetric Runoff Coefficient (Rv) 0.73 0.70 1.00 0.20 0.28 0.38 Average Runoff Rate (GPM) 54 36 240 3 50 0.")
4 covers a wide range of storm conditions, with rain depths ranging from 0.09 in. (2.3 mm) to 2.24 in. (56.9 mm). About 88% of the total monitored flow was treated by the filter media, with ~12% of the flow bypassing the media through the siphon bypass weir. The average flow rate for all events was 54 GPM (3.41 L/s), while the largest recorded flow was GPM (64.5 L/s). Table 3 Summary of runoff characteristics of 40 monitored events. Average Median Max. Min. Std. Dev. COV Rain Depth (in.) Runoff Volume (gall) Volumetric Runoff Coefficient (Rv) Average Runoff Rate (GPM) Peak Runoff Rate (GPM) Percent treated flow (%) Figure 4 Pre-storm field setup and cleaning of influent and effluent. At the end of the current monitoring activities, sediment grab samples will be collected and analyzed as they were after the first series of tests. The sediments will be air dried, weighed, sieved and analyzed within multiple size ranges for heavy metals (cadmium, Cd, chrome, Cr, copper, Cu, lead, Pb and zinc, Zn), specific gravity, nutrients and sulfur compounds (chemical oxygen demand, COD, total phosphorus, TP, total nitrogen, TN, total sulfide, total sulfate and total sulfite), percent volatile solids, and particle size distributions (PSD). The filter media bags will also be dried and weighed to estimate the accumulation of solids within the media to complete the mass balance calculations. 6 Performance Discussion Previously, paired samples had been collected for 20 storm events during a 1 y period (Togawa 2011). This chapter combines these earlier field performance results with an additional 20 recently monitored storm events, totalling 40 monitored storm events at the Bama Belle test site. Table 3 describes the runoff characteristics of the 40 monitored storm events, showing that the field test Figure 5 Scatterplot of treated flow percentage associated with peak rainfall runoff conditions of the 40 monitored storms. The bypassing of peak flows in the Up-Flo filter is associated with peak rainfall intensities and associated peak runoff flow rates. Figure 5 is a scatterplot of the treated flow percentages associated with peak 5 min rain intensities and peak runoff flow rates. At least 90% of total flows are treated for those events which had peak flow rates of 150 GPM (9.46 L/s), or peak rain intensities 1.2 in./h (30.5 mm/h). These are approximately consistent with expected values, with only a few exceptions. It 4

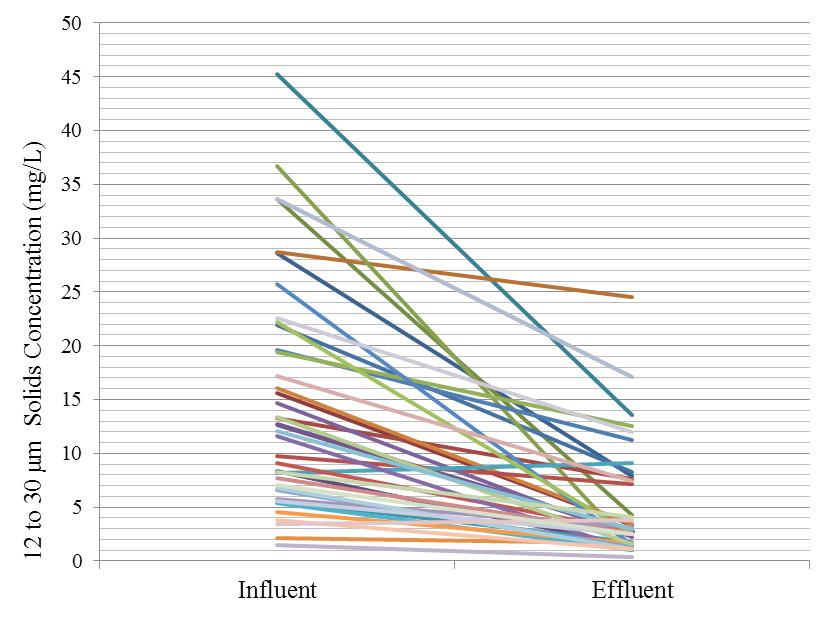
5 is interesting to note that 50% of the runoff flows were treated even when the peak flow rates were as high as GPM (63.1 L/s). Some relatively high treatment percentages also occurred with high peak rainfall conditions (again at least 50% of the flows were treated by the media even with peak rain intensities of up to 5 in./h, 127 mm/h). Figure 6 illustrates how storm characteristics affect the SSC removal performance of the Up-Flo filter. As shown, the influent SSC tends to increase with larger peak rain intensities, while the effluent SSC is relatively constant regardless of peak rain intensity. The peak rain intensity is only one of the factors affecting the influent water quality, which also depends on many other incidental conditions, including the magnitude of the wet weather discharges, the length of the antecedent dry period, the surface characteristics where the pollutant is located, and site specific conditions that cause pollutant accumulation and washoff (Pitt et al. 1995). Figure 6 SSC removal performance in different peak rain intensities. Figure 7 Line plots of performance of associated solids (clockwise from top left: TSS, SSC, TDS and turbidity) for 40 monitored storms. 5
6 Normal - 95% CI Percent Variable Influent SSC (Log(mg/L)) Effluent SSC (Log(mg/L)) Mean StDev N AD P SSC (Log(mg/L)) Figure 8 Scatterplot of SSC removal performance. Figure 9 Probability plot of SSC removal performance in 95% confidence interval (logarithmic transformation). Figure 7 displays line plots of solids performance for the 40 sampled storms, including TSS, SSC, TDS and turbidity. Particulate removal (especially for the smaller particle sizes) is the most important factor for the field performance evaluation of the Up-Flo filter, as most stormwater pollutants are closely associated with stormwater particulate material. These plots show large ranges of influent solids concentrations with much narrower ranges of effluent solids concentrations. Low TDS removals occur as these filterable solids are very small (<0.45 µm) and chemical treatment is usually needed for their control. Turbidity is usually associated with fine particulates and this constituent is shown to be significantly controlled (37 of 40 events had effluent turbidity <10 NTU). TSS analysis using Standard Method 2540 D (magnetic stir bar and pipetting) (Clesceri et al. 1999) was used during this research. Previous research of solids analysis methods for stormwater runoff found that the accuracy of solids determinations by pipetted aliquots are affected by the homogeneous distribution of particulates in the stirred subsample. This is dependent on how fast the magnetic stir bar rotates and the sampling location for each subsample, especially when large particles are present (Clark and Siu 2008). USEPA shake and pour TSS procedures (USEPA 1979) were found to be a much less reliable indicator of a wide range of particulate solids. SSC analyses, using standard test method D B (ASTM 2002, as used during this research), resulted in much smaller analytical variations and the best recoveries of a wide range of particle sizes in stormwater due to the use of a USGS/Dekaport cone splitter and minimal subsampling handling. Figures 8 and 9 (above) illustrate some of the statistical analyses of SSC removal performance for the 40 monitored storms, and include scatterplots, probability plots, and residual plots. Figure 8 is a scatterplot of influent vs effluent SSC concentrations. The equivalent concentration line illustrates that the effluent SSC concentrations are always less than the influent concentrations. Figure 9 shows probability plots of all of the influent and effluent SSC concentrations. The influent is normally distributed while the effluent concentrations are not, based on the Anderson Darling test statistics shown on the figure, indicating the need for nonparametric statistical analyses. The two probability plots are reasonably parallel (in log space) and are well separated, indicating likely significant and high rates of removals under a wide range of influent concentration conditions. Table 4 and Figures 10 and 11 summarize the particle size distributions (PSD) for influent and effluent samples from the 40 monitored storms. Table 4 shows that the Up-Flo filter removed ~86% of the total particulate mass loading observed during these monitored storms, with greater removals for the large particles and somewhat smaller removals for the smaller particles. Table 4 Summary of particle size distribution of 40 monitored storms. Particle Size (µm) Average Mass Percentage (%) Average Solids Concentration for the range (mg/l) Calculated Total Mass of sampled storm events for the range (lbs) Average Percentage Reduction by Concentration Influent Effluent Influent Effluent Influent Effluent % % % % % % % > % Total % Figure 10 shows that the median particle size (D50) of the influent samples was ~460 µm and ~45 µm for the effluent samples. The influent D50 is quite large compared to most outfall stormwater samples as the source water was from an adjacent parking lot and the larger particulates were effectively delivered to the treatment device. At outfalls in typical drainage areas, most of the large particulates are trapped as semi-permanent bedload in the collection and storm drainage systems. 6
7 During periods of peak flows, the treatment capacity of the Up-Flo filter may be exceeded and the excess flow discharged to the outlet through the bypass weir. This bypassed flow is still partially treated due to the settling of the largest particulates in the sump and the capture of most floatables by the siphon. Some of the large particles in the sump may be resuspended and discharged during periods of peak flows, but this has been found to be very small if >10 cm water covers the captured sediment in catchbasin sumps (Avila and Pitt 2009). This occurs more frequently when the filter media reaches the Figure 10 Cumulative percentage distribution by particle size for 40 monitored storms. Figure 11 indicates that particle capture is effective for all particle sizes, but is best for the largest particles. In addition, ~26% and 3.3% of the total particulate solids load (303 lb, kg, and 3.1 lb, 1.41 kg, of calculated mass) for the influent and effluent respectively are >1 180 µm. The absolute largest particle sizes are not known based on the stormwater sampling. The sump sediment samples will be analyzed for a wider range of particle sizes and the largest size can then be determined for the mass balance calculations. end of its operating life, when the filter media bags are occluded by fine particulates. Figure 12 shows line plots of influent and effluent concentrations for several particle size ranges. These line plots indicate that the Up-Flo filter has distinct overall removals for each specific particle range, even for particle sizes as small as 3 µm. These plots also show that the Up-Flo filter retains almost all of the relatively large particles (>250 µm). Some reverse sloped lines occur occasionally, indicating an increase in concentration, likely due to analytical variability or possible sump scouring. Table 5 summarizes the analytical results and removals for the 40 monitored storms for all analyzed constituents, including solids, nutrients, metals, bacteria and some water quality Figure 11 Cumulative calculated mass distribution by indexes, along with the method detection limits. Based on the results for the forty monitored storm events, the Up-Flo filter is shown to have significant reductions for all particulate solids constituents (TSS, SSC, VSS and TDS), along with total and dissolved nitrogen and phosphorus, nitrate, total zinc, E.Coli, Enterococci and turbidity. Some of the monitored constituents were not shown to have significant removals based on the number of samples available. Reported removal ranges are due to some of the effluent concentrations being below the detection limits and the two values were calculated substituting 0 and the detection limit for particle size. these conditions. 7


8 Figure 12 Line plots of solids performance for particle ranges. 8
9 Table 5 Constituent Summary of water quality analyses information for 40 monitored storms. Influent Average (COV) Effluent Average (COV) Flow-weighted Percent Reduction P-value (Significant or Not) TSS 86 (1.0) 19 (0.8) 81.9% <0.001 (S) 1 mg/l SSC 149 (2.5) 21 (0.8) 89.9% <0.001 (S) 1 mg/l TDS 82 (0.7) 58 (0.5) 33.1% <0.001 (S) 1 mg/l VSS 32 (0.9) 8 (0.8) 77.7% <0.001 (S) 1 mg/l Total N as N 2.2 (0.7) 1.3 (0.6) 36.7% <0.001 (S) 0.1 mg/l Dissolved N as N 1.4 (0.6) 0.8 (0.6) 37.7% <0.001 (S) 0.1 mg/l Ammonia as N BDL (NA) BDL (NA) NA NA 0.1 mg/l Nitrate as N 0.6 (0.9) 0.4 (0.7) 32.8% to 32.9% <0.001 (S) 0.02 mg/l Total P as P 1.1 (0.5) 0.9 (0.6) 17.0% <0.001 (S) 0.02 mg/l Dissolved P as P 0.7 (0.6) 0.5 (0.6) 14.8% to 14.9% <0.001 (S) 0.02 mg/l Total Orthophosphate as P 0.37 (0.6) 0.36 (0.6) 1.6% to 3.6% (N) 0.02 mg/l Dissolved Orthophosphate as P 0.36 (0.4) 0.32 (0.4) 1.2% to 1.4% (N) 0.02 mg/l Total Cd (1.1) BDL (NA) 91.9% to 100% (N) mg/l Dissolved Cd (0.9) BDL (NA) 87.6% to 100% (N) mg/l Total Cr (0.3) BDL (NA) 38.9% to 100% (N) mg/l Dissolved Cr BDL (NA) BDL (NA) NA NA mg/l Total Cu (1.7) (0.9) 53.6% to 75.7% (N) mg/l Dissolved Cu (0.9) (1.1) 41.8% to 78.6% (N) mg/l Total Pb (0.9) (NA) 67.2% to 98.3% (N) mg/l Dissolved Pb BDL (NA) BDL (NA) NA NA mg/l Total Zn (2.4) (0.8) 78.5% to 83.2% <0.001 (S) mg/l Dissolved Zn (2.5) (0.7) 88.8% to 90.8% (N) mg/l E. Coli 7323 (1.7) 4031 (2.0) 53.5% <0.001 (S) <1 Enterococci 6735 (0.9) 2995 (1.3) 57.3% <0.001 (S) <1 Turbidity 22.2 (0.8) 8.2 (0.7) 61.3% <0.001 (S) 0 NTU All units are in mg/l except: ph; Bacteria in MPN/100 ml; Turbidity in NTU; Conductivity in μs/cm; and Temperature in C. COV: Coefficient of variation; MDL Method Detection Limit; BDL Below Detection Limit. Wilcoxon Signed Rank Test (non-parametric) is used for hypothesis test; S: Significant; N: Not significant. 7 Conclusions The field performance of the Up-Flo filter under different conditions and scales has been examined by several researchers (Pitt and Khambhammettu 2006; Togawa 2011). They have found that the Up-Flo filter has excellent removal rates for solids under a wide range of precipitation conditions. The results of solids analyses conducted in this research indicate an average 82% flow weighted removal of TSS and an average 90% flow weighted removal of SSC, along with effective particulate capture for all particle sizes. In addition, the ability to remove several types of pollutants in stormwater, including some nutrients, total forms of metals and bacteria, was also demonstrated, even though the removal for some other constituents (e.g. phosphorus) was not statistically significant based on the number of samples available. The following summarizes the performance of the monitored MDL constituents by category (not considering the increased performance associated with the captured material in the sump): excellent removals (>80%): TSS, SSC, total and dissolved* Cd, total Cr*, total Pb*, and total and dissolved Zn* (* upper limit of expected range of performance in this category); very good removals (60 to 80%): VSS, turbidity, and total and dissolved Cu*; moderate removals (40% to 60%): E. coli and enterococci; low removals (20% to 40%): TDS, total and dissolved N, and nitrate; and poor or insignificant removals (<20%): total and dissolved forms of P. Currently, the field testing is still in progress, with a total of ~50 storms expected to be sampled by the summer of After the sampling is completed, the sediment in the sump will be collected and analyzed to calculate the mass balance of solids for the overall performance of the filter system. The filter media bags will also be changed out and weighed for the calculation of mass balance. This will result in additional data to be available to demonstrate the field performance of the Up-Flo filter with more confidence. References ASTM Method D (B) (1997, Reapproved 2002): Standard Test Methods for Determining Sediment Concentration in Water Samples. West Conshocken, PA: ASTM (American Society for Testing and Materials). Avila, H. and R.E. Pitt "Scour in Stormwater Catchbasin Devices Experimental Results from a Full-Scale Physical Model." Journal of Water Management Modeling R doi: /JWMM.R Burton, G. A. R. Jr and R. E. Pitt Stormwater Effects Handbook: A Toolbox for Watershed Managers, Scientists, and Engineers. Boca Raton, FL: CRC Press. Clark, S. E. and R. E. Pitt Comparison of Stormwater Solids Analytical Methods for Performance Evaluation of Manufactured Treatment Devices. Journal of Environmental Engineering 134 (4) : Clark, S. E. and C. Y. S. Siu Measuring Solids Concentration in Stormwater Runoff: Comparison of Analytical Methods. Environmental Science and Technology 42 (2): Clark, S. E., C. Y. S. Siu, R.E. Pitt, C. D. Roenning and D. P. Tresse Peristaltic Pump Autosamplers for Solids Measurement in Stormwater Runoff. Water Environment Research 81 (2): Clesceri, L. S., A. E. Greenberg and A. D. Eaton (eds.) Standard Methods for the Examination of Water and Wastewater, 20th ed. American Public Health Association, American 9
10 Water Works Association and Water Environment Federation. Khambhammettu, U., R. E. Pitt, R. Andoh and D. Woelkers Full Scale Evaluation of the UpFlo Filter: A Catchbasin Insert for the Treatment of Stormwater at Critical Source Areas. In Proceedings of the Water Environment Federation, WEFTEC 2006, Session 71. Alexandria, VA: Water Environment Federation. NJCAT MTD Laboratory Test Certification for the Up-Flo Filter by Hydro International. Trenton, NJ: New Jersey Department of Environmental Protection. NJDEP The Technology Acceptance Reciprocity Partnership (TARP) Protocol for Stormwater Best Management Practice Demonstrations. Trenton, NJ: New Jersey Department of Environmental Protection. docs/tarp_stormwater_protocol.pdf. NJDEP Protocol for Total Suspended Solids Removal Based on Field Testing: Amendments to TARP Protocol Dated August 5, 2009 Revised December 15, Trenton, NJ: New Jersey Department of Environmental Protection. state.nj.us/dep/stormwater/pdf/field_protocol_12_15_09. pdf. Pitt, R. E., R. Field, M. Lalor and M. Brown Urban Stormwater Toxic Pollutants: Assessment, Sources and Treatability. Water Environment Research 67 (3): Togawa, N Development and Testing of Protocols for Evaluating Emerging Technologies for the Treatment of Stormwater. Tuscaloosa, AL: The University of Alabama, Tuscaloosa. Ph.D. Dissertation. USEPA Methods for Chemical Analysis of Water and Wastes. Washington, DC: U. S. Environmental Protection Agency. EPA-600/ Revised (3/83). Yezhao Cai University of Alabama, Tuscaloosa, AL. Robert E. Pitt University of Alabama, Tuscaloosa, AL. Noboru Togawa IO, Oklahoma City, OK. Kevin McGee Hydro International, Portland, ME. Kwabena Osei Hydro International, Portland, ME. Robert Andoh Hydro International, Portland, ME. 10