3D Modelling of Oxygen Fired CFB Combustors in Different Scales
|
|
|
- Joanna James
- 5 years ago
- Views:
Transcription


1 3rd Oxyfuel Combustion Conference Ponferrada, Spain, 9th - 13th September D Modelling of Oxygen Fired CFB Combustors in Different Scales Presented by: Jarno Parkkinen a Co-authors: Pasi Antikainen b, Manuel Gómez c, Kari Myöhänen a, Timo Hyppänen a a Lappeenranta University of Technology b Foster Wheeler Energia Oy c Fundacion Ciudad de la Energia (CIUDEN)
2 Presentation outline Background Oxygen fired CFB combustion. Development path from small to large scale. 3D CFB furnace model. Modelling of oxygen fired CFB combustors in different scales CIUDEN s Technology Development Plant (TDP). OXY-CFB-300 Compostilla project. Discussion and conclusions Acknowledgements: The presentation contains material, which has been partially produced in cooperation with Foster Wheeler Energia Oy and Fundacion Ciudad de la Energia (CIUDEN). The research leading to these results has received funding from the European Community s Seventh Framework Programme (FP7/ ) under grant agreement n
 Other Air ASU O 2 Flue gas")
3 Air-fired vs. oxygen-fired combustion Air-fired To atmosphere Oxygen-fired Vent gases Fuel CFB furnace Flue gas Fuel CFB furnace Flue gas H 2 O CPU CO 2 Air O2 CO2 H2O N2 (+ Ar) Other Air ASU O 2 Flue gas composition after furnace Other = CO, NO x, SO x, C x H y, H 2,... Transport Storage O2 CO2 H2O N2 (+ Ar) Other ASU = Air Separation Unit, CPU = Compression and Purification Unit
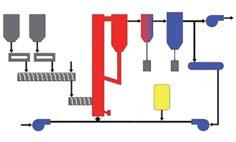
4 Flexi-Burn CFB process Turbine island To cooling tower CPU Fuel Limestone CFB Boiler SH1, RH1, Eco Intrex Fluidizing gas Secondary gas LP EcoA LP EcoB Mixer Filter Wet flue gas recirculation Air Oxygen HRS Condenser H 2 O etc. Vent gases Drying Compression Purification H 2 O etc. CO 2 Transport Storage ASU Preheater Flexi-Burn is a trademark of Foster Wheeler Energia Oy, registered in the US, EU, Finland.


5 M Illustration of technology scale-up Oxy-CFB-300 (700 MW th ) O2GEN Next generation oxygen-fired CFB Bench scale VTT pilot (0.1 MW th ) CANMET pilot (0.8 MW th ) CIUDEN TDP (30 MW th ) Focus of this presentation


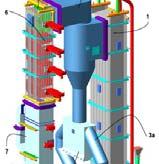
6 Three-dimensional model Calculation mesh of OXY-CFB-300 A steady-state, semi-empirical model, which describes the CFB furnace process. Linked with submodels for separators and external heat exchangers. 3D-modelling of furnace based on control volume method. Validation based on field tests at pilot scale and full scale units. w v u + v + ρ u w + Sec. airs Fuels Sorbent Grid air
7 Modelled reaction paths Fuel Evaporation H 2 O Inert Devolatilization Ash Volatiles Moisture Char Char combustion +O 2 NO, N 2 O HCN, NH 3 H 2 S CO, CO 2 CH 4, C 2 H 4 H 2 Char gasification +H 2 O, +CO 2 CO H 2 H 2 S 2 N 2 H 2 O CO, CO 2 SO 2 In addition: Limestone reactions Gas combustion reactions CO + 0.5O 2 CO 2 Shift conversion CO + H 2 O CO 2 + H 2 CaCO 3 CaO + CO 2 CaO + SO 2 +½O 2 CaSO 4 H O 2 H 2 O CaCO 3 + SO 2 + ½O 2 CaSO 4 + CO 2 CH 4 + 2O 2 CO 2 + 2H 2 O CaSO 4 + CO CaO + SO 2 + CO 2 C 2 H 4 +3O 2 2CO 2 +2HO 2 Nitrogen chemistry H 2 S + 1.5O 2 H 2 O + SO 2 (HCN, NH 3, NO, N 2 O)
8 Fluid dynamics of fuel flow Two different methods to solve fuel flow The target-dispersion model An empirical i target t solid concentration ti profile for fuel is defined d The fuel is flowing from the feed points towards the target profile by dispersion The fuel-convection model A simplified momentum equation is defined and solved for fuel The fuel flow is controlled by the affecting forces: gravity, inertia, and drag forces from gas and solid phases Dispersion model Convection model F gf = K gf (v g v f ) F sf = K sf (v s v f ) Fuel feed Target profile Fuel feed F g =ρ f g


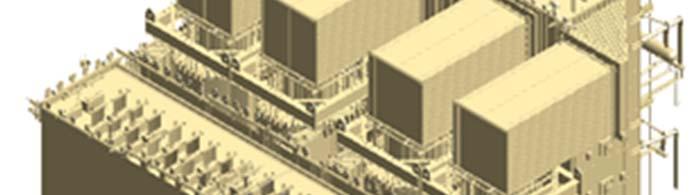
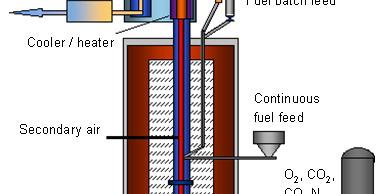
9 Measurements at CIUDEN TDP Measurement points Modelled data Field instrumentation -> DCS Process data for determining the model input parameters and mass & energy balances CIUDEN TDP Profile measurements 30 MWth air/oxygen-fired CFB combustor Net measurements at four levels Over 100 test t balances during with Gas concentrations, ti temperature t different fuel mixtures and operating conditions 3D data for model validation


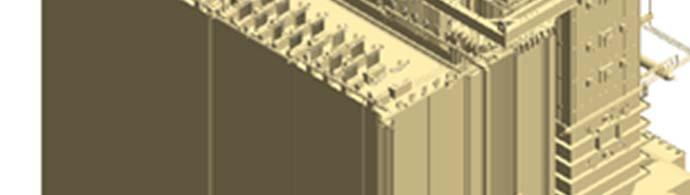
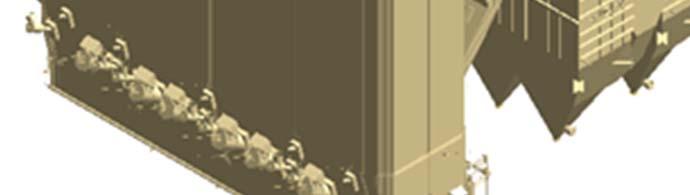
10 CIUDEN TDP CFB3D-model Furnace model consisted of about cells Cell size approx. 0.15x0.15x0.20 m The actual furnace geometry was modeled as true as possible including the locations of all the different inlets and outlets Example case: Fuel: anthracite Oxygen-fired Thermal power 15 MW
11 Ciuden TDP validation Height [m] Height [m] Height [m] Measured Model Height eg t[ [m] Height [m] Height [m] Measured Model Bed temperature


12 Ciuden TDP validation O2 CO2 H2O N2 Other O2 CO2 H2O N2 Other


13 Modelling of OXY-CFB-300 Calculation cases: Case Load Mode Oxy % Oxygen-fired Oxy40 40% Oxygen-fired Air90 90% Air-fired Air40 40% Air-fired Thermal power 700 MW. Fuels: Spanish anthracite + petroleum coke. Sorbent: Spanish calcitic limestone. In oxygen-fired mode, inlet O 2 = 23.5 %-vol. Flue gas recycle ratio 69%. Oxygen purity 96.6 %-vol. Calculation mesh: cells. Cell size 0.4 m x 0.4 m x 0.4 m.
14 Flue gas composition (after furnace) 80 Gas con ncentrat tion (mo ol-%) Oxy100 Air90 Oxy40 Air40 O2 CO2 H2O N2 Ar Other Other = CO, SO 2, NO x


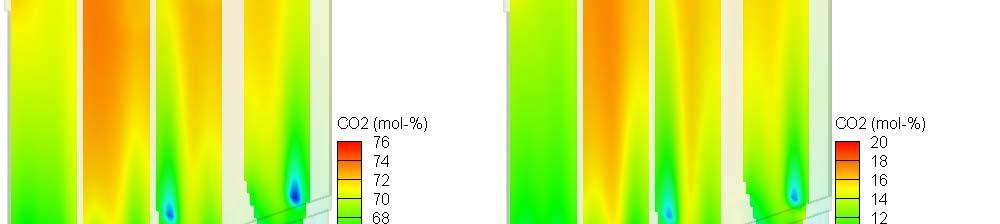
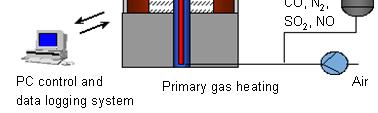
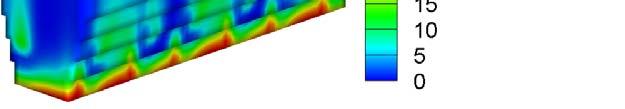
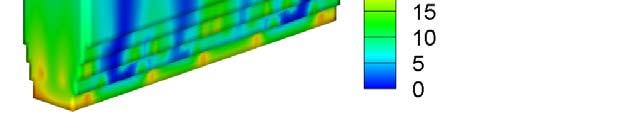
15 Oxygen and carbon dioxide profiles Oxygen Carbon dioxide

16 Formation and combustion of carbon monoxide CO from char combustion CO combustion rate CO from devolatilization Carbon monoxide


17 Effect of gasification reactions CO from char gasification reactions In oxygen-fired mode, the gasification reactions of char are enhanced due to higher CO 2 and H 2 O level: Water-gas C + H 2 O H 2 + CO Boudouard C + CO 2 2 CO Based on model results, the effect of these reactions is very small compared with the CO originating from char combustion and devolatilization (see previous page) In oxygen-fired mode, the shift conversion (towards H 2 ) is enhanced due to higher H 2 O level: CO + H 2 O CO 2 +H 2 The effects of the above gasification reactions are small and the total combustion efficiency is approximately the same in air-fired and oxygen-fired mode. Shift conversion


18 Temperature and heat flux profiles Temperature Heat flux


19 Modeling of O2GEN Oxy-CFB-300 O2GEN Inlet O % Inlet O %
20 Discussion and conclusions The oxygen-fired CFB combustion has been simulated by 3D-modelling. The measurements e e s at CIUDEN TDP have been applied to validate the model and the model has been applied to support the development of the OXY-CFB-300 Compostilla demonstration plant. With small inlet O 2 (< 24%) the oxygen concentrations inside the furnace is similar in oxygen-fired and air-fired combustion. Thus the combustion process is fairly similar in both modes. Some differences are noticed due to higher concentrations of CO 2 and H 2 O in oxygen-fired mode: The combustion rate of CO is better due to effect of water vapor. The gasification reactions are enhanced. The effects of these changes are small. Larger changes are possible in the limestone reactions and sulfur capture, if the oxygen-fired furnace is operated below the calcination temperature. These are discussed in a presentation by Sirpa Rahiala.
21 References Myöhänen, K., et al. (2009). Near zero CO 2 emissions in coal firing with oxy-fuel CFB boiler. Chemical Engineering & Technology, 32(3), pp url: Myöhänen, K. and Hyppänen, T. (2011). A three-dimensional model frame for modelling combustion and gasification in circulating fluidized bed furnaces. International Journal of Chemical Reactor Engineering, 9. Article A25, 55 p. url: Myöhänen K. (2011). Modelling of combustion and sorbent reactions in three-dimensional flow environment of a circulating fluidized bed furnace [dissertation]. Lappeenranta University of Technology, Lappeenranta.
22 Thank you for your attention!