City of Altheim Geothermal Energy Supply
|
|
|
- Jeremy Powell
- 5 years ago
- Views:
Transcription


1 City of Altheim Geothermal Energy Supply

2 Bayerisches Landesamt für Wasserwirtschaft Location Altheim


3 Geological section Reinjection well m TVD m MD m deviation 100 l/s End-Ø 6 1/4, open hole Production well m 100 l/s End- 5 5/8, open hole Geotec Consult, Markt Schwaben, Germany
4 Data sheet ORC / nominal conditions (final design) Thermal water inlet temperature 106 C Thermal water outlet temperature 70 C Thermal water flow rate Thermal capacity Cooling water flow rate 81,7 kg/s kw 340 kg/s Cooling water inlet temperature (mean) 10 C Cooling water out let temperature 18 C Electric net output kw


5
6 MWh heat supplied in November December September October May June July August April March January February
7 Sum of the daily differences between the mean room temperature of 20 C and the mean outdoor temperature for days on which heating is necessary (=days with mean values below 15 C) Jahr
8 ORC power plant - annual supply to the public grid kwh Year
9 Supply to the grid - monthly January February March April May June July August September October November December kwh

10
11 2003 hours Out of operation main reasons January 178,75 Frost no cooling water February 172,00 Frost no cooling water March 6,50 Others April 80,50 Maintenance condenser May 37,50 Maintenance cooling water plant June 31,00 Turbine noise improvement July 22,00 Lightning strike August 281,25 Cooling water temperature too high September 25,50 Turbine noise improvement October 36,50 Leakage head reinjection well November 1,50 Others December 323,00 Submersible pump damage on cable (about 200 hours); air in the condenser, cleaning condenser pipes 1.196,00 Out of operation 7.564,00 On the grid


12


13


14
15 2004 Out of operation - main reasons hours January 62,25 Dirty cooling water February 116,50 Dirty cooling water March 278,75 Leakage working fluid cycle April 50,00 Dirty cooling water May 31,00 Controlling problems June 163,00 Dirty cooling water, annual maintenance 49,25 Pumping test ordered by the water authority July 429,25 Pumping test ordered by the water authority August 321,75 Pumping test ordered by the water authority September 130,00 Pumping test ordered by the water authority 44,00 Condenser cleaning October 582,75 Leakage working fluid cycle November 386,00 Leakage working fluid cycle December 124,00 Air in the working fluid cycle after topping of fluid, dirty feed pump filter 2.768,50 Out of operation 930,25 Part caused by the pumping test 5.991,50 On the grid
16 2005 Out of operation - main reasons hours January 42,50 Cooling water problems (frost, dirt) February 89,75 Cooling water problems, leakage evaporator March 744,00 Lack of working fluid - supplier stopped the production April 720,00 Lack of working fluid - supplier stopped the production May 744,00 Lack of working fluid - supplier stopped the production June 720,00 Lack of working fluid - supplier stopped the production July 744,00 Lack of working fluid - supplier stopped the production August 297,00 Lack of working fluid - supplier stopped the production; from mid of August new working fluid September 13,25 Cleaning work cooling water filters October 11,25 No cooling water November 16,25 Maintenance feed pump December 5,25 Maintenance feed pump 4.147,25 Out of operation 4.612,75 On the grid
17 2006 Out of operation - main reasons hours January 377,25 No cooling water - frost February 215,75 No cooling water - frost March 258,00 April 26,00 No cooling water - high water/ cooling water very dirty - No cooling water - high water/cooling water very dirty - May 8,25 Cleaning cooling water filter June 91,00 July 152,00 Cooling water very dirty after torrents of rain; lightning strike Lightning strike, cooling water very dirty; cooling water to warm August 53,25 Cooling water very dirty September (status 13.) 0,25 Pressure test production well Out of operation per 9/ ,75 Max. annual hours per 9/ ,00 On the grid per 9/ ,25


18


19


20


21
22
23 Pump consumption Submersible pump: Consumption / frequency / lit. per second Hertz kw Lit./sec
24 Supply to the grid Generator Sub.pump Grid kw :00 08:00 16:00 06:
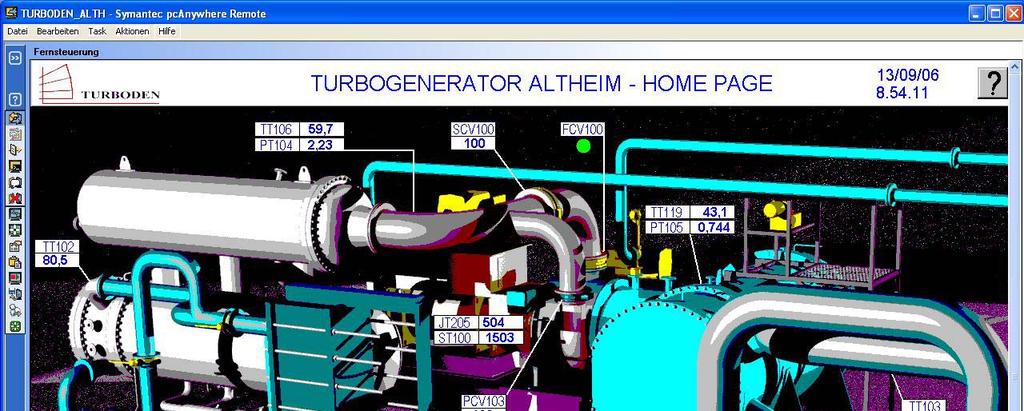

25 ORC-turbogenerator

26


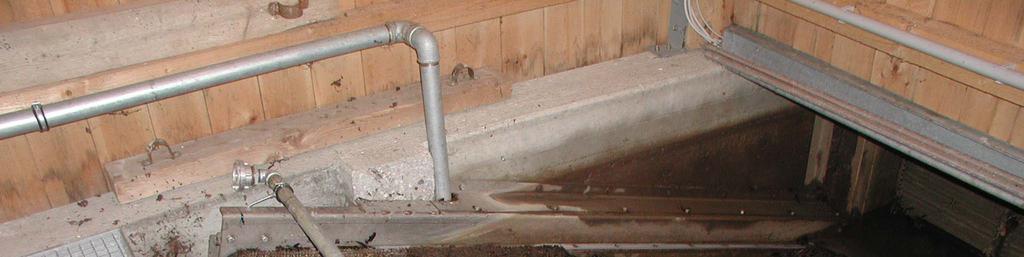
27 Reinjection well
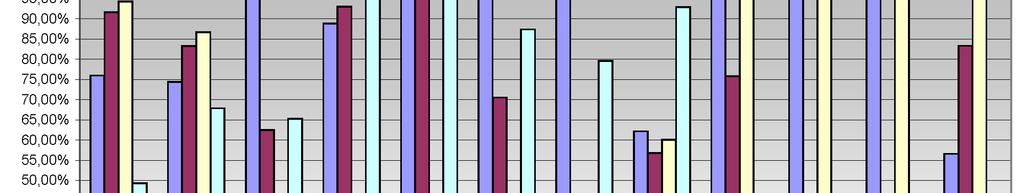
28 Date Time l/s thermal water Cooling water inlet temp. DtAnt Generator kw el kw th Efficiency ,5 6, ,91% highest : ,8 5, ,43% : ,0 1, ,46% : ,3 2, ,52% : ,4 7, ,84% : ,0 10, ,64% : ,8 3, ,63% : ,4 6, ,02% : ,9 5, ,71% : ,0 15, ,71% lowest : ,6 6, ,71% : ,6 5, ,07% Aug : ,1 5, ,03% new : ,8 6, ,49% working fluid : ,7 5, ,69% : ,0 7, ,83% : ,7 6, ,37% : ,1 5, ,43% highest : ,3 5, ,78% : ,8 5, ,11% : ,2 6, ,36% : ,8 6, ,74%
29 Mai.05 Jul.05 Sep.05 Nov.05 Nov.04 Sep.04 5,25 5,00 4,75 4,50 4,25 4,00 3,75 3,50 3,25 3,00 2,75 2,50 2,25 2,00 1,75 1,50 1,25 1,00 0,75 0,50 0,25 0,00 Monthly 15-minute-well head pressure production well Mai.02 Jul.02 Sep.02 Nov.02 Mai.03 Jul.03 Sep.03 Nov.03 Mai.04 Jul.04 Nov.01 Sep.01 Jul.01 Mai.01 bar
30 3,38 3,25 3,13 3,00 2,88 2,75 2,63 2,50 2,38 2,25 2,13 2,00 1,88 1,75 1,63 1,50 1,38 1,25 1,13 1,00 0,88 0,75 0,63 0,50 0,38 0,25 0,13 0,00 Monthly 15-minute-well head pressure reinjection well Jän. 01 Mär. 01 Mai. 01 Jul. 01 Sep. 01 Nov. 01 Jän. 02 Mär. 02 Mai. 02 Jul. 02 Sep. 02 Nov. 02 Jän. 03 Mär. 03 Mai. 03 Jul. 03 Sep. 03 Nov. 03 Jän. 04 Mär. 04 Mai. 04 Jul. 04 Sep. 04 Nov. 04 Jän. 05 Mär. 05 Mai. 05 Jul. 05 Sep. 05 Nov. 05
31 Current electricity price per kwh ( ) Winter time (October March) Cent Summer time (April September) 9.12 Cent Price depends on the Future Market of the European Energy Exchange, Frankfurt.
32 Electricity price - trend Winter Summer Cent per kwh 11,50 11,00 10,50 10,00 9,50 9,00 8,50 8,00 7,50 7,00 6,50 6,00 5,50 5,00 4,50 4,00 3,50 3,00 2,50 2,00 1,50 1,00 0,50 0,00 10,48 9,74 9,12 7,58 7,60 6,34 6,34 5, / / / /2006
33 Thank you for your attention!