Groundwater Flow Model Development for Cumulative Effects Management within the Athabasca Oil Sands
|
|
|
- Shanon Caldwell
- 5 years ago
- Views:
Transcription

1 Groundwater Flow Model Development for Cumulative Effects Management within the Athabasca Oil Sands Margaret Scott, MASc, EIT Jos Beckers, PhD, P Geoph Matthew Webb, MSc


2 Overview Groundwater Management Framework Tools Modelling Tool Developments Methodology Conceptualization Numerical Model Continued Work Challenges

3 Groundwater Management Framework Tools Develop & Integrate Tools Modelling Management Monitoring
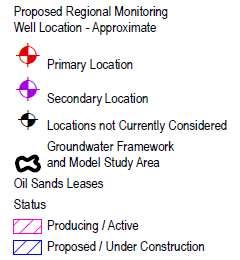
4 Modelling NAOS region SAOS region CLBR region Management Groundwater Management Framework Monitoring Regional Groundwater Monitoring Network


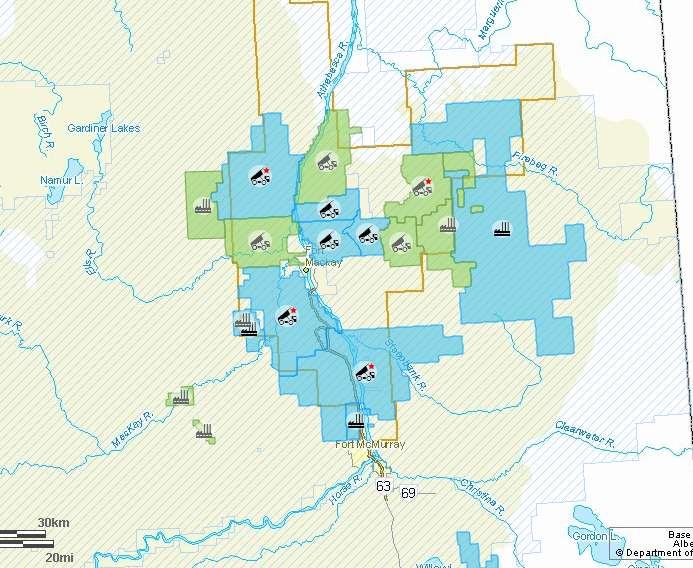
5 NAOS Region 18,000 km 2 NAOS SAOS CLBR Source:
6 Review & Refine Methodology Develop Study Objectives Define Study Area Industry Consultation External Experts (Technical Working Group) Collect Data Develop Conceptual Model Develop Numerical Model Apply Model to Study Objectives


7 Industry Participants
8 External Experts Alfonso Rivera Director of Geoscience for the Geological Survey of Canada Member of expert panel that reviewed the NAOS Groundwater Management Framework René Therrien Chair, Department of Geology and Geological Engineering at Université Laval Member of the Royal Society of Canada Expert Panel

9 Hydrology Meteorology Fort McMurray Airport Mildred Lake Aurora Climate Station Hydrometric Stations 13 RAMP 27 WSC HYDAT


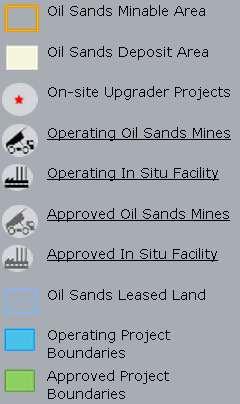
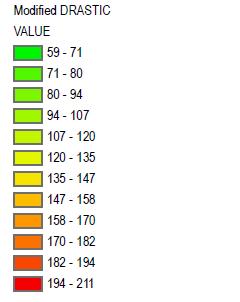
10 Hydrogeology Wells: 1,019 Water Levels: 853,266 Date range: 1974 to 2011 Includes NAOS RGWMN Data RGWMN Wells Hydrology Groundwater Model Study Area Province Boundary
11 Continued Upper Mannville Colorado Hydrostratigraphy Period Group Formation Hydrostratigraphy Quaternary Cretaceous Surficial Deposits Undifferentiated Sands Overburden Sand Aquifer 1 Tills Till Aquitard 1 Sands Sand Aquifer 2 Tills Till Aquitard 2 Coarse Fluvial Sediments La Biche Viking (Pelican) Joli Fou Grand Rapids Bedrock Channel Aquifer Colorado Aquitard Upper Grand Rapids 1 Aquifer Upper Grand Rapids 2 Aquifer Lower Grand Rapids 1 Aquifer Lower Grand Rapids 2 Aquifer
12 Elk Point Beaverhill Lake Mannville McMurray Hydrostratigraphy (continued) Period Group Formation Hydrostratigraphy Cretaceous Clearwater Upper Middle (Top Water) Middle (Bitumen) Lower (Bitumen) Lower (Basal Sand) Sub-Cretaceous Unconformity Devonian Waterways Slave Point Fort Vermillion Watt Mountain Muskeg Keg River Contact Rapids Basal Red Beds/La Loche Clearwater Aquitard Middle McMurray Top Water Aquifer McMurray Aquitard McMurray Basal Sand Aquifer Beaverhill Lake-Cooking Lake Aquifer/Aquitard Prairie Aquitard/Aquiclude Keg River Aquifer Contact Rapids Aquitard Basal Aquifer


 Grid Data")
13 Surface & Isopach Development Data compiled in relational databases Developed database tools to QA/QC data Linked databases to visualization software Devonian Surface Operator Tops (50,433) Grid Data (10,485) Control Points (5)


14 Conceptualization Recharge Recharge B Recharge Recharge B Quaternary/Tertiary Cretaceous Devonian

15 South Spruce Channel Spruce Valley Athabasca River Conceptualization Thickwood Valley B B Overburden Aquifer/Aquitard Till Aquitard 2 Till Aquitard 1 Sand Aquifer 1 Bedrock Channel Aquifer Sand Aquifer 2 McMurray Basal Sand Aquifer B B
16 Model Design & Calibration 21 layer FEFLOW model (3.0 million elements) Calibration Methodology 1. Steady state calibration: Manual Automated (PEST) to optimize parameters and recharge rates 2. Transient calibration: Initial for McMurray Basal Sand Aquifer Complete (future) 3. Sensitivity Analysis: Preliminary based on SAOS model parameter confidence bounds Complete following finalized transient calibration Obs 16 - SP Obs Observed Min Impact Best Estimate Max Impact
 Component 1:1 Line Undifferentiated Overburden Bedrock Channels Undifferentiated Grand Rapids Middle McMurray Top Water McMurray Basal Sand Beaverhill Lake-Cooking Lake Keg River Inflows (m 3")
17 Simulated Hydraulic Heads (masl) Calibration Quality Inter-basin 27, Flow Total , ,000 Observed Hydraulic Heads (masl) Component 1:1 Line Undifferentiated Overburden Bedrock Channels Undifferentiated Grand Rapids Middle McMurray Top Water McMurray Basal Sand Beaverhill Lake-Cooking Lake Keg River Inflows (m 3 /day) Recharge 598,000 Outflows (m 3 /day) Rivers 246, ,000 Lakes 62,200 69,400 Model Error 0.4%
 to optimize parameters and assess confidence bounds Transient calibration to historic groundwater")
18 Model Design 25 layer FEFLOW model (292,075 elements) 1. Three model versions to assess prediction confidence Best Estimate Model Min Impact Model Max Impact Model 2. Calibration Initial manual steady state calibration Automated (PEST) to optimize parameters and assess confidence bounds Transient calibration to historic groundwater use/injection in region
19 Cumulative Groundwater use Per Region (m 3 ) 0 50,000, ,000, ,000, ,000, ,000,000 Predictive Scenarios Region 1 Future Water Demand Region 2 Region 3 Scenario 1 (Constant Rates) Scenario 2 (2Mbpd) Scenario 3 (LARP; 4Mbpd)
 Assess effectiveness of existing")
20 Scenario 1 Results Drawdown in Lower Grand Rapids Aquifer Scenario results can be used to : Quantify regional cumulative impacts Recommendations for monitoring network development Assess projected drawdown at proposed MWs (targets) Assess effectiveness of existing guidelines

21 Performance Monitoring
22 Challenges & Continued Work Data compilation and management (ongoing) Data sharing agreements Database development Data formats and standards Defining & applying development scenario(s) to identify locations for RGWMN expansion (NAOS Phase 2) Communication Between expanding Technical Working Group (ongoing) Presenting NAOS & SAOS model results to the public (Phase 3) Conceptual and numerical model updates (NAOS & SAOS) Schedule updates Define data submission requirements Increase model complexity (density dependent flow & transport and integrated SW/GW modelling) Targeted regional studies (future)
23 Questions? Margaret Scott Tel (Direct) Fax