Air Quality Monitoring
|
|
|
- Kerrie Paul
- 5 years ago
- Views:
Transcription
 natural gas well blowout, except Site which was a background site. The one-hour AAAQO for hydrogen sulphide of 0.010 ppm was not exceeded.")
1 Air Quality Monitoring in the vicinity of a CNRL well blowout February 25, 2010 to March 9, 2010 Summary report Overview All monitoring sites were downwind of the Canadian Natural Resources Limited (CNRL) natural gas well blowout, except Site which was a background site. The one-hour AAAQO for hydrogen sulphide of ppm was not exceeded. The maximum one-hour average for hydrogen sulphide of ppm was measured at both Site, the background site, and Site H. These were the only two sites where hydrogen sulphide was above the detection limit. The highest one-hour total reduced sulphur concentration of ppm was measured at Site E. The highest median sulphur dioxide concentration was ppm, measured at Site E. This was comparable to the maximum sulphur dioxide value recorded at Sites H and K, as well as at the background Site. These concentrations did not exceed the one-hour AAAQO of ppm. Median one-hour PM 10 concentration ranged from 0.3 μg/m 3 to 52.4 μg/m 3. The median one-hour PM 2.5 concentrations ranged from 0.2 μg/m 3 to 37.3 μg/m 3. The median one-hour PM 1 concentrations ranged from 0.2 μg/m 3 to 33.2 μg/m 3. All minimum values were measured at Site B, and all maximum values were measured at Site K. The measured values for PM 2.5 were all well below the AAAQ, which is a value of 80 μg/m 3. ISBN No (Printed Edition) ISBN No (On-Line Edition) September 7, 2010
2 1. Introduction Alberta Environment conducts mobile air quality surveys in emergency situations. These surveys are requested by the Alberta Environment Support and Emergency Response Team (ASERT), and in this case the department s mobile air monitoring laboratory (MAML) was deemed appropriate to analyze the air quality. The MAML is equipped to measure a number of air pollutants including ammonia, carbon monoxide, hydrocarbons, oxides of nitrogen, ozone, particulate matter, reduced sulphur compounds and sulphur dioxide. For the current project, the emergency situation was the Canadian Natural Resources Limited (to be referred to as CNRL for the duration of the report) natural gas well blowout approximately 20 kilometers northwest of Hythe, Alberta. Monitoring was performed in the vicinity of the well blowout at twelve stationary sample sites as well as one mobile site. The surveys were conducted over a period of eight days, from February 25 to March 9, 2010, inclusive. During the sample period, over fifty hours of data were collected. The objectives for monitoring in the Hythe area were to identify and determine the concentrations of common air pollutants near the CNRL natural gas well blowout site, and then consequently to compare them to the Alberta Ambient Air Quality Objectives. To achieve these objectives, monitoring was carried out for at least one hour at each monitoring location, and in most cases there were several hours of monitoring conducted at each site. This facilitated comparison to Alberta s Ambient Air Quality Air Quality Objectives and uidelines (AAAQOs and AAAQs). AAAQOs are established to define desired environmental quality that will protect public health and ecosystems and are used by Alberta Environment to ensure good air quality through out the province. 2
3 2. Monitoring method and locations Air quality measurements around the CNRL well blowout were performed using Alberta Environment s mobile monitoring laboratory (MAML). The MAML provides a snapshot in time and place of the quality of air. It s equipped to monitor ammonia, carbon monoxide, hydrocarbons, oxides of nitrogen, ozone, particulate matter, reduced sulphur compounds and sulphur dioxide simultaneously. For this incident, only sulphur dioxide (SO 2 ), total reduced sulphur (TRS), hydrogen sulphide (H 2 S), and particulate matter with aerodynamic diameters less than 10, 2.5, and 1 micrometers (PM 10, PM 2.5, and PM 1, respectively) were measured. Descriptions of the MAML and the detection limits of its on board instruments are given in Appendix D. The measurements were conducted for a total of eight days between February 25, 2010 and March 9, The monitoring schedule is presented in Table A3 in the appendix. In total, approximately 52 hours of data were collected at twelve stationary monitoring sites and one mobile monitoring site. The locations of the monitoring sites are described in Table 1 and illustrated in Figure 1. Site O in Figure 1 is the location of the well blowout. Sites A-L were ambient monitoring sites. Not all sites are included in this report. Sites D and L did not have one full hour of measurement conducted, thus data collected at these sites is not discussed. Also, data from Site M was not included in the analysis, because the sample was significantly impacted by particulate matter from a gravel road. One-hour average concentrations calculated from data collected at the remainder of the sites were compared to one-hour Alberta Ambient Air Quality Objectives (AAAQO) and are discussed in the result and discussion section. With the exception of F,, and H, an attempt was made to monitor downwind of the blowout site. These sites are described in Table 1. Site was upwind from the CNRL blowout site, and consequently this site is used as the background (reference) site 1. Locations F and H were located within nearby communities and chosen to ensure public safety. Also, Site J was sampled as the result of a public complaint, and factors other than the well blowout were affecting the air quality at that site, so it is not included in the report. 1 See Wind Rose 1, 2, 3, and 4. 3
4 Table 1: Description of monitoring locations Site Description A CNRL battery, LSD = west of 6 th B Incident Command Centre, on Lousy Road and Township Road 754 C two locations along Twp Rd 750 near Security ate #2 3 km north of Highway 59 on Range Road 115A E slightly further NW of incident command centre F Horse Lake First Nation band office parking lot 3 immediately east of Hythe school, on township road 733 H Town of La lace, east of school I Spring Lake campground parking lot J 2 near lover residence, public complaint, Range Rd 123 and Highway 43 K Valhalla Centre L 2 on highway 59 1 km east of range road 120 D 2 M 2 roving up and down Spring Lake road, north of township road 750 O Origin of the plume: the well blowout site 2 Data collected at these sites were not used in this report. 3 Site is to be considered a background site. 4
5 Figure 1: MAML monitoring location descriptions of the indicated sites are given in Table 1. Note that Site O is the location of the well blowout 5
6 3. Results and Discussion At most locations, monitoring was conducted for more than one hour, and all sites included in this discussion have at least one full hour of data. In discussing the results, the median one-hour average and the maximum one-hour average concentrations are presented. The median concentration is a common way of representing the central value for environmental data. Fifty percent of the one-hour averages at a location are below the median one-hour average concentration and fifty percent are above. Further justification for using the median concentration is presented in Appendix D. The median and maximum one-hour averages illustrate the mid as well as the highest one-hour concentrations measured at a location. These concentrations were compared to established Alberta Ambient Air Quality Objectives and uidelines (AAAQO and AAAQ). The key in Figure 2 illustrates how the median and maximum one-hour average concentrations are represented in the following section. 6
7 Figure 2: A key for interpreting the figures in the following section 7
8 3.1. Total Reduced Sulphur (TRS) Including Hydrogen Sulphide (H 2 S) Total reduced sulphur includes hydrogen sulphide (H 2 S), mercaptans, dimethyl sulphide, and other sulphur compounds. Total reduced sulphur does not include sulphur dioxide, this pollutant will be discussed in a separate section. Anthropogenic sources of H 2 S and TRS are fugitive emissions from sour natural gas wells as well as a number of industrial processes. Natural sources of H 2 S include sulphur hot springs, sloughs, swamps and lakes. The median one-hour TRS concentrations ranged from below detection limit at Site C to ppm at Site E (Figure 3). The highest TRS concentrations were measured at Site E, located northeast of the well blowout with the median and maximum one-hour averages both ppm. However, at the time of monitoring it was not located downwind of the well blowout. 4 The median one-hour average H 2 S concentrations at many of the monitoring locations were below detection limit (Figure 4). However, there were measurable one-hour concentrations. The maximum one-hour average concentrations ranged from below detection at most sites 5 to ppm. The highest one-hour average H 2 S concentration of ppm was measured at both sites where H 2 S was above detection limits (Sites and H). All measured concentrations at all sites were lower than the one-hour AAAQO for H 2 S of ppm. At Site E, where the highest TRS concentrations occurred, the one-hour average H 2 S concentration was below the detection limit. At Sites and H, most of the detected TRS was from H 2 S. The results indicate that at the other sites there were significant contributions from other reduced sulphur compounds (other than H 2 S) to TRS concentrations. Measured TRS and H 2 S concentrations at these sites were comparable to the maximum one-hour concentrations recorded at the background Site. 4 See the Wind Rose 5 in Appendix B. 5 H 2 S was only detected at Sites and H. 8
9 TRS Concentration (ppm) A (4) B (6) C (2) E (7) F (1) (18) H (3) I (1) K (3) Site Number Figure 3: Median and maximum one-hour average concentrations for TRS AAAQO H 2 S Concentation (ppm) A (4) B (6) C (2) E (7) F (1) (18) H (3) I (1) K (3) Site Number Figure 4: Median and maximum one-hour average concentrations for H 2 S. 9
10 Sulphur Dioxide (SO 2 ) In Alberta, upstream oil and gas processes are responsible for close to half of the sulphur dioxide (SO 2 ) emissions in the province. Oil sands facilities and power plants are also major sources of SO 2. Other sources include gas plants, flares, oil refineries, pulp and paper mills and fertilizer plants. One hour average median SO 2 concentrations ranged from below detection to ppm. The highest median SO 2 concentration was measured at Site E. This was comparable to the maximum SO 2 value recorded at Sites H and K, as well as at the background Site (Figure 5). These concentrations did not exceed the one-hour AAAQO of ppm (Figure 6). 10
11 SO 2 Concentation (ppm) A (4) B (6) C (2) E (7) F (1) (18) H (3) I (1) K (3) Site Number Figure 5: Median and maximum one-hour average SO 2 concentrations. 0.2 AAAQO 0.15 SO 2 Concentation (ppm) A (4) B (6) C (2) E (7) F (1) (18) H (3) I (1) K (3) Site Number Figure 6: Median and maximum one-hour average SO 2 concentrations in comparison to the AAAQO. 11
12 Particulate Matter (PM 10, PM 2.5, and PM 1. ) Inhalable particulates are particulate matter less than 10 micrometers in aerodynamic diameter (PM 10 ) that can be inhaled into the nose and throat. Sources of PM 10 include soil dust, road dust, agricultural dust (e.g., harvest), smoke from forest fires and wood burning, vehicle exhaust and industrial emissions. Respirable particulates are particulate matter less than 2.5 micrometers (PM 2.5 and PM 1 ) in aerodynamic diameter. PM 2.5 and PM 1 are small enough to penetrate into the lungs. Respirable particulates may form in the atmosphere and/or arise from combustion sources such as vehicle exhaust emissions, industrial emissions and wood burning. Median one-hour PM 10 concentration ranged from 0.3 μg/m 3 to 52.4 μg/m 3. The median one-hour PM 2.5 concentrations ranged from 0.2 μg/m 3 to 37.3 μg/m 3. The median one-hour PM 1 concentrations ranged from 0.2 μg/m 3 to 33.2 μg/m 3. All minimum values were measured at Site B, and all maximum values were measured at Site K. All measured values of PM 10, PM 2.5, and PM 1 are comparable to the background values measured at Site or lower. It is significant to note that higher values for PM 10, PM 2.5, and PM 1 were recorded at Site J. Site J was monitored as a result of a public complaint, relating to smoke in the area as a result of waste being burned on a neighboring property. The measured values for PM 2.5 were all well below the AAAQ, which is a value of 80 μg/m 3, even at Site J. Although the data for Site J is not included in Figures 7, 8, or 9, it is included in the raw data located in Appendix C. 12
13 PM 10 Concentration (μgr/m3) A (4) B (6) C (2) E (7) F (1) (18) H (3) I (1) K (3) Site Number Figure 7: Median and maximum one-hour average PM 10 concentrations PM 2.5 Concentration (μgr/m3) AAAQ A (4) B (6) C (2) E (7) F (1) (18) H (3) I (1) K (3) Site Number Figure 8: Median and maximum one-hour average PM 2.5 concentrations 13
14 PM 1 Concentration (μgr/m3) A (4) B (6) C (2) E (7) F (1) (18) H (3) I (1) K (3) Site Number Figure 9: Median and maximum one-hour average PM 1 concentrations 14
15 Appendix A 15
16 Table A1: February: Operator s comment and meteorological conditions measured at monitoring locations Date Start/End Times Site Location Comments Temp RH WSP WDR 25-Feb-10 07:55 to 08:55 A CNRL battery Feb-10 08:55 to 09:55 A CNRL battery Feb-10 09:55 to 10:55 A CNRL battery Feb-10 10:55 to 11:55 A CNRL battery Feb-10 12:33 to 13:33 B command centre Feb-10 13:33 to 14:33 B command centre Feb-10 14:33 to 15:33 B command centre Feb-10 15:33 to 16:33 B command centre Feb-10 16:33 to 17:33 B command centre Feb-10 17:33 to 18:26 B command centre Feb-10 08:27 to 09:27 E NW of command centre Feb-10 09:27 to 10:27 E NW of command centre Feb-10 10:27 to 11:27 E NW of command centre Feb-10 11:27 to 12:27 E NW of command centre Feb-10 12:27 to 13:27 E NW of command centre Feb-10 13:27 to 14:27 E NW of command centre Feb-10 14:27 to 15:27 E NW of command centre Feb-10 17:14 to 18:21 F Horse Lake band office Feb-10 18:44 to 19:45 east of Hythe school Feb-10 07:29 to 08:29 east of Hythe school Feb-10 08:29 to 09:29 east of Hythe school Feb-10 09:29 to 10:29 east of Hythe school Feb-10 10:29 to 11:29 east of Hythe school Feb-10 12:23 to 13:23 east of Hythe school Passing traffic Feb-10 13:23 to 14:23 east of Hythe school Feb-10 14:23 to 15:23 east of Hythe school Feb-10 15:23 to 16:23 east of Hythe school Feb-10 07:50 to 08:50 east of Hythe school Feb-10 08:50 to 09:50 east of Hythe school Feb-10 09:50 to 10:50 east of Hythe school Feb-10 12:50 to 13:50 east of Hythe school Feb-10 13:50 to 14:50 east of Hythe school
17 Table A1: February: Operator s comment and meteorological conditions measured at monitoring locations Date Start/End Times Site Location Comments Temp RH WSP WDR 1-Mar-10 07:20 to 08:20 east of Hythe school Mar-10 08:20 to 09:20 east of Hythe school Mar-10 10:34 to 11:34 H La lace, east of school Mar-10 11:34 to 12:34 H La lace, east of school Mar-10 12:34 to 13:34 H La lace, east of school Mar-10 15:14 to 16:14 K Valhalla Centre Mar-10 17:31 to 18:31 I Spring Lake campground parking lot Mar-10 13:37 to 14:37 J extremely smoky, lover residence public burning waste wood in complaint nearby field Mar-10 15:55 to 16:55 K Valhalla Centre Mar-10 14:19 to 15:19 C 9-Mar-10 15:19 to 16:19 C Twp Rd 750 near Security ate #2 Twp Rd 750 near Security ate # ND ND Notes: Temp - Temperature in degrees centigrade WSP Wind speed in Km/hr RH Relative humidity in percentage WDR Wind direction in degrees 17
18 Table A2: Median one-hour average concentrations at monitoring locations. Site (# of Samples) SO 2 (ppm) TRS (ppm) H 2 S (ppm) PM 10 (μg/m 3 ) PM 2.5 (μg/m 3 ) PM 1 (μg/m 3 ) A (4) bdl B (6) bdl bdl C (2) bdl bdl D (0) n/a n/a n/a n/a n/a n/a E (7) bdl F (1) bdl bdl (18) bdl H (3) I (1) bdl J (1) bdl K (3) bdl L (0) n/a n/a n/a n/a n/a n/a Table A3: Maximum one-hour average concentrations at monitoring locations. Site (# of Samples) SO 2 (ppm) TRS (ppm) H 2 S (ppm) PM 10 (μg/m 3 ) PM 2.5 (μg/m 3 ) PM 1 (μg/m 3 ) A (4) bdl bdl B (6) bdl bdl C (2) bdl bdl bdl D (0) n/a n/a n/a n/a n/a n/a E (7) bdl bdl F (1) bdl bdl (18) H (3) I (1) bdl bdl bdl J (1) bdl bdl bdl K (3) bdl bdl bdl L (0) n/a n/a n/a n/a n/a n/a Notes: bdl below detection limit μg/m 3 = micrograms per cubic meter ppm - parts per million n/a Parameter not monitored or data not available. 18
19 Appendix B 19


20 Wind Rose 1: 0 indicates north, 90 east, 180 south and 270 west. Wind Rose 2: 0 indicates north, 90 east, 180 south and 270 west. 20


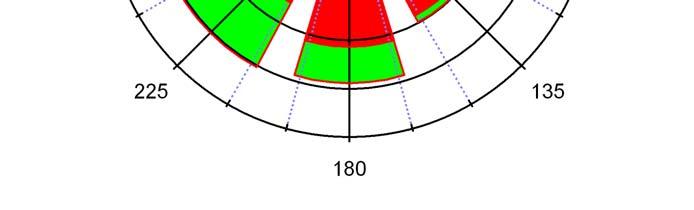
21 Wind Rose 3: 0 indicates north, 90 east, 180 south and 270 west. Wind Rose 4: 0 indicates north, 90 east, 180 south and 270 west. 21
22 Wind Rose 5: 0 indicates north, 90 east, 180 south and 270 west. 22
23 Appendix C All One-hour Averaged Data 23
24 Date 25-Feb Feb Feb Feb Feb Feb Feb Feb Feb Feb Feb-10 9-Mar-10 9-Mar-10 9-Mar Feb Feb Feb Feb-10 Site A A A A A B B B B B B C C D E E E E Start/End Times SO2 TRS H2S Temp (DE C) RH (%) WSP (KPH) WDR (DE) PM 10 (μg/m 3 ) PM 2.5 (μg/m 3 ) PM 1 (μg/m 3 ) THC CH4 RHC 07:55 to 08: ND ND ND 08:55 to 09: ND ND ND 09:55 to 10: ND ND ND 10:55 to 11: ND ND ND 11:55 to 12:00 <0.002 <0.001 <0.000 <5.2 <59.5 <12.6 <212 <1.1 <1.1 <1.1 ND ND ND 12:33 to 13: ND ND ND 13:33 to 14: ND ND ND 14:33 to 15: ND ND ND 15:33 to 16: ND ND ND 16:33 to 17: ND ND ND 17:33 to 18: ND ND ND 14:19 to 15: ND :19 to 16: ND :26 to 16:49 <0.001 ND <0.000 <0.2 <31.7 <5.0 <194 <12.6 <6.7 <5.3 <1.7 <1.7 <0.0 08:27 to 09: ND ND ND 09:27 to 10: ND ND ND 10:27 to 11: ND ND ND 11:27 to 12: ND ND ND 24
25 Date 26-Feb Feb Feb Feb Feb Feb Feb Feb Feb Feb Feb Feb Feb Feb Feb Feb Feb Feb-10 Site E E E E F Start/End Times SO2 TRS H2S Temp (DE C) RH (%) WSP (KPH) WDR (DE) PM 10 (μg/m 3 ) PM 2.5 (μg/m 3 ) PM 1 (μg/m 3 ) THC CH4 RHC 12:27 to 13: ND ND ND 13:27 to 14: ND ND ND 14:27 to 15: ND ND ND 15:27 to 16: ND ND ND 17:14 to 18: ND ND ND 18:44 to 19: ND ND ND 07:29 to 08: ND ND ND 08:29 to 09: ND ND ND 09:29 to 10: ND ND ND 10:29 to 11: ND ND ND 11:29 to 11:50 <0.000 <0.001 <0.000 <0.0 <81.3 <6.7 <327 <12.1 <9.9 <9.0 ND ND ND 12:23 to :23 ND ND ND 13:23 to 14: ND ND ND 14:23 to 15: ND ND ND 15:23 to 16: ND ND ND 16:23 to 17: ND ND ND 07:50 to 08: ND ND ND ND ND ND 08:50 to 09: ND ND ND 25
26 Date 28-Feb Feb Feb Feb-10 1-Mar-10 1-Mar-10 1-Mar-10 1-Mar-10 1-Mar-10 1-Mar-10 1-Mar-10 2-Mar-10 2-Mar-10 1-Mar-10 2-Mar-10 2-Mar-10 9-Mar-10 8-Mar-10 Site H H H I J J K K K L M Start/End Times SO2 TRS H2S Temp (DE C) RH (%) WSP (KPH) WDR (DE) PM 10 (μg/m 3 ) PM 2.5 (μg/m 3 ) PM 1 (μg/m 3 ) THC CH4 RHC 09:50 to 10: ND ND ND 12:50 to 13: ND ND ND 13:50 to 14: ND ND ND 14:50 to 15:00 <0.001 <0.001 <0.000 <0.1 <91.4 <8.6 <59 <17.4 <16.9 <16.2 ND ND ND 07:20 to 08: ND ND ND 08:20 to 09: ND ND ND 09:20 to 09:33 <0.002 <0.002 <0.002 <-6.4 <92.2 <3.3 <125 <63.1 <48.1 <42.6 ND ND ND 10:34 to 11: ND ND ND 11:34 to 12: ND ND ND 12:34 to 13: ND ND ND 17:31 to 18: ND ND ND 13:37 to 14: ND ND ND 14:37 to 14:54 <0.001 <0.000 <0.000 <10.1 <45.1 <3.2 <280 <67.7 <32.0 <24.4 ND ND ND 15:14 to 16: ND ND ND 15:55 to 16: ND ND ND 16:55 to 17: ND ND ND 16:55 to 17: ND :29 to 12: ND
27 Date 8-Mar-10 8-Mar-10 8-Mar-10 8-Mar-10 8-Mar-10 8-Mar-10 Site M M M M M M Start/End Times 12:28 to 13:28 13:28 to 14:28 14:28 to 15:28 15:28 to 16:28 16:28 to 16:49 16:49 to 17:55 SO2 TRS H2S Temp (DE C) RH (%) WSP (KPH) WDR (DE) PM 10 (μg/m 3 ) PM 2.5 (μg/m 3 ) PM 1 (μg/m 3 ) THC CH ND ND ND ND ND ND <0.000 ND <0.000 <1.4 <29.5 <12.6 <178 <57.2 <11.9 <1.6 <1.7 <1.7 < ND RHC Notes: Temp (DE C) - Temperature in degrees centigrade RH (%) Relative humidity in percentage WSP (KPH) Wind speed in kilometers per hour WDR (DE) Wind direction in degrees ND no data < - Less than 30 minutes of data is use to calculate an average PPM parts per million μg/m 3 micro grams per cubic meter 27
28 Intentionally Blank 28
29 Appendix D 29
30 The median concentration The median concentration is a common way of representing the central value for environmental data. Most environmental data usually consist of a distribution that is skewed to the right; that is most data values are low and only a few are high. For such data sets, the arithmetic mean will be biased by the high concentrations; the resulting value may not be representative of the central value for the data set. For example, a data distribution consisting of five numbers: 1, 2, 2, 3 and 10. The arithmetic mean of these data is 3.6 and the median is 2. In this case, the arithmetic mean is biased high by the extreme value of 10. The median is the middlemost value in the data set; thus more representative of the central value of the data distribution. Fifty percent of the values in the dataset are below the median and fifty percent are above. Alberta s Ambient Air Quality Objectives Alberta s Ambient Air Quality Objectives 1 are established under Section 14 of the Environmental Protection and Enhancement Act (EPEA R.S.A. 2000, c.e-12, as amended). EPEA provides for the development of environmental objectives for Alberta. The Ambient Air Quality Objectives are used for: Reporting on the state of the atmospheric environment in Alberta. Reporting to Albertans on the quality of the air through Alberta s Air Quality Index (AQI). Establishing approval conditions for regulated industrial facilities. Evaluating proposals to construct facilities that will have air emissions. uiding special ambient air quality surveys. Assessing compliance near major industrial air emission sources. Some of Alberta s Ambient Air Quality Objectives are based on odour perception. This is the case for ammonia, nitrogen dioxide and hydrogen sulphide. For these chemicals, people are likely to detect an odour at concentrations well below levels that may affect human health. Alberta s Ambient Air Quality Objectives for one-hour average concentration of pollutants monitored by the MAML are listed in Table A5. TableA5: Pollutant Alberta s Ambient Air Quality Objective measured by the MAML One-hour AAAQO Basis for Objective (ppm*) Ammonia 2 odour perception Carbon monoxide 13 oxygen carrying capacity of blood Nitrogen dioxide odour perception Ozone reduction of lung function and effects on vegetation Hydrogen sulphide 0.01 odour perception Sulphur dioxide pulmonary function ppm- parts per billion 30
 vehicle that has been specially designed and equipped to measure air quality. It houses a variety of instruments that continuously sample the air at specified time or distance intervals.")
31 1 Alberta Ambient Air Quality Objectives. Alberta Environment. April The Mobile Air Monitoring Laboratory (MAML) The MAML is a 27-foot (8.2 m) vehicle that has been specially designed and equipped to measure air quality. It houses a variety of instruments that continuously sample the air at specified time or distance intervals. The MAML is equipped with: a dual computer system custom-programmed to accept and record the measurement of air samples from each analyser, a PS (lobal Positioning System) that identifies the MAML's location as it moves around Alberta, an exhaust purifying system that minimizes emissions from the vehicle and two on-board generators that are also equipped with exhaust scrubbers Table A6 lists the pollutants and meteorological data monitored by the MAML. Also indicated are the lower and upper detection limits for each monitored species. Figure A1: Alberta Environment s Mobile Air Monitoring Laboratory 31
32 Table A6: Pollutants and meteorological data monitoring by the MAML. Pollutant Operating Range Lower Detection Limit* Upper Detection Limit** Ammonia (NH 3 ) ppm 5 ppm Ozone (O 3 ) ppm 0.5 ppm Carbon Monoxide (CO) 0.1 ppm 50 ppm Hydrocarbons Methane (CH 4 ) 0.1 ppm 20 ppm Reactive Hydrocarbons (RHC) 0.1 ppm 20 ppm Total Hydrocarbons (THC) 0.1 ppm 20 ppm Polycyclic Aromatic Hydrocarbons 3 ng/m ng/m 3 (PAH) Oxides of nitrogen Nitrogen dioxide (NO 2 ) ppm 1 ppm Nitric Oxide (NO) ppm 1 ppm Oxides of nitrogen (NO x ) ppm 1 ppm Particulate Matter Particulate Matter <1μm (PM 1 ) 1 μg/m g/m 3 Particulate Matter <2.5μm (PM 2.5 ) 1 μg/m g/m 3 Particulate Matter <10μm (PM 10 ) 1 μg/m g/m 3 Sulphur Compounds Hydrogen Sulphide (H 2 S) ppm 1 ppm Total Reduced Sulphur (TRS) ppm 1 ppm Sulphur Dioxide (SO 2 ) ppm 2 ppm Meteorological data Wind Speed 0 km/hr 200 km/hr Wind Direction 0 degrees 360 degrees Temperature -40 C 50 C Relative humidity 0% 100% ppm - parts per million μg/m 3 = micrograms per cubic meter ng/m 3 = nanograms per cubic meter g/m 3 = grams per cubic meter * The lower detection limit indicates the minimum amount of pollutant and the lower limit of meteorological data can be measured by the instrument. ** The upper detection limit indicates the maximum amount of pollutant the instrument can detect and the upper limit for meteorological data measured. This limit is set to provide the optimum precision over that range. The upper limit can be raised, however, precision at the lower levels (where most levels are monitored) is then compromised. 32