What controls dissolved oxygen in Lower South Bay? Lissa MacVean, Rusty Holleman, Zephyr Sylvester, Dave Senn
|
|
|
- Jonathan King
- 5 years ago
- Views:
Transcription


1 What controls dissolved oxygen in Lower South Bay? Lissa MacVean, Rusty Holleman, Zephyr Sylvester, Dave Senn 2017


2 Why should we investigate DO in the Bay? In other systems, nutrient-enrichment has led to low DO conditions: an indication of ecological decline. Long Island Sound? Chesapeake Bay

3 Observing a unique system Urbanized watersheds Waste water inputs High sediment loads Strong tidal mixing Diverse habitats

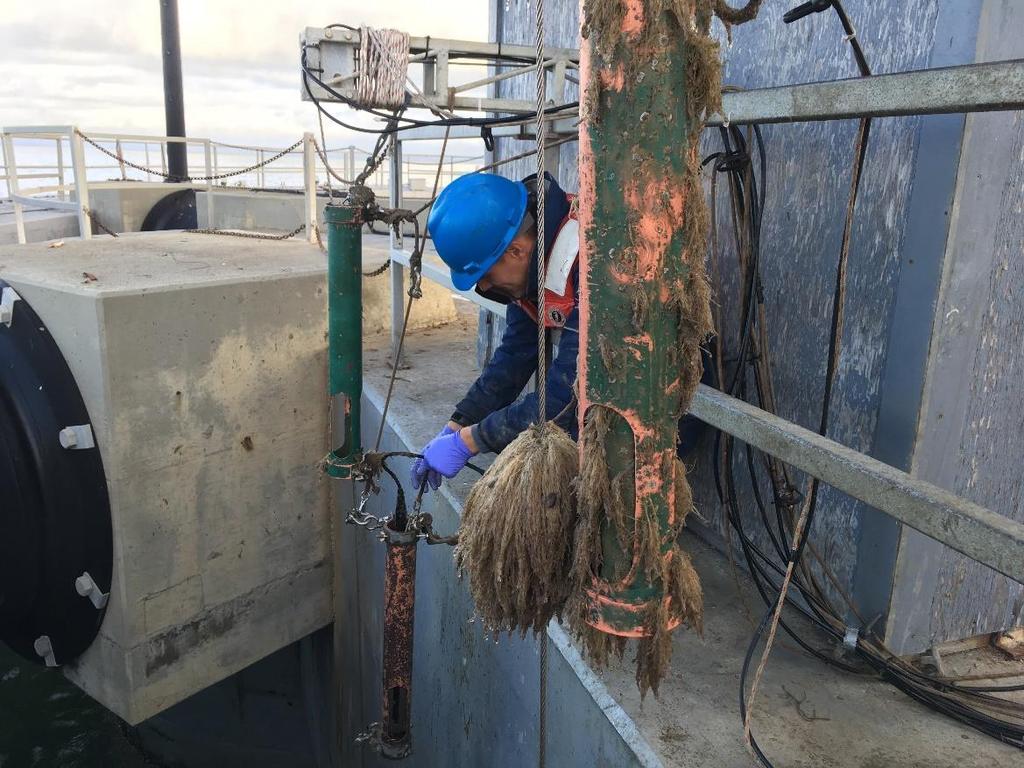
4 Observing: not as passive as it sounds! Photo: Shira Bezalel

5 Very interdisciplinary Minerals, organics Biology

6 Requires a unique skillset
7
8
9 DO variability in space: Bay vs Sloughs Dumbarton Newark Slough Mowry Slough Coyote Creek 10 mg/l 3 mg/l DO concentration: Interquartile range shown in dark blue Guadalupe Slough Alviso Slough Pond A8
10 Can we go beyond condition to underlying mechanisms?
11 Framework: a 1-D transport and reaction equation Unsteadiness Advection Dispersion Everything else! C = DO concentration [mg/l] u = velocity [m/s] D = dispersion coefficient [m 2 /s] H = water depth [m] B = DO consumption rate [g O 2 m -2 day -1 ] Reaeration Advection, dispersion + Photosynthesis - Respiration Benthic Respiration Advection, dispersion
12 Framework: a 1-D transport and reaction equation Condition Physical processes Everything else! Reaeration Advection, dispersion + Photosynthesis - Respiration Benthic Respiration Advection, dispersion
 37 (Suppl 1):S91 S110 a high tide b low tide va (F di th in an")
13 Parsing physical from biogeochemical: notoriously difficult Estuaries and Coasts (2014) 37 (Suppl 1):S91 S110 DOI /s Fortnightly Tidal Modulations Affect Net Community Production in a Mesotidal Estuary Estuaries and Coasts (2014) 37 (Suppl 1):S91 S110 a high tide b low tide va (F di th in an an T by oc in w sp (a si br tid du Nicholas J. Nidzieko Joseph A. Needoba Stephen G. Monismith Kenneth S. Johnson c low tide, sill installed tripod ro cr tid Received: 23 October 2012 / Revised: 20 December 2013 / Accepted: 29 December 2013 / Published online: 15 March 2014 Coastal and Estuarine Research Federation 2014 Abstract Optical in situ chemical sensors enable sampling intervals and durations that rival acoustic techniques used for measuring currents. Coupling these high-frequency biogeochemical and physical measurements in estuaries to address ecosystem-scale questions, however, is still comparatively novel. This study investigated how tides affect metabolism was net heterotrophic during spring tides and generally in balance during neap tides because Fig. 2 spring-tide Tidal creek study site at a High tide and b Low tide. c marsh inundation was limited to nighttime, Following and therefore installation the of sharp crested sill marsh could not contribute any primary production to the water column. At the estuary scale, the fortnightly export of oxygen from the main channel to the intertidal was largely sa (F na at be sa de ox le ge fo
14 We developed a method to remove transport from the data Physical processes Everything else! Reaeration Net DO flux Advection, dispersion + Photosynthesis - Respiration Benthic Respiration >0: net production <0: net respiration
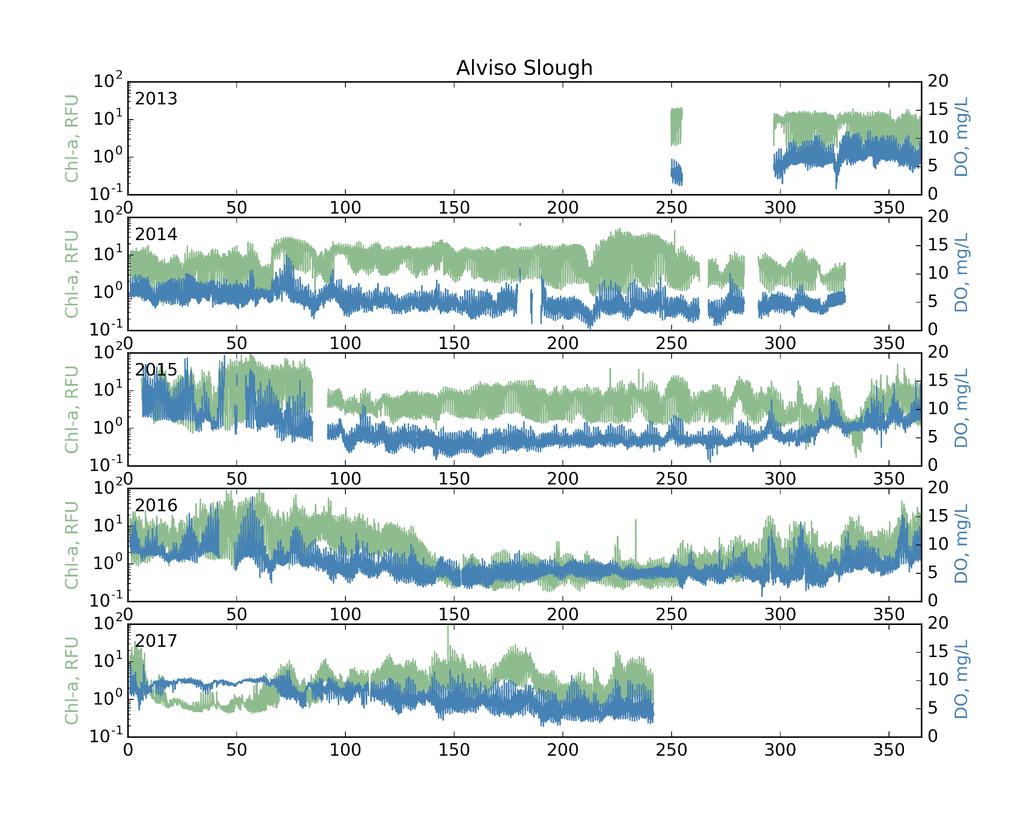
15 DO flux time-series 75 th percentile Monthly median value 25 th percentile Daily averages Alviso Slough

16 DO flux time-series Decline in daily-averaged DO concentration reflects increased consumption rates DO consumption is calculated using measurements 10 to 60 minutes apart The DO consumption flux is associated with large drops in DO

17 Spatial variations in net DO flux Dumbarton Newark Slough Mowry Slough Coyote Creek 4 g O 2 m -2 day g O 2 m -2 day -1 DO flux: Interquartile range shown in dark red; white line is 0 Guadalupe Slough Alviso Slough Pond A8 4 g O 2 m -2 day g O 2 m -2 day -1 Typical estuarine respiration
18 What does this mean for net metabolism? Net metabolism = net DO flux reaeration Reaeration estimated at the Alviso Slough station, where we have water properties, wind, and flow velocity Net DO flux: ~ -10 to -5 g O 2 m -2 day -1 Reaeration: ~ +0 to 2 g O 2 m -2 day -1 Net metabolism: ~ -12 to -5 g O 2 m -2 day -1 Respiration dominates at this location, implying external O 2 drawdown. Net DO flux: -10 to -5 Reaeration: + 0 to 2 Net metabolism: -12 to -5 + Photosynthesis - Respiration Benthic Respiration
19 Alviso complex: respiration dominated 1) An external source of oxygen Newark demand: Slough Organic material exported from managed Dumbarton pond A8? 2) Enhanced efficiency of respiration through stratification? Mowry Slough Coyote Creek 4 g O 2 m -2 day g O 2 m -2 day -1 DO flux: Interquartile range shown in dark red; white line is 0 Guadalupe Slough Alviso Slough Pond A8 4 g O 2 m -2 day g O 2 m -2 day -1 Typical estuarine respiration
20 Alviso complex: not chronically low in DO Dumbarton Newark Slough Mowry Slough Some of the oxygen demand is met by DO-enriched A8 effluent. 10 mg/l 3 mg/l 4 g O 2 m -2 day g O 2 m -2 day -1 4 g O 2 m -2 day g O 2 m -2 day -1 DO concentration: Interquartile range shown in dark blue DO flux: Interquartile range shown in dark red; white line is 0 Typical estuarine respiration Coyote Creek Guadalupe Slough Alviso Slough Both DO consumption and supply are important! Pond A8
21 The influence of managed ponds Ponds are incubators of phytoplankton DO-enriched water and organic material are discharged to slough network High supply of DO, high demand for DO DO, organics What are implications for management?

22 Mooring network helps us understand DO condition and driving mechanisms (physical, biogeochemical) We ve developed an efficient way of estimating net metabolism The margins consume DO, but also supply it Where does that leave managers? Next steps: explore effects of A8 management in the data; physical-biogeochemical interactions in sloughs

23 We gratefully acknowledge funding from the NMS and RMP