NCTCOG Western Area Waste Regional Workshop MICHAEL CARLETON ARREDONDO, ZEPEDA & BRUNZ LLC & NORTH CENTRAL TEXAS COUNCIL OF GOVERNMENTS
|
|
|
- Opal Patterson
- 5 years ago
- Views:
Transcription
1 NCTCOG Western Area Waste Regional Workshop MICHAEL CARLETON ARREDONDO, ZEPEDA & BRUNZ LLC & NORTH CENTRAL TEXAS COUNCIL OF GOVERNMENTS
2 Introduction Michael Carleton Project Manager with Arredondo, Zepeda & Brunz LLC 35 years experience in energy and environmental programs 3600 acres of Landfill Site Selections for BVSWMA, Corpus Christi, Lubbock and TASWA Permitting Experience for Laredo, BVSWMA, Arlington and 12 landfills/transfer stations Solid Waste Management Plans including Fort Worth, Arlington, Burleson and NCTCOG Energy from Waste Experience AZ&B is a 36 year old Dallas / Fort Worth based planning, engineering and surveying firm Recently presented to NCTCOG an assessment of regional disposal capacity and benchmarking analysis of waste disposal comparisons
3 Purpose Waste management issues in western NCTCOG Region including forecasted waste generation & disposal Requirements for new capacity and transfer options Regional opportunities for solving problems Future discussion of needs, options and solutions Source reduction, recycling, organics management, etc. In 2016, the NCTCOG region has 35 years disposal capacity. Western region capacity is projected to be 25 to 30 years. The estimated time to gain new capacity 10 to 15 years.

4 The Region Wise Tarrant Parker Palo Pinto Erath Hood Somervell Johnson Close to the size of Connecticut 3.95 million acres
5 Population Characteristics & Forecast Population Counties % increase Erath 37,890 50, % Hood 35,089 41, % Johnson 150, , % Palo Pinto 15,216 17, % Parker 116, , % Somervell 8,490 11, % Tarrant 1,809,034 2,579, % Wise 59, , % Total 2,232,707 3,295, % Cities Population % of Total Fort Worth 815,430 63% Arlington 382,230 30% Cleburne 29,780 2% Glen Rose 2,490 0% Weatherford 27,660 2% Stephenville 21,950 2% Granbury 9,310 1% Total 1,288, % Cities % of County 52% Western area of NCTCOG would be #36 in order of population among 50 states

6 New challenges in unincorporated areas New trend of large subdivisions built in unincorporated areas poses a new solid waste management issue for communities


7 Growth Projections

8 Land Use Forecast Residential Development Pattern, Land Area County Total Acres Vacant Acres % Vacant Erath 697, ,966 91% Hood 279, ,742 74% Johnson 469, ,873 73% Pal Pinto 630, ,836 78% Parker 582, ,532 51% Somervell 122,805 69,588 57% Tarrant 577, ,039 27% Wise 590, ,424 58% Total 3,950,210 2,543,000 64% Continued increases in population and development will make selecting sites increasingly complex & controversial
9 Projected Waste Disposal Current disposal rate per capita County Change in Annual Tons 2010 tpd 2040 tpd Change in Daily NCTCOG HGAC AACOG CAPCOG Erath 43,287 68,646 25, Hood 40,087 56,480 16, Johnson 172, , , Palo Pinto 17,384 23,795 6, Parker 133, , , Somervell 9,699 15,347 5, Tarrant 2,066,731 3,474,271 1,407,540 5,662 9,519 3,856 Wise 67, ,053 81, Total 2,550,756 4,438,543 1,887,787 6,988 12,160 5,172 Pounds / Capita / Day
10 Benefits of waste reduction County Change in Annual Tons 2010 tpd 2040 tpd Change in Daily Erath 43,287 58,228 14, Hood 40,087 47,909 7, Johnson 172, ,661 88, Palo Pinto 17,384 20,184 2, Parker 133, , , Somervell 9,699 13,018 3, Tarrant 2,066,731 2,947, ,279 5,662 8,074 2,412 Wise 67, ,433 58, Total 2,550,756 3,764,943 1,214,187 6,988 10,315 3,327 Pounds / Capita / Day


11 TONS / YEAR Projected 2040 Waste Disposal 5,000,000 4,500,000 4,000,000 4,438,543 State of Iowa generates a total of 2.8 million tons per year. 3,500,000 3,764,943 3,000,000 2,500,000 2,000,000 2,550,756 2,550,756 Between estimated total disposal 74 to 83 million tons of MSW. 1,500,000 1,000, ,000 Total CURRENT disposal capacity in Western Area is 63 million tons - Low High Low assumes waste generation rate of 6.96 pcd (2010 rate) High assumes waste generation rate of 7.38 pcd (2016 rate)

12 Transportation Network Limited number of major highways, majority of which are east / west roadways Why its important Access to facilities is critical site selection issue Cost of hauling materials & waste impacted by quality of roadways Congestion may result in more trucks needed to haul waste
13 What is your biggest interest? Issue Illegal dumping Residential Collection Service Commercial Collection Service Available Disposal Capacity Tires Residential Recycling Landfill Sites Household Hazardous Waste Transfer Stations Litter Cost of Collection Small Hauling Firms Other Issue Waste-to-energy Disaster Debris Management Public Information Citizen Convenience Stations Composting Brush Management Contracts for Collection Contracts for Disposal Public Opposition Cost of Disposal Food Waste Unincorporated areas Other
14 Comprehensive solid waste management Reduce Minimize the amount of waste produced Reuse Use the material more than once Recycle / Compost Recover materials for new products Recover Recover energy or metals from waste Disposal Properly dispose of waste

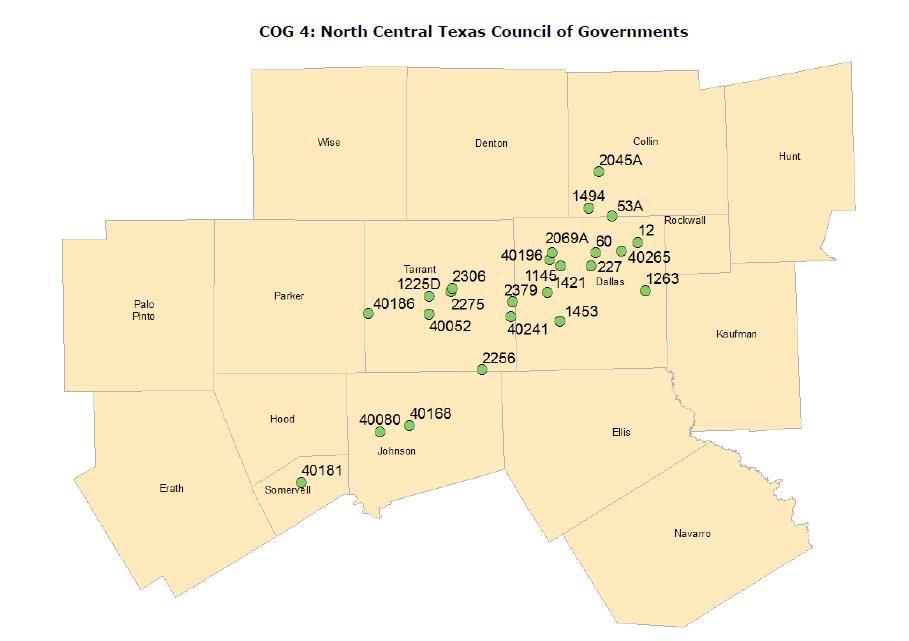
15 2016 Landfill Location Map

16 30 mile radius to operating regional Type I landfills
17 2030 Projected Years of Type I MSW Capacity NCTCOG Type I Regional Capacity 2030 Region IESI Turkey Creek Landfill Waste Management Skyline Landfill Republic Maloy Landfill IESI Weatherford Landfill Ellis County Landfill DFW Recycling and Disposal Facility CSC Disposal and Landfill City of Dallas McCommas Bluff Landfill Hunter Ferrell Landfill Charles M Hinton Jr Regional Landfill City of Grand Prairie Landfill City of Fort Worth South East Landfill City of Denton Landfill City of Corsicana Landfill City of Cleburne Landfill Camelot Landfill City of Arlington Landfill 121 Regional Disposal Facility Years Remaining Capacity
18 Landfill Capacity Landfill 2016 (000 Tons) 2017 (000 Tons) 2017 (000 CY) 2017 (000 Ton) Years Arlington Landfill ,380 37, Fort Worth SE Landfill ,260 16, Cleburne Landfill IESI Turkey Creek (2017 not available)* 524 na 8,142 6, IESI Weatherford Total 2, , ,630 61, IESI Fort Worth C&D Landfill ,101 3, Stephenville C&D Landfill Total ,923 4, In 2016, the estimated total NCTCOG region disposed of over 10 million tons Estimated regional capacity is 360 million tons Recognize that waste from region is going outside the region
19 New Landfill Capacity Issues Technical Issues Type I & Type IV Site Selection Regulatory Requirements & Permitting Design Configuration Institutional Issues Ownership Flow Control Funding Risk Management NCTCOG Type I Disposal Market Concentration* 38% 62% Public Private *three are publicly owned, but privately operated

20 Site Selection Criteria Regulatory Faults Seismic Impact Unstable Conditions Floodplains Wetlands & Waters of US Airport Zones Other criteria Existing and Future Land use Schools, hospitals, other Access Local land use / zoning Harder to find sites with residential and commercial developments and oil & gas wells
21 Landfill sites are getting bigger Facility Acres Tons/Day BVSWMA 609 1,000 Skyline 666 3,980 Denton Regional 676 3,250 Arlington 774 3,220 McCommas 965 6,900 Lubbock 1, Environmental 1,229 1,500 Corpus Christi 2,200 1,387
22 Permitting Process Application Part I Forms Part II Land use, Transportation, Environmental Conditions, Geology & Groundwater Conditions Part III Site Design, Closure and Postclosure Care, Financial Assurance Part IV Site Operating Plan TCEQ Review Hearing Opportunities PROCESS FOR NEW CAPACITY IS A YEAR TIMEFRAME Site selection 3-5 years Permitting 3-5 years Construction 3-5 years

23 Design Configuration & Regulatory Requirements Buffer Liner Leachate Control Cover Gas Closure & Post-closure care financial responsibility Site Operating Requirements Closure & Post closure requirements
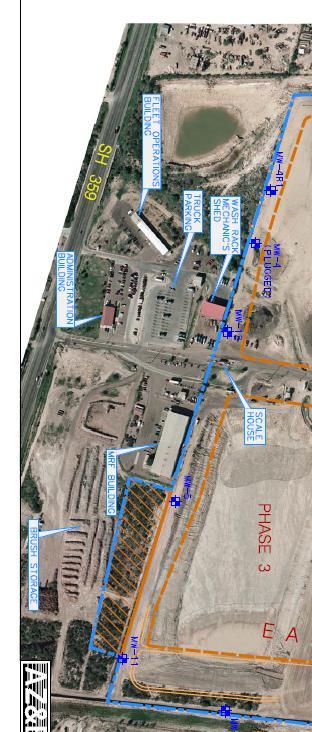
24 Landfill infrastructure


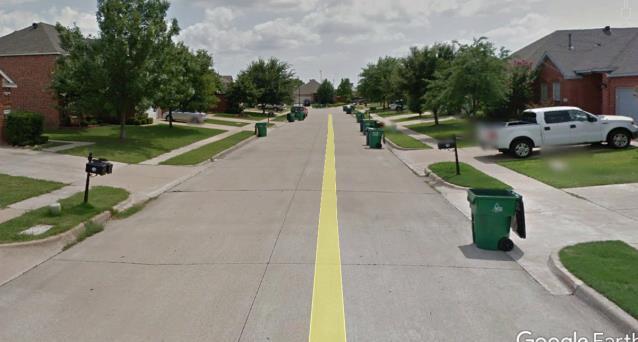
25 How does landfill fit into the community City of Arlington Landfill and Viridian Development


26 City of Garland Hinton Landfill

27 130 Environmental Landfill 1200 acres
28 Cost & Time to Develop Costs to Develop Land - $3000 to $6000 per 1000 acres = $3.0 to $6.0 million Permit - $1.5 $3.0 million Construction - $5 - $10 million Year Land Purchase Permitting Construction Total Capital Costs - $10 - $19 million Current market rates $25 - $40 per ton. Best Case Worst Case
29 Historic Tip Fees
30 Transfer Stations Purpose of transfer sation is to improve transport efficiency moving waste from collection vehicles to larger haul trucks
31

32 Processing Facilities in NCTCOG Approximately 390,000 tons of waste is processed at one of 6 Western Area Region Transfer Stations

33 Costs & Benefits Major cost consideration is the construction and operation of the transfer station.
34 Transfer Station Design Issues Site location (access & compatible land use) Facility sizing Traffic flow Loading configuration Other facilities (recycling, brush management, etc.) Screening


35 Transfer Stations- Design Concepts


36 Transfer Stations Corpus Christi Transfer Station $7 million to construct, 500 tpd, open top trailers, push floor, annual operational expense $3,060,932 includes the 20 year debt service


37 Custer fits into neighborhood that grew into it
38 Regional Collaboration It already exists in some form Public / Private Partnerships Public / Public Partnerships Contracts & Inter-local agreements Solid Waste Management Co-op Municipal Solid Waste Agency Utility District Planning Organization


39 Regionalization is not new
40 IV. Regional Collaboration Pros Efficiencies in facility development & operations Reduced environmental impacts Increased available capital for projects Sufficient waste flow economies of scale Greater flexibility Public Acceptance Cons Loss of control Distances required to get to facilities Public acceptance
41 Key Issues Purpose Controls Who pays Representation Legal authority Major benefits Key risks Waste flow control Role of private sector Status of current contracts Audits & Performance
42 Inter-local Agreements BVSWMA & TASWA Organization & Responsibilities Cost sharing Closure Costs Revenue sharing Reporting Liability Sharing Operations
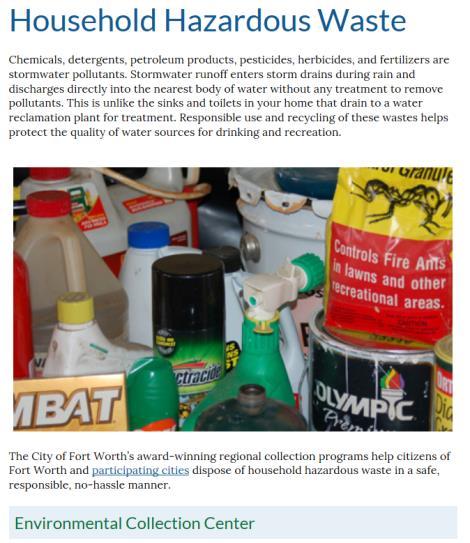
43 BVSWMA & Cities College Station and Bryan Provide Collection Services Recycling is responsibility of cities Composting is responsibility of BVSWMA Landfill is responsibility of BVSWMA HHW is responsibility of BVSWMA Maintenance of previous landfill
44 BVSMWA Inc. Governance Non-profit local government corporation Founded in 2010 by the City of Bryan and City of College Station Seven member Board of Directors City staff provides additional guidance via Technical Advisory Committee Annual third party financial audits
45 BVSWMA Inter-local agreement between College Station & Bryan Services Provided Public Education Composting Household Hazardous Waste Collection Landfill Operations
46 Funding & Organization Financial BVSWMA is financially self sufficient Tipping fees pay for operation Cities have to carry financial assurance for landfill closure Ultimately, Cities have responsibility for BVSWMA financing Organization Board Representation Cities have equal representation Alternating Board Chair Member from Grimes County where the landfill is located Hires a Manager who oversees staff Use College Station s city HR and Accounting staff
47 Municipal Solid Waste Management Cooperative Kaufman County Environmental Co-op Formed in October of 1997, the Environmental Co-op (the Co-op) is the result of an ongoing effort by concerned officials and citizens of Kaufman County to take an active and positive stance on the problem of disposing of household wastes of an increasing population with increased concerns about the environment. The Co-op is a 501c(3), member-owned non-profit environmental business that specializes in setting up waste disposal programs in Kaufman County. With no landfills in the county and diminishing space in nearby landfills, the problem of municipal solid waste is getting more serious every day. The Co-op's primary focus is to provide education on issues such as solid waste reduction, composting, recycling and resource conservation. Our mission is the conservation of natural resources through education and management of all aspects of solid and hazardous waste, recycling, and overuse of resources.
48 Kaufman County Coop success at grants From $1.8 million for 27 different projects
49
50 Utilities NTMWD Provides landfill and transfer station services to cities of McKinney, Plano, Richardson, Frisco and Allen, Collin County and surrounding areas Cities pay for landfill budget based on tonnages disposed at facilities Three Transfer Stations One Landfill
51 General Law Districts
52 Next Steps- It is up to you Continued meetings Establishment of a planning group Establish common goals & objectives Identify path Evaluate collection and disposal contracts in light of capacity
53 Benefits & Risks of Planning Committee Benefits No major investment required Offers opportunity for discussion with peers Understanding of what is happening on regional basis Identify opportunities for joint programs Negatives Possibility for no-action to occur (just meetings and talk) Loss of control over future Decision making process may result in unwanted results
54 Thanks Michael Carleton Project Manager Arredondo, Zepeda & Brunz LLC McCree Dallas 2001 Beach Street Fort Worth Tamara Cook, AICP Senior Program Manager North Central Texas Council of Governments Department of Environment and Development (817)