Hydrogeology 101 3/7/2011
|
|
|
- Jerome Hood
- 5 years ago
- Views:
Transcription


1 Hydrogeology 101 W. Richard Laton, Ph.D., PG, CPG Associate Professor of Hydrogeology California State University, Fullerton Department of Geological Sciences 1


2 Hydrogeology 101 The objective is to obtain a better understanding of the principles of groundwater, hydrologic cycle and water budgets. The lecture will also cover various types of aquifers and general groundwater quality. Objective To understand Basic definitions Hydrologic Cycle Groundwater Aquifers How water flows Water Budgets Wells Water Quality Contamination Investigation Tools 2


3 Definitions Water on Earth Hydrologic Cycle Meteorology weather Hydrology Surface water Hydrogeology Groundwater Unsaturated Zone Vadose Zone Aquifers Water Table Unconfined Confined Darcy s Law Safe Yield Water Chemistry Distribution of H 2 O on Earth 3

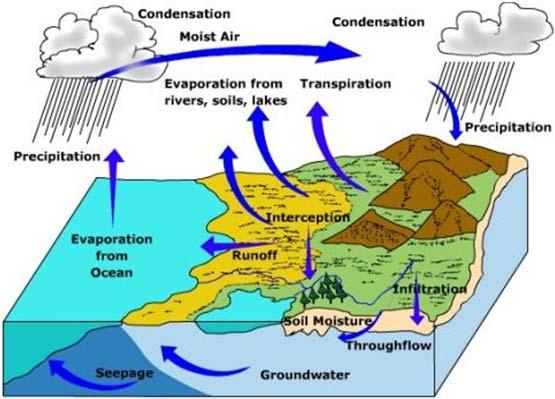


4 Hydrologic Cycle 4
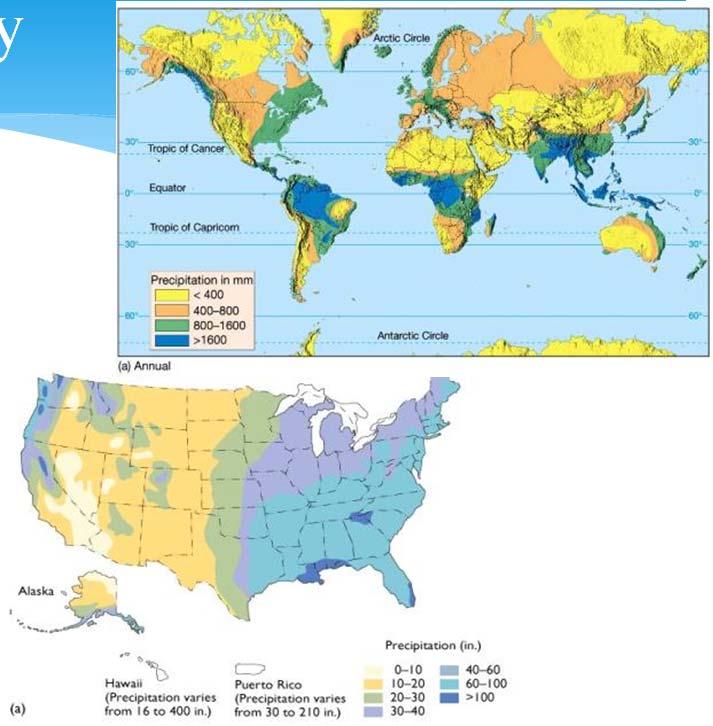
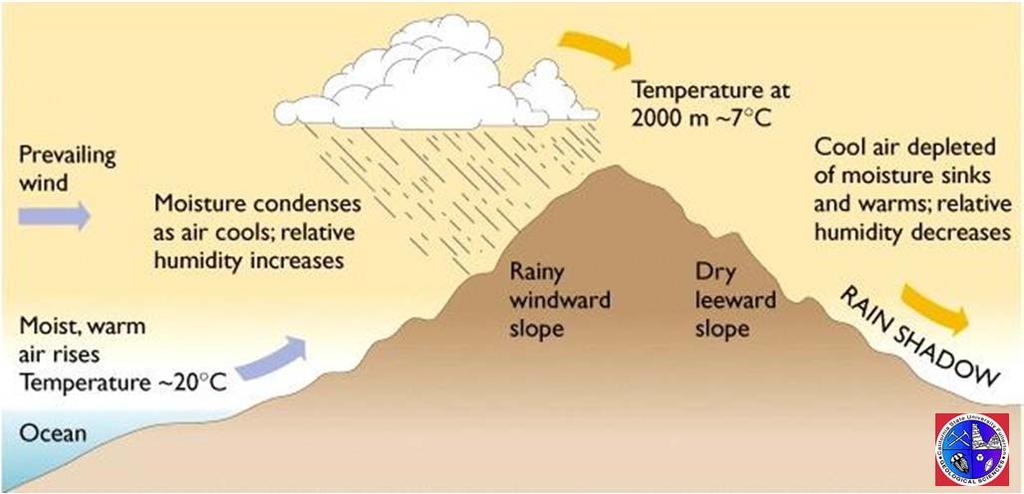
5 Meteorology Climate Precipitation Rain Snow Temperature Other factors Location Altitude Rain Shadow Deserts 5


6 Surface Water Ocean, Lake, Pond River, Stream Spring, Wetland Surface Water Flow Discharge Baseflow Flood Stage Gaining Stream Losing Stream 6

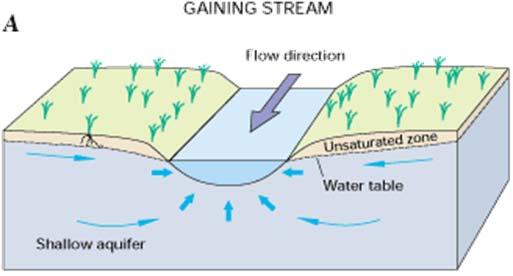
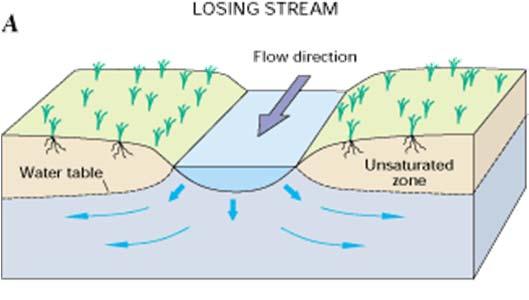
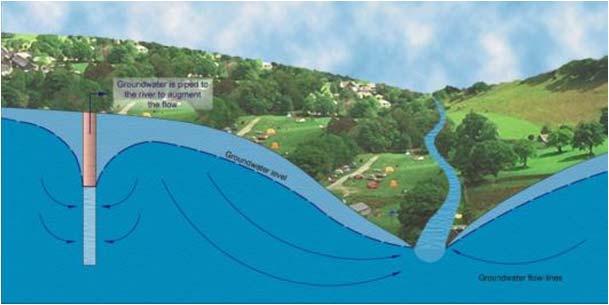
7 Gaining - Losing Groundwater 7


")


8 Groundwater Water contained in spaces within soil and bedrock Less than 1% of all H 2 O on Earth 40 times more abundant than water found in lakes and streams Groundwater terms zone of aeration: portion of soil and rock near the surface in which open spaces are filled primarily with air (a.k.a vadose zone, unsaturated zone) saturated zone: zone in which pore spaces are filled with water water table: boundary between zone of aeration and saturated zone 8


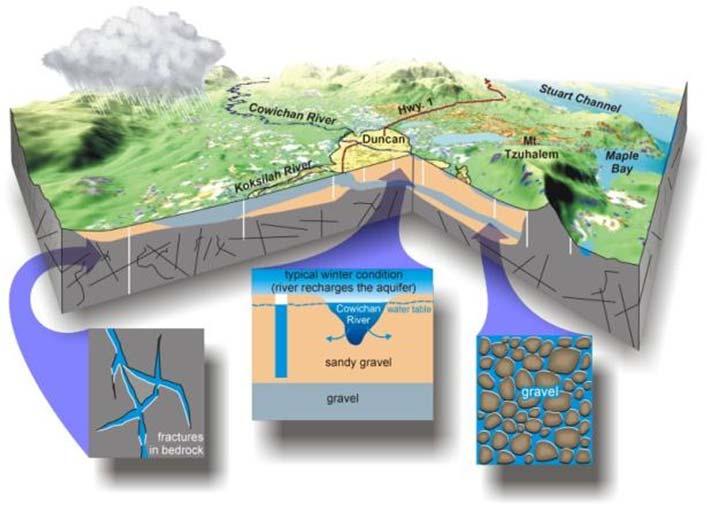
9 More groundwater terms aquifer: body of rock that is sufficiently water permeable to yield economically significant quantities to wells and springs Unconfined vs Confined aquitard: body of rock that retards but does not prevent flow of water to or from an adjacent aquifer aquiclude: body of relatively impermeable rock that is capable of absorbing water slowly but does not transmit it rapidly enough to supply a well or spring Impacts of Faults on Groundwater Flow Conduits of Flow Barriers to Groundwater Flow 9


10 Perched Water Table Confined Aquifer Aquifers Vadose Zone Water Table Unconfined Aquifer Aquitard Confined Aquifer 10


11 Isotropy/Anisotropy Homogeneous/Heterogeneous Isotropy The condition in which hydraulic properties of the aquifer are equal in all directions. Anisotropy The condition under which one or more of the hydraulic properties of an aquifer vary according to the direction of flow. Homogeneous A geologic unit that has the same properties at all locations. Heterogeneous Hydraulic properties vary spatially. Soils and rocks are not completely solid porosity: portion of volume of a material that consists of open spaces permeability: measure of the speed at which fluid can travel through a porous medium Imagine two vertical pipes, one filled with gravel, one with sand. Out of which one will the water flow faster? 11


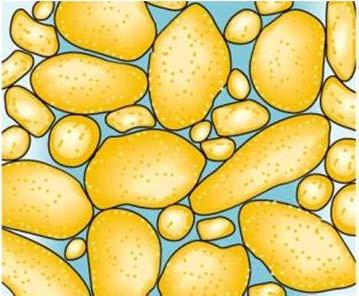

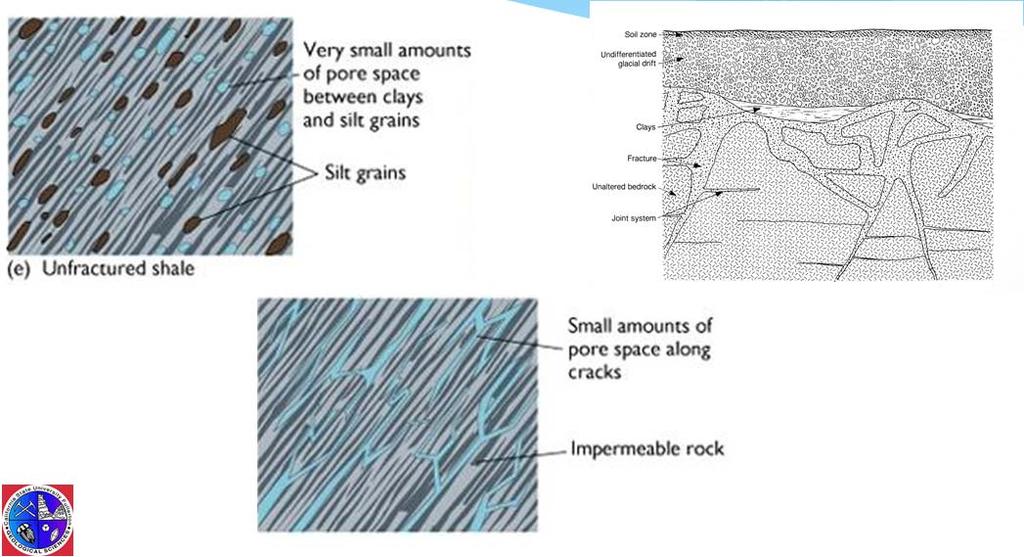
12 Well sorted Sandstone Poorly sorted Sandstone Fractured / Unfractured Shale 12


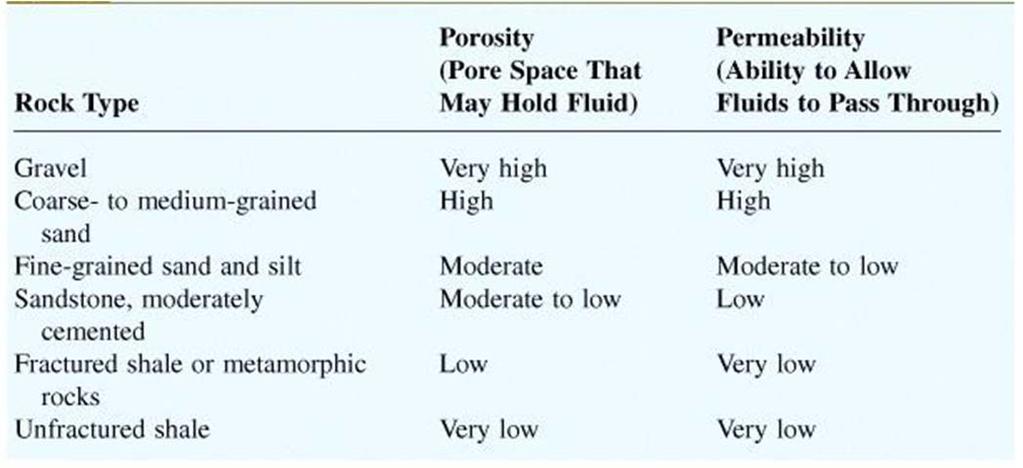
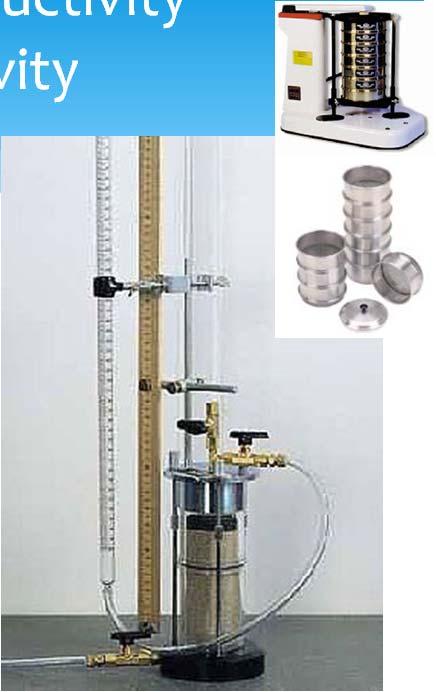
13 Porosity and Permeability Primary and Secondary Porosity Hydraulic Conductivity Transmissivity 13


 A = cross-sectional")
 h 1")
 l =")
14 Rates of groundwater movement Slow to very slow (depending on permeability) Generally within the range of 10 to 100 cm per day Darcy s Law Q = AK(h 1 h 2 ) l Q = discharge (m 3 /sec) A = cross-sectional area (m 2 ) K = coefficient of permeability (m/sec) h 1 = beginning height (m) h 2 = ending height (m) l = length of flow (m) 14

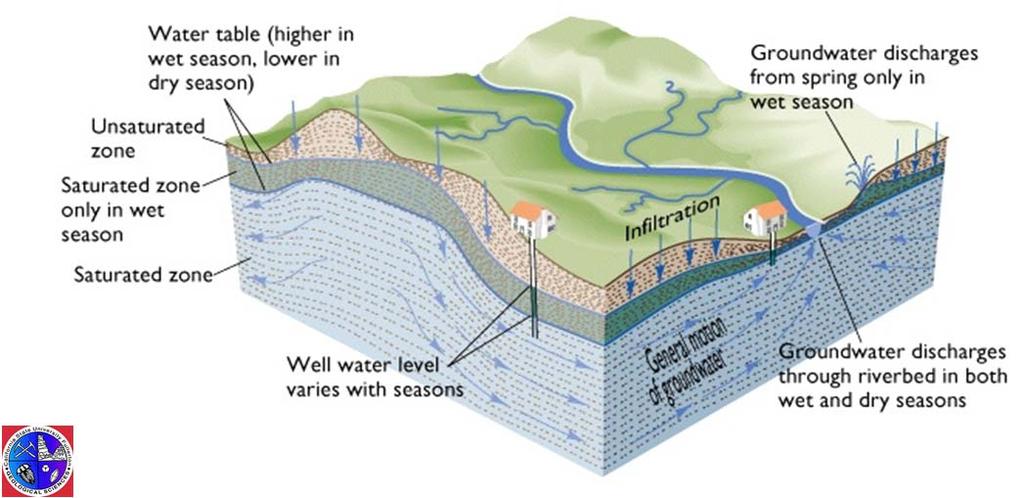


15 Groundwater Movement in Temperate Regions Dry Period Wet Period 15


16 Water Budgets In = Out ± change in storage Simple in concept Data driven Difficult in practice Assumptions Water Budget How and where is the water coming from; Recharge Return flow How and where is the water going; Pumping Surface water Evapotranspiration 16

![Example Water Budget Annual Average (acre-ft) DWR [1967] Goodrich [1978] 2](/docs-images/94/119849269/images/17-1.jpg "Brose [1987] Surface Inflow 1,050 1 1,050 1 1,050 1 Subsurface Inflow - - -")
 DWR [1967] Goodrich [1978] 1 Brose [1987] Stamos and")
![Predmore [1995] Surface Outflow - - - - Subsurface Outflow 100 100 500](/docs-images/94/119849269/images/17-3.jpg "300-600 Consumptive Use 4,540 10,045 7,725 - Total 4,640 10,145 8,225 -")
![Annual Average (acre-ft) DWR [1967] Goodrich [1978] 1 Brose [1987] Total](/docs-images/94/119849269/images/17-4.jpg "Input 1,744 1,050 1,750 Total Output 4,640 10,145 7,725 Total Water Budget")
17 Variables Inputs Precipitation Return flow Overland Flow Streams Springs Groundwater Outputs Pumping Evapotranspiration Overland Flow Groundwater Example Water Budget Annual Average (acre-ft) DWR [1967] Goodrich [1978] 2 Brose [1987] Surface Inflow 1, , ,050 1 Subsurface Inflow Precipitation Imported Water Total 1,744 1,050 1,750 Annual Average (acre-ft) DWR [1967] Goodrich [1978] 1 Brose [1987] Stamos and Predmore [1995] Surface Outflow Subsurface Outflow Consumptive Use 4,540 10,045 7,725 - Total 4,640 10,145 8,225 - Annual Average (acre-ft) DWR [1967] Goodrich [1978] 1 Brose [1987] Total Input 1,744 1,050 1,750 Total Output 4,640 10,145 7,725 Total Water Budget -2,896-9,095-6,475 17
18 Safe Yield (sustainability) The amount of naturally occurring groundwater that can be economically and legally withdrawn from an aquifer on a sustained basis without impairing the native groundwater quality or creating an undesirable effect such as environmental damage. It cannot exceed the increase in recharge or leakage from adjacent strata plus the reduction in discharge, which is due to the decline in head caused by pumping. C.W. Fetter, Groundwater Hydrographs Common Typically easy to interpret Este Hydrologic Sub-basin (05N01E17D01) Feet Below Ground Surface Measure Date 18

 150 200 250 300 350 1 Dec-04 Dec-03 Dec-02 Dec-01 Dec-00 Dec-99 Dec-98 Dec-97")


19 Assumptions - Hydrographs Long-term monitoring Frequent monitoring Quality data you can trust What do the hydrographs say? Este Hydrologic Sub-basin Lucerne Valley Sub-Basin Precipitation (Inches) Depth to Groundwater (Feet) Dec-04 Dec-03 Dec-02 Dec-01 Dec-00 Dec-99 Dec-98 Dec-97 Dec-96 Dec-95 Dec-94 Dec-93 Dec-92 Dec-91 Dec-90 Dec-89 Dec-88 Dec-87 Dec-86 Dec-85 Dec-84 Dec-83 Dec-82 Dec-81 Dec-80 Dec-79 Dec-78 Dec-77 Dec-76 Dec-75 Dec-74 Dec-73 Dec-72 Dec-71 Dec-70 Dec-69 Dec-68 Dec-67 Dec-66 Dec-65 Dec-64 Dec-63 Dec-62 Dec-61 Dec-60 Dec-59 Dec-58 Dec-57 Dec-56 Dec-55 Dec-54 Dec-53 Dec-52 Dec-51 Dec-50 Dec-49 Big Bear Lake Big Bear Dam Lake Arrowhead 06N01W27B001S 06N01W35A001S 05N01E06C001S 05N01W01C001S 05N01W01L001S 05N01W01R003S 05N01E08N004S 05N01E17D001S 05N01E20F001S 05N01E27H001S 05N01W25G001S 05N01W36F001S
 1 Dec-04 Sep-04 Jun-04")


20 Este Hydrologic Sub-basin Lucerne Valley Sub-Basin Precipitation (Inches) Depth to Groundwater (Feet) 1 Dec-04 Sep-04 Jun-04 Mar-04 Dec-03 Sep-03 Jun-03 Mar-03 Dec-02 Sep-02 Jun-02 Mar-02 Dec-01 Sep-01 Jun-01 Mar-01 Dec-00 Sep-00 Jun-00 Mar-00 Dec-99 Oct-99 Jul-99 Apr-99 Jan-99 Oct-98 Jul-98 Apr-98 Jan-98 Oct-97 Jul-97 Apr-97 Jan-97 Oct-96 Jul-96 Apr-96 Jan-96 Oct-95 Jul-95 Apr-95 Jan-95 Oct-94 Jul-94 May-94 Jan Big Bear Lake Big Bear Dam Lake Arrowhead 06N01W27B001S 06N01W35A001S 05N01E06C001S 05N01W01C001S 05N01W01L001S 05N01W01R003S 05N01E08N004S 05N01E17D001S 05N01E20F001S 05N01E27H001S 05N01W25G001S 05N01W36F001S 04N01E06R001S 04N01E05P002S 04N01E12P001S 04N01W13R001S 04N01E23K001S 04N01E13M001S Analysis Hydrographs groundwater levels drive the analysis Decline in water levels Increased water levels No change Balancing act z 1 z 2 z 3 20
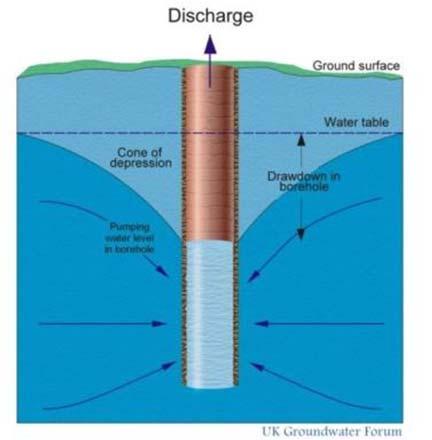
21 Groundwater and Wells Drawdown Cone of depression Capture zone Groundwater Withdrawal Potable (municipal and private) Irrigation Industrial 21


 to areas of low pressure.")

.")
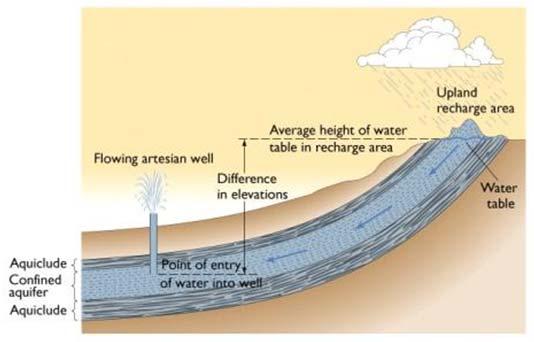
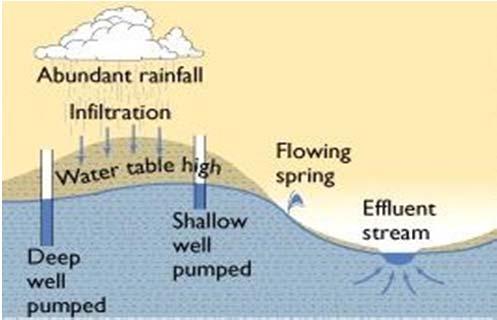
22 Drawdown Due to Pumping Water flowing underground water table Water in aquifers is replenished primarily by infiltration of surface water (groundwater recharge). flow lines impermeable layer discharge to stream Q 1 discharge to well Q 2 Groundwater flows from areas of high pressure (or hydraulic head) to areas of low pressure. In unconfined aquifers, hydraulic head is given by the height of the water table above some reference level. Left to itself, groundwater flow may intercept a surface water body, and flow into that body (natural groundwater discharge, Q). Alternatively, it may be removed through wells for human consumption (artificial groundwater discharge). 22

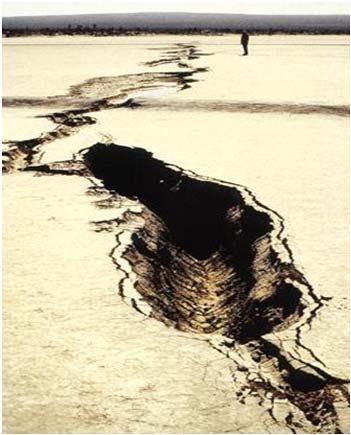
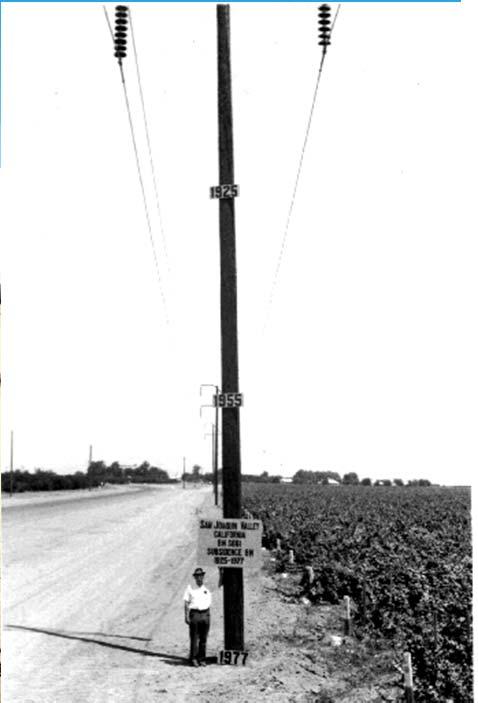
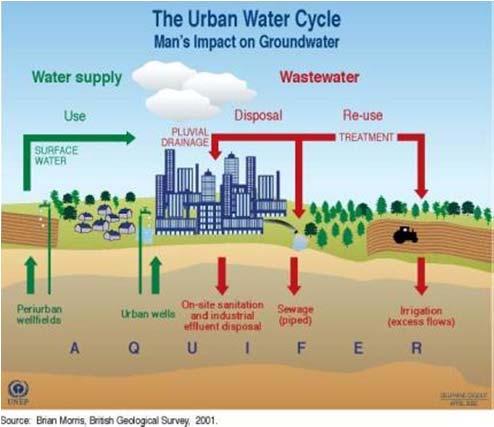
23 Mans Interaction Groundwater Withdrawal Pollutants/Contamination Fissures, Depressions and Land Subsidence Caused by Over Pumping James W. Borchers/USGS 23


, dissolved oxygen,")
.")
24 Water Quality Water quality can be thought of as a measure of the suitability of water for a particular use based on selected physical, chemical, and biological characteristics. To determine water quality, scientist s first measure and analyze characteristics of the water such as temperature, dissolved mineral content, and number of bacteria. Selected characteristics are then compared to numeric standards and guidelines to decide if the water is suitable for a particular use. Some aspects of water quality can be determined right in the stream or at the well. These include temperature, acidity (ph), dissolved oxygen, and electrical conductance (an indirect indicator of dissolved minerals in the water). Analyses of individual chemicals generally are done at a laboratory. USGS, 2009 Water Quality and Groundwater Movement 24

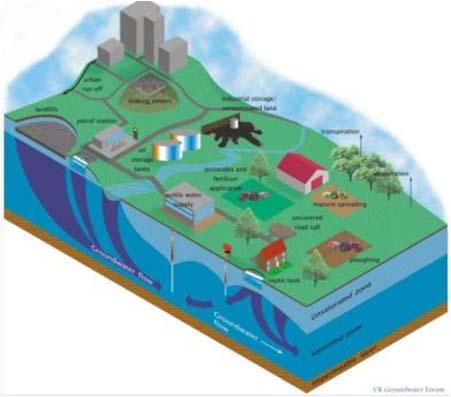
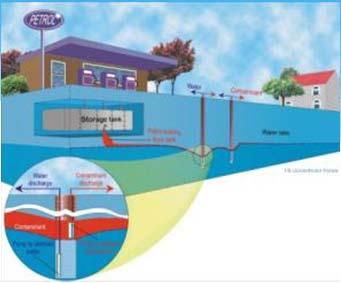
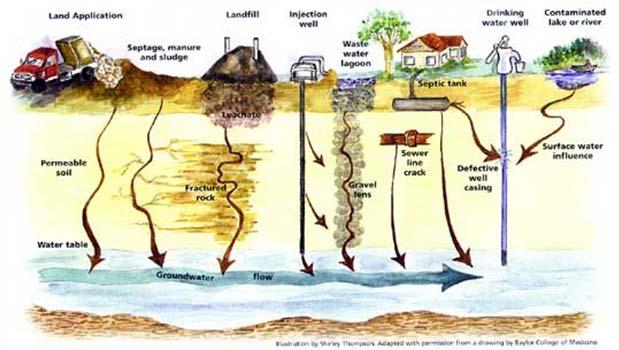

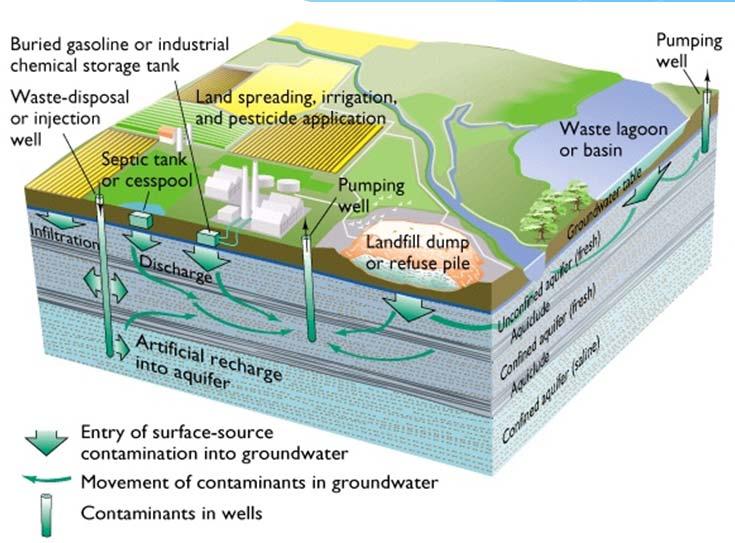
25 Sources of Contamination Groundwater Contamination 25


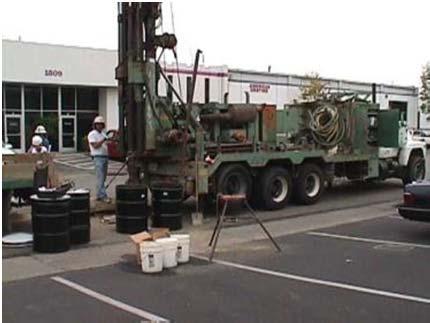
26 Investigation tools! Remote Sensing Geophysics Subsurface Investigations (monitoring wells, soil and rock borings, etc.) Aquifer Testing Water level monitoring Water Chemistry Computer Modeling Conclusion Basic definitions Hydrologic Cycle Groundwater Aquifers How water flows Water Budgets Wells Water Quality Contamination 26


27 Questions? Thank you 27