KW Cargill, P.A. Geotechnical/Environmental Consultant 6350 Riverside Drive Punta Gorda, Florida Tel:
|
|
|
- Alyson Hancock
- 5 years ago
- Views:
Transcription
1 KW Cargill, P.A. Geotechnical/Environmental Consultant 6350 Riverside Drive Punta Gorda, Florida Tel: June 2018 Mr. Benjamin Hsu Compliance Assurance Program Florida Department of Environmental Protection, Southwest District North Telecom Parkway Temple Terrace, Florida Subject: May 2018 Semi Annual Groundwater Monitoring s Orange Blossom Disposal Facility, Permit No SO/22 WACS ID No , Polk County, Florida Dear Mr. Morris: This report of the May 2018 semi annual groundwater quality monitoring at the Orange Blossom Disposal Facility (OBDF) was prepared by KW Cargill, P.A. (KWC) and is submitted to the Florida Department of Environmental Protection (FDEP) on behalf of Omni Waste of Polk, LLC (Omni). The purpose of this report is to provide results of the current semi annual groundwater quality sampling at the OBDF in accordance with the subject permit. This report complies with the requirements of Specific Condition Appendix 3, paragraphs 4 and 10 of Permit No SO/22 (Permit) and in accordance with Rule (8) (c) and (d) of the Florida Administrative Code (FAC). The report contains the electronic data deliverable (EDD) compatible with the Florida automated data processing tool (ADaPT). The report has been saved in Adobe pdf format and delivered via electronic mail in accordance with permit instructions. The Water Quality Monitoring Certification (31), signed by Mr. Kris Creeden, President of Omni, is included as Appendix A of this report. Semi Annual Groundwater Sampling and Field Testing The semi annual groundwater quality samples for MW 02, MW 03, MW 06, and MW 08 were collected by Mr. Neil Stapley, of Geosyntec Consultants, Tampa, Florida, on 21 May 2018, in accordance with FDEP s standard operating procedures (SOPs), as mandated by GW Monitoring Report.docx 18 June 2017
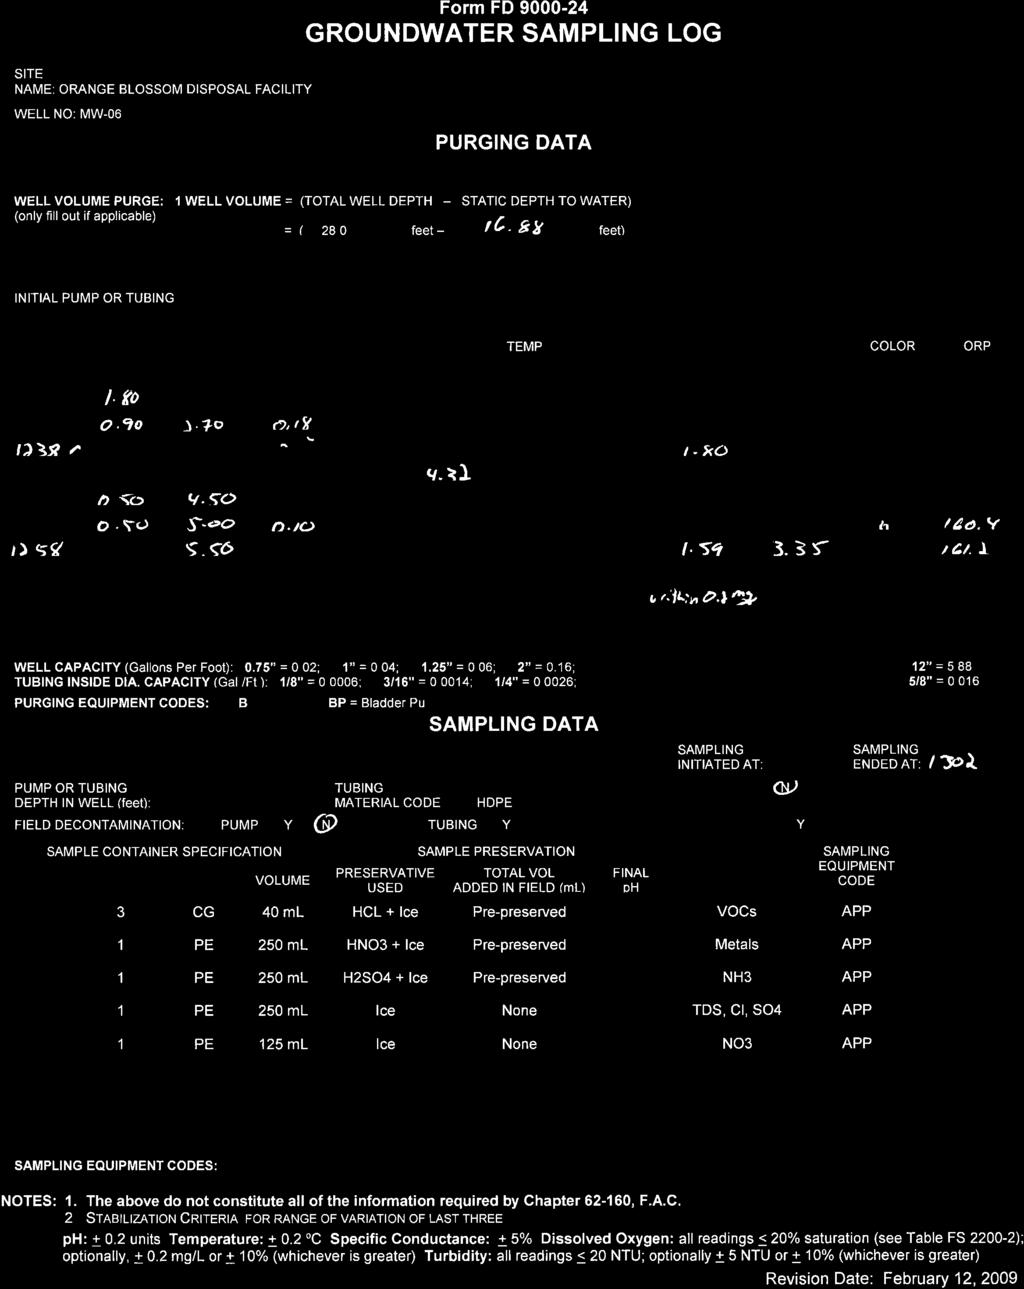
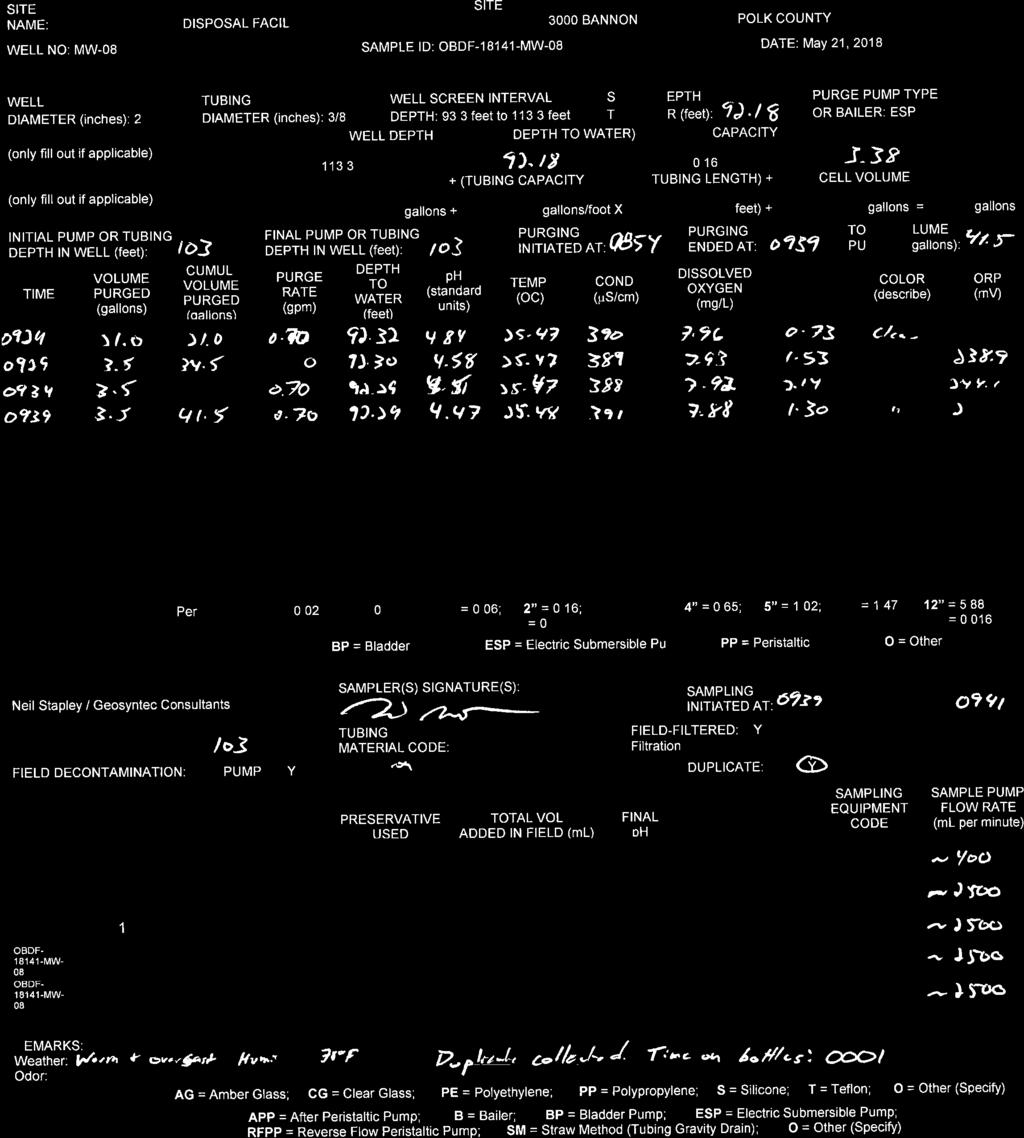
2 May 2018 Groundwater Quality Monitoring Orange Blossom Disposal Facility Page 2 KW Cargill, P.A. Rule (Quality Assurance), FAC, and DEP SOP (31 March 2008). A summary of all monitoring well construction details and information on four piezometer wells, two previously submitted to FDEP and two additional piezometer wells (P 5 and P 6) recently installed, that were measured during this monitoring event, are included in Table 1 attached to this report for reference. As discussed in previous water quality monitoring reports, the dissolved oxygen (DO) in the groundwater at some wells on the site occurs naturally at higher than 20 percent of saturation (i.e., 1.5 to 2.0 mg/l, depending on water temperature). As a result of high DO measurements, the criteria for field measurements as provided in Section 3.1 of FS 2212 (DO less than 20 percent of saturation) could not be met. Therefore, the criteria for field measurements from Section 3.2 of FS 2212 were followed (i.e., the range between the highest and lowest values for the last three measurements cannot exceed the following criteria: ±0.2 o C for temperature; ± 0.2 standard units for ph; ± 5% of reading for specific conductance; ± 0.2 mg/l for dissolved oxygen; and ± 5 NTUs for turbidity). These criteria were met for MW 02, MW 03, MW 05, and MW 08 as shown on the sampling logs included as Appendix B to this report. Additional information required by Section 3.2 of FS 2212 when high DO is found in field measurements is provided in the table included below. Table of Additional Information Required for High DO MW 02 MW 03 MW 06 MW 08 Pump Utilized SS Submersible SS Submersible Peristaltic SS Submersible Purge Rate 0.50 gpm 0.50 gpm 0.09 gpm 0.70 gpm Drawdown in Well 0.49 ft 0.31 ft 0.01 ft 0.11 ft Pump or Intake Placement Length & Location of the Screened Interval 91 ft BTOC, approx. 3.8 ft above bottom of well screen well screened between 74.8 to 94.8 ft BTOC (20 ft well screen) 101 ft BTOC, approx. 3.3 ft above bottom of well screen well screened between 84.3 to ft BTOC (20 ft well screen) 22.5 ft BTOC, approx. 5.5 ft above bottom of well screen well screened between 13.0 to 28.0 ft BTOC (15 ft well screen) 103 ft BTOC, approx. 10 ft above bottom of well screen well screened between 93.0 to ft BTOC (20 ft well screen) BTOC = below top of casing, gpm = gallons per minute, SS = stainless steel GW Monitoring Report.docx 18 June 2018
3 May 2018 Groundwater Quality Monitoring Orange Blossom Disposal Facility Page 3 KW Cargill, P.A. A decontaminated electric submersible pump was used to purge and sample the groundwater in monitoring wells MW 02, MW 03 and MW 08. A peristaltic pump was used to purge and sample MW 06. During the purging process, a YSI 556MPS, serial number 11G100864, water quality meter equipped with a flow through cell was used to monitor the following field parameters: ph; temperature; specific conductance; oxidation reduction potential (ORP); and DO. Turbidity levels were measured using a La Motte 2020we, serial number , turbidity meter. The water quality monitoring instruments were calibrated before sampling commenced and calibration was rechecked after the sampling event. The calibration form for these instruments is included as Appendix C to this report. Field parameters were recorded on groundwater sampling logs (Form FD ), which are included as Appendix B to this report. When the field parameters stabilized within the acceptable tolerances required by the FDEP SOP, well purging was considered complete and groundwater samples were collected from each well for laboratory testing. Filled sample bottles were placed in a cooler (Cooler ID: OBDF for MW 02/03/06/08) and packed with bagged ice for transport to the analytical laboratory. The field results also have been saved as an EDD using the ADaPT software and are included with the electronic report provided to FDEP. The sample coolers were delivered by Mr. Stapley to the representatives of the analytical laboratory as identified on the Chain of Custody (COC) forms attached to this report in Appendix D on the same day as the collection of samples. The sample coolers were received by the laboratory on 21 May Sample Analyses The groundwater samples were analyzed for constituents as required in the OBDF permit by. of Tampa, Florida (AEL) in accordance with the National Environmental Laboratory Accreditation Conference (NELAC) standards The branch laboratory performing the testing holds a certification from the Florida Department of Health (FDOH) for the analytical test methods used for this project and is certified in the State of Florida for analysis of environmental samples. AEL holds FDOH Certification No. E This sampling event analyses were performed in accordance with the routine sampling protocol of the 2015 revision to Chapter (8) (c), FAC. Therefore, the GW Monitoring Report.docx 18 June 2018
4 May 2018 Groundwater Quality Monitoring Orange Blossom Disposal Facility Page 4 KW Cargill, P.A. groundwater samples were analyzed for total ammonia as nitrogen (N), chlorides, nitrate, sulfate, total dissolved solids (TDS), xylene, aluminum, arsenic, cadmium, chromium, iron, lead, mercury, sodium, and those parameters listed in EPA Methods 601 and 602. Other required parameters (i.e., ph; turbidity; temperature; specific conductivity; and dissolved oxygen) were measured by Mr. Stapley in the field during collection of the groundwater samples. The static water level relative to the top of the well casing before purging, as well as any colors or sheens were also recorded by Mr. Stapley. Analytical Testing s The analytical laboratory test results prepared by AEL for the May 2018 semi annual groundwater monitoring for MW 02, MW 03, MW 06, and MW 08 are attached to this report as Appendix E. AEL has also prepared and saved the laboratory results as an EDD using the ADaPT software and those files are included with the electronic report provided to FDEP. The constituents specifically noted for the routine testing protocol in the permit or with detections above the method detection limits for each of the monitoring well samples are summarized in Table 2 attached to this report. Any parameters exceeding the groundwater maximum contaminant levels (MCL) or secondary maximum contaminant levels (SMCL) are highlighted in the table. Those constituents exceeding MCL/SMCL limits are discussed below. ph A low ph in all wells has been typical throughout the site s history and results again are below the SMCL of 6.5 to 8.5 (standard units) in the background well, MW 02 (ph=4.55), and the detection wells, MW 03 (ph=4.20), MW 06 (ph=4.32), and MW 08 (ph=4.47). These measurements are lower than the previous sample measurements in MW 02, MW 03, and MW 06 and higher in MW 08. The low ph appears to be naturally occurring at the site, and has been routinely measured in all wells at the site in all previous monitoring events. The naturally low ph is probably due to the rapid infiltration of rainfall and a lack of buffering through the very clean, silica sands at the site. Aluminum The SMCL for Aluminum (200 μg/l) was again exceeded in all detection wells in this event including in in the background well. The exceedances are no doubt due to the relatively low ph in the wells at this site. The background well, MW 02, was measured at 210 μg/l, which is higher than the previously measured GW Monitoring Report.docx 18 June 2018
5 May 2018 Groundwater Quality Monitoring Orange Blossom Disposal Facility Page 5 KW Cargill, P.A. concentration of 160 μg/l. The SMCL was also exceeded in detection wells, MW 03 (850 μg/l), MW 06 (750 μg/l), and MW 08 (1200 μg/l). These results represent an increase in MW 02, MW 03, and MW 06 and a decrease in MW 08. Elevated Aluminum concentrations have been previously found in all wells, including the background well (MW 02), above the SMCL. The high levels in the wells correspond to the very low ph in the wells, and the source is most likely the Aluminum contained in the silica sands at the site. Nitrate The MCL for Nitrate (10 mg/l) again was exceeded in the routine testing for MW 08, (15 mg/l) for this event. There have been previous exceedances of Nitrate in all wells, both background and detection, thought to be due to influences from the citrus grove to the west of the site. Fertilizer used on the landscape buffer at the OBDF may also be a source of the Nitrate. The sandy soils native to the site offer very little to no buffering of rainfall infiltrating directly to the surficial aquifer. Conclusions and Recommendations The analytical results of this sampling event have been very similar to all previous analytical results. The primary exceedance of criteria continues to be confined to ph and Aluminum, and Nitrate. The detection well most directly affected by the waste pile, MW 06, continues to exhibit very low concentrations of constituents of concern as was the case for former wells, MW 04 and MW 05, which were also located immediately downstream from the major portion of the waste. KWC recommends that semi annual groundwater sampling continue. Groundwater Potentiometric Surface During each groundwater monitoring event, groundwater elevations are measured at each monitoring well and at each piezometer maintained at the OBDF as required by the permit. (It is noted that two additional piezometers have been installed at the site and will be incorporated into the record of potentiometric surface.) A record of these groundwater elevations is presented in Table 3 of this report. The data presented in Table 3 represent only those measurements made since Omni became the facility operator in Historical groundwater elevations prior to 2008 can be found in the Groundwater Monitoring Technical Evaluation Reports previously submitted to FDEP. The water level data from the 21 May 2018 measurements were used in plotting the groundwater potentiometric surface indicated in Figure 1 of this report. All groundwater GW Monitoring Report.docx 18 June 2018
6 May 2018 Groundwater Quality Monitoring Orange Blossom Disposal Facility Page 6 KW Cargill, P.A. level measurements were made within an approximate 4 hour period. The potentiometric surface indicates that groundwater flow is generally from the southwest to the northeast across the disposal facility site. The northeasterly direction is consistent with the direction of groundwater flow measured and reported for previous monitoring events and also those summarized in the previous Groundwater Monitoring Technical Evaluation Reports. Closure This report of semi annual groundwater quality results for MW 02, MW 03, MW 06, and MW 08 at the OBDF is intended to comply with the requirements of the permit. If additional information is needed, or if questions regarding the information presented in this report arise, please do not hesitate to contact the undersigned at or by at kwcargill@earthlink.net. Sincerely, Kenneth W. Cargill, P.E. Florida PE No President Appendices as stated Copy to: Mr. Kris Creeden, Omni Waste of Polk (file) SWD_Waste@dep.state.fl.us GW Monitoring Report.docx 18 June 2018
7
8 OBDF Groundwater Monitoring May 2018 Table 1 KW Cargill, P.A. SUMMARY OF MONITORING WELL CONSTRUCTION DETAILS ORANGE BLOSSOM DISPOSAL FACILITY POLK COUNTY, FLORIDA Well Designation Latitude/ Northing (NAD 1983) Longitude/ Easting (NAD 1983) WACS ID No. Well Designation Date Installed Top of Casing Elevation, TOC (feet) NGVD 1929 Total Depth (feet BTOC) Screen Setting (feet BTOC) (feet Elevation) Top Bottom Top Bottom MW o 04' " N/ 1,359, o 36' " W/ 782, Background 5 Dec MW o 04' " N/ 1,360, o 36' " W/ Detection 5 Dec * MW o 04' " N/ 1,360, o 36' " W/ 783, Detection 19 Sep MW o 04' 36.77" N/ 1,360, o 36' 18.95" W/ 783, Detection 13 Mar P 2 28 o 04' " N/ 1,359, o 36' " W/ 783, NA Piezometer P 4 28 o 04' " N/ 1,360, o 36' " W/ 782, NA Piezometer P 5 28 o 04' 34.61" N/ 1, o 36' 9.72" W/ NA Piezometer 10 Apr P 6 28 o 04' 27.16" N/ 1, o 36' 10.65" W/ Notes: NAD = North American Datum NGVD = National Geodetic Vertical Datum BTOC = Below Top of Casing TOC = Top of Casing WACS = Water Assurance Compliance System NA Piezometer 10 Apr GW Report Tables may18.xlsx 18 June 2018
9 OBDF Groundwater Monitoring May 2018 KW Cargill, P.A. Table 2 QUARTERLY GROUNDWATER MONITORING RESULTS ORANGE BLOSSOM DISPOSAL FACILITY POLK COUNTY, FLORIDA Sampling Date: 21 May 2018 Parameter Monitored MCL / SMCL Method Detection Limit Units MW 02 Background Field Parameters Dissolved Oxygen mg/l ph SU Specific Conductivity μs/cm Temperature at Sampling Time C Turbidity NTU Oxidation Reduction Potential (ORP) mv Laboratory Parameters MW 03 Detection Monitoring s MW 06 Detection Aluminum µg/l 210 * Arsenic µg/l ND ND ND ND Cadmium µg/l 0.31 * ND ND 0.31 * Chromium µg/l 2.7 ND ND ND Iron µg/l 38 * 74 * 99 * 53 * Lead µg/l ND ND ND ND Mercury µg/l ND ND * ND Sodium mg/l Ammonia mg/l ND ND 0.95 ND Chloride mg/l 3.5 * Nitrate mg/l Sulfate mg/l Total Dissolved Solids (TDS) mg/l MW 08 Detection Notes: Concentrations in highlighted cells did not meet the MCL and/or SMCL Standard Criteria. * The reported value is between the laboratory method detection limit and the laboratory practical quantification limit. GW Report Tables may18.xlsx 18 June 2018
10 OBDF Groundwater Monitoring May 2018 KW Cargill, P.A. Table 3 GROUNDWATER LEVEL MEASUREMENTS ORANGE BLOSSOM DISPOSAL FACILITY POLK COUNTY, FLORIDA Last Measurement: 21 May 2018 DATE Depth Below TOC MW 02 MW 03 MW 04 MW 05 MW 06 MW 08 P 2 Elevation (TOC = ) Depth Below TOC Elevation (TOC = ) (see Note 1) Depth Below TOC Elevation (TOC = ) Depth Below TOC Elevation (TOC = ) Depth Below TOC Elevation (TOC = ) Depth Below TOC Elevation (TOC = ) Depth Below TOC Elevation (TOC = ) P 4 Depth Below TOC Elevation (TOC = ) Depth Below TOC P 5 P 6 Elevation (TOC = ) Depth Below TOC Elevation (TOC = ) 5 Dec Jun Dec Jun Dec Mar Jun Sep Dec Mar Jun Sep Dec Mar Jun Jun Sep Dec Mar Jun Sep Dec Mar Jun Jul Sep Dec May Nov May Sep Oct Nov May Note 1: MW-03 damaged in September Top section of casing replaced. Prior to replacement, TOC elevation = ft. GW Report Tables may18.xlsx 18 June 2018
11
12 OBDF Groundwater Monitoring May 2018 KW Cargill, P.A. APPENDIX A WATER QUALITY MONITORING CERTIFICATION DEP FORM (31) GW Mon Rpt Appendix.docx 18 June 2018
13
14 OBDF Groundwater Monitoring May 2018 KW Cargill, P.A. APPENDIX B GROUNDWATER SAMPLING LOGS (Form FD ) GW Mon Rpt Appendix.docx 18 June 2018


15


16

17

18
19 OBDF Groundwater Monitoring May 2018 KW Cargill, P.A. APPENDIX C FIELD INSTRUMENT CALIBRATION FORM GW Mon Rpt Appendix.docx 18 June 2018

20
21 OBDF Groundwater Monitoring May 2018 KW Cargill, P.A. APPENDIX D CHAIN OF CUSTODY FORM GW Mon Rpt Appendix.docx 18 June 2018


22
23 OBDF Groundwater Monitoring May 2018 KW Cargill, P.A. APPENDIX E ANALYTICAL LABORATORY REPORT GW Mon Rpt Appendix.docx 18 June 2018

24 May 29, 2018 Ken Cargill KW Cargill 6350 Riverside Drive Punta Gorda, FL RE: Dear Ken Cargill: Enclosed are the analytical results for sample(s) received by the laboratory on Monday, May 21, s reported herein conform to the most current NELAC standards, where applicable, unless otherwise narrated in the body of the report. The analytical results for the samples contained in this report were submitted for analysis as outlined by the Chain of Custody and results pertain only to these samples. If you have any questions concerning this report, please feel free to contact me. Sincerely, Enclosures Report ID: Page 1 of 33 without the written consent of.
25 SAMPLE SUMMARY Lab ID Sample ID Matrix Date Collected Date Received T OBDF MW-02 Water 5/21/ :45 5/21/ :16 T OBDF MW-03 Water 5/21/ :52 5/21/ :16 T OBDF MW-06 Water 5/21/ :58 5/21/ :16 T OBDF MW-08 Water 5/21/ :36 5/21/ :16 T OBDF Dup-01 Water 5/21/ :01 5/21/ :16 Report ID: Page 2 of 33 without the written consent of.
26 ANALYTICAL RESULTS Lab ID: T Date Received: 05/21/18 15:16 Matrix: Water Sample ID: OBDF MW-02 Date Collected: 05/21/18 11:45 Sample Description: Location: Parameters s Qual Units DF Adjusted PQL Adjusted MDL Analyzed Lab METALS Analysis Desc: SW B Analysis,Water Preparation Method: SW A Analytical Method: SW Aluminum 210 I ug/l /22/ :02 T Arsenic 1.6 U ug/l /22/ :02 T Cadmium 0.31 I ug/l /22/ :02 T Chromium 2.7 ug/l /22/ :02 T Iron 38 I ug/l /22/ :02 T Lead 3.2 U ug/l /22/ :02 T Sodium 1.8 mg/l /22/ :02 T Analysis Desc: SW A Analysis,Water Preparation Method: SW A Analytical Method: SW A Mercury U mg/l /22/ :41 T VOLATILES Analysis Desc: 8260B Analysis, Water Preparation Method: SW B Analytical Method: SW B 1,1,1-Trichloroethane 0.44 U ug/l /23/ :36 T 1,1,2,2-Tetrachloroethane 0.20 U ug/l /23/ :36 T 1,1,2-Trichloroethane 0.46 U ug/l /23/ :36 T 1,1-Dichloroethane 0.86 U ug/l /23/ :36 T 1,1-Dichloroethylene 0.70 U ug/l /23/ :36 T 1,2-Dichlorobenzene 0.63 U ug/l /23/ :36 T 1,2-Dichloroethane 0.60 U ug/l /23/ :36 T 1,2-Dichloropropane 0.76 U ug/l /23/ :36 T 1,3-Dichlorobenzene 0.43 U ug/l /23/ :36 T 1,4-Dichlorobenzene 0.97 U ug/l /23/ :36 T 2-Chloroethyl Vinyl Ether 0.58 U ug/l /23/ :36 T Benzene 0.20 U ug/l /23/ :36 T Bromodichloromethane 0.60 U ug/l /23/ :36 T Bromoform 0.88 U ug/l /23/ :36 T Bromomethane 0.97 U ug/l /23/ :36 T Carbon Tetrachloride 0.60 U ug/l /23/ :36 T Chlorobenzene 0.56 U ug/l /23/ :36 T Chloroethane 0.38 U ug/l /23/ :36 T Chloroform 0.31 U ug/l /23/ :36 T Chloromethane 0.53 U ug/l /23/ :36 T Report ID: Page 3 of 33 without the written consent of.
27 ANALYTICAL RESULTS Lab ID: T Date Received: 05/21/18 15:16 Matrix: Water Sample ID: OBDF MW-02 Date Collected: 05/21/18 11:45 Sample Description: Parameters s Qual Units Location: DF Adjusted PQL Adjusted MDL Analyzed Dibromochloromethane 0.40 U ug/l /23/ :36 T Dichlorodifluoromethane 0.36 U ug/l /23/ :36 T Ethylbenzene 0.26 U ug/l /23/ :36 T Methyl tert-butyl Ether (MTBE) 0.41 U ug/l /23/ :36 T Methylene Chloride 1.0 U ug/l /23/ :36 T Tetrachloroethylene (PCE) 0.60 U ug/l /23/ :36 T Toluene 0.45 U ug/l /23/ :36 T Trichloroethene 0.60 U ug/l /23/ :36 T Trichlorofluoromethane 0.84 U ug/l /23/ :36 T Vinyl Chloride 0.20 U ug/l /23/ :36 T Xylene (Total) 0.56 U ug/l /23/ :36 T cis-1,2-dichloroethylene 0.51 U ug/l /23/ :36 T cis-1,3-dichloropropene 0.20 U ug/l /23/ :36 T trans-1,2-dichloroethylene 0.50 U ug/l /23/ :36 T trans-1,3-dichloropropylene 0.20 U ug/l /23/ :36 T 1,2-Dichloroethane-d4 (S) 141 J4 % /23/ :36 Toluene-d8 (S) 105 % /23/ :36 Bromofluorobenzene (S) 111 % /23/ :36 WET CHEMISTRY Analysis Desc: IC,E300.0,Water Analytical Method: EPA Chloride 3.5 I mg/l /25/ :50 T Sulfate 22 mg/l /25/ :50 T Analysis Desc: Ammonia,E350.1,Water Analytical Method: EPA Ammonia (N) U mg/l /25/ :36 T Analysis Desc: Alkalinity,SM2320B,Water Analytical Method: SM 2320B Alkalinity, Total 5.0 U mg/l /22/ :47 T Analysis Desc: Tot Dissolved Solids,SM2540C Analytical Method: SM 2540 C Total Dissolved Solids 80 mg/l /22/ :39 T Analysis Desc: Nitrate,Nitrite SM4500NO3F,Water Analytical Method: SM 4500NO3-F Nitrate 2.7 mg/l /22/ :15 T Lab Report ID: Page 4 of 33 without the written consent of.
28 ANALYTICAL RESULTS Lab ID: T Date Received: 05/21/18 15:16 Matrix: Water Sample ID: OBDF MW-03 Date Collected: 05/21/18 10:52 Sample Description: Location: Parameters s Qual Units DF Adjusted PQL Adjusted MDL Analyzed Lab METALS Analysis Desc: SW B Analysis,Water Preparation Method: SW A Analytical Method: SW Aluminum 850 ug/l /22/ :06 T Arsenic 1.6 U ug/l /22/ :06 T Cadmium 0.24 U ug/l /22/ :06 T Chromium 2.0 U ug/l /22/ :06 T Iron 74 I ug/l /22/ :06 T Lead 3.2 U ug/l /22/ :06 T Sodium 4.7 mg/l /22/ :06 T Analysis Desc: SW A Analysis,Water Preparation Method: SW A Analytical Method: SW A Mercury U mg/l /22/ :51 T VOLATILES Analysis Desc: 8260B Analysis, Water Preparation Method: SW B Analytical Method: SW B 1,1,1-Trichloroethane 0.44 U ug/l /24/ :13 T 1,1,2,2-Tetrachloroethane 0.20 U ug/l /24/ :13 T 1,1,2-Trichloroethane 0.46 U ug/l /24/ :13 T 1,1-Dichloroethane 0.86 U ug/l /24/ :13 T 1,1-Dichloroethylene 0.70 U ug/l /24/ :13 T 1,2-Dichlorobenzene 0.63 U ug/l /24/ :13 T 1,2-Dichloroethane 0.60 U ug/l /24/ :13 T 1,2-Dichloropropane 0.76 U ug/l /24/ :13 T 1,3-Dichlorobenzene 0.43 U ug/l /24/ :13 T 1,4-Dichlorobenzene 0.97 U ug/l /24/ :13 T 2-Chloroethyl Vinyl Ether 0.58 U ug/l /24/ :13 T Benzene 0.20 U ug/l /24/ :13 T Bromodichloromethane 0.60 U ug/l /24/ :13 T Bromoform 0.88 U ug/l /24/ :13 T Bromomethane 0.97 U ug/l /24/ :13 T Carbon Tetrachloride 0.60 U ug/l /24/ :13 T Chlorobenzene 0.56 U ug/l /24/ :13 T Chloroethane 0.38 U ug/l /24/ :13 T Chloroform 0.31 U ug/l /24/ :13 T Chloromethane 0.53 U ug/l /24/ :13 T Report ID: Page 5 of 33 without the written consent of.
29 ANALYTICAL RESULTS Lab ID: T Date Received: 05/21/18 15:16 Matrix: Water Sample ID: OBDF MW-03 Date Collected: 05/21/18 10:52 Sample Description: Parameters s Qual Units Location: DF Adjusted PQL Adjusted MDL Analyzed Dibromochloromethane 0.40 U ug/l /24/ :13 T Dichlorodifluoromethane 0.36 U ug/l /24/ :13 T Ethylbenzene 0.26 U ug/l /24/ :13 T Methyl tert-butyl Ether (MTBE) 0.41 U ug/l /24/ :13 T Methylene Chloride 1.0 U ug/l /24/ :13 T Tetrachloroethylene (PCE) 0.60 U ug/l /24/ :13 T Toluene 0.45 U ug/l /24/ :13 T Trichloroethene 0.60 U ug/l /24/ :13 T Trichlorofluoromethane 0.84 U ug/l /24/ :13 T Vinyl Chloride 0.20 U ug/l /24/ :13 T Xylene (Total) 0.56 U ug/l /24/ :13 T cis-1,2-dichloroethylene 0.51 U ug/l /24/ :13 T cis-1,3-dichloropropene 0.20 U ug/l /24/ :13 T trans-1,2-dichloroethylene 0.50 U ug/l /24/ :13 T trans-1,3-dichloropropylene 0.20 U ug/l /24/ :13 T 1,2-Dichloroethane-d4 (S) 102 % /24/ :13 Toluene-d8 (S) 101 % /24/ :13 Bromofluorobenzene (S) 101 % /24/ :13 WET CHEMISTRY Analysis Desc: IC,E300.0,Water Analytical Method: EPA Chloride 11 mg/l /25/ :38 T Sulfate 76 mg/l /25/ :38 T Analysis Desc: Ammonia,E350.1,Water Analytical Method: EPA Ammonia (N) U mg/l /25/ :36 T Analysis Desc: Alkalinity,SM2320B,Water Analytical Method: SM 2320B Alkalinity, Total 5.0 U mg/l /22/ :50 T Analysis Desc: Tot Dissolved Solids,SM2540C Analytical Method: SM 2540 C Total Dissolved Solids 270 mg/l /22/ :39 T Analysis Desc: Nitrate,Nitrite SM4500NO3F,Water Analytical Method: SM 4500NO3-F Nitrate 10 mg/l /22/ :36 T Lab Report ID: Page 6 of 33 without the written consent of.
30 ANALYTICAL RESULTS Lab ID: T Date Received: 05/21/18 15:16 Matrix: Water Sample ID: OBDF MW-06 Date Collected: 05/21/18 12:58 Sample Description: Location: Parameters s Qual Units DF Adjusted PQL Adjusted MDL Analyzed Lab METALS Analysis Desc: SW B Analysis,Water Preparation Method: SW A Analytical Method: SW Aluminum 750 ug/l /22/ :09 T Arsenic 1.6 U ug/l /22/ :09 T Cadmium 0.24 U ug/l /22/ :09 T Chromium 2.0 U ug/l /22/ :09 T Iron 99 I ug/l /22/ :09 T Lead 3.2 U ug/l /22/ :09 T Sodium 13 mg/l /22/ :09 T Analysis Desc: SW A Analysis,Water Preparation Method: SW A Analytical Method: SW A Mercury I mg/l /22/ :54 T VOLATILES Analysis Desc: 8260B Analysis, Water Preparation Method: SW B Analytical Method: SW B 1,1,1-Trichloroethane 0.44 U ug/l /23/ :30 T 1,1,2,2-Tetrachloroethane 0.20 U ug/l /23/ :30 T 1,1,2-Trichloroethane 0.46 U ug/l /23/ :30 T 1,1-Dichloroethane 0.86 U ug/l /23/ :30 T 1,1-Dichloroethylene 0.70 U ug/l /23/ :30 T 1,2-Dichlorobenzene 0.63 U ug/l /23/ :30 T 1,2-Dichloroethane 0.60 U ug/l /23/ :30 T 1,2-Dichloropropane 0.76 U ug/l /23/ :30 T 1,3-Dichlorobenzene 0.43 U ug/l /23/ :30 T 1,4-Dichlorobenzene 0.97 U ug/l /23/ :30 T 2-Chloroethyl Vinyl Ether 0.58 U ug/l /23/ :30 T Benzene 0.20 U ug/l /23/ :30 T Bromodichloromethane 0.60 U ug/l /23/ :30 T Bromoform 0.88 U ug/l /23/ :30 T Bromomethane 0.97 U ug/l /23/ :30 T Carbon Tetrachloride 0.60 U ug/l /23/ :30 T Chlorobenzene 0.56 U ug/l /23/ :30 T Chloroethane 0.38 U ug/l /23/ :30 T Chloroform 0.31 U ug/l /23/ :30 T Chloromethane 0.53 U ug/l /23/ :30 T Report ID: Page 7 of 33 without the written consent of.
31 ANALYTICAL RESULTS Lab ID: T Date Received: 05/21/18 15:16 Matrix: Water Sample ID: OBDF MW-06 Date Collected: 05/21/18 12:58 Sample Description: Parameters s Qual Units Location: DF Adjusted PQL Adjusted MDL Analyzed Dibromochloromethane 0.40 U ug/l /23/ :30 T Dichlorodifluoromethane 0.36 U ug/l /23/ :30 T Ethylbenzene 0.26 U ug/l /23/ :30 T Methyl tert-butyl Ether (MTBE) 0.41 U ug/l /23/ :30 T Methylene Chloride 1.0 U ug/l /23/ :30 T Tetrachloroethylene (PCE) 0.60 U ug/l /23/ :30 T Toluene 0.45 U ug/l /23/ :30 T Trichloroethene 0.60 U ug/l /23/ :30 T Trichlorofluoromethane 0.84 U ug/l /23/ :30 T Vinyl Chloride 0.20 U ug/l /23/ :30 T Xylene (Total) 0.56 U ug/l /23/ :30 T cis-1,2-dichloroethylene 0.51 U ug/l /23/ :30 T cis-1,3-dichloropropene 0.20 U ug/l /23/ :30 T trans-1,2-dichloroethylene 0.50 U ug/l /23/ :30 T trans-1,3-dichloropropylene 0.20 U ug/l /23/ :30 T 1,2-Dichloroethane-d4 (S) 149 J4 % /23/ :30 Toluene-d8 (S) 105 % /23/ :30 Bromofluorobenzene (S) 112 % /23/ :30 WET CHEMISTRY Analysis Desc: IC,E300.0,Water Analytical Method: EPA Chloride 59 mg/l /25/ :54 T Sulfate 75 mg/l /25/ :54 T Analysis Desc: Ammonia,E350.1,Water Analytical Method: EPA Ammonia (N) 0.95 mg/l /25/ :36 T Analysis Desc: Alkalinity,SM2320B,Water Analytical Method: SM 2320B Alkalinity, Total 5.0 U mg/l /22/ :53 T Analysis Desc: Tot Dissolved Solids,SM2540C Analytical Method: SM 2540 C Total Dissolved Solids 290 mg/l /22/ :39 T Analysis Desc: Nitrate,Nitrite SM4500NO3F,Water Analytical Method: SM 4500NO3-F Nitrate 4.5 mg/l /22/ :18 T Lab Report ID: Page 8 of 33 without the written consent of.
32 ANALYTICAL RESULTS Lab ID: T Date Received: 05/21/18 15:16 Matrix: Water Sample ID: OBDF MW-08 Date Collected: 05/21/18 09:36 Sample Description: Location: Parameters s Qual Units DF Adjusted PQL Adjusted MDL Analyzed Lab METALS Analysis Desc: SW B Analysis,Water Preparation Method: SW A Analytical Method: SW Aluminum 1200 ug/l /22/ :13 T Arsenic 1.6 U ug/l /22/ :13 T Cadmium 0.31 I ug/l /22/ :13 T Chromium 3.6 ug/l /22/ :13 T Iron 53 I ug/l /22/ :13 T Lead 3.2 U ug/l /22/ :13 T Sodium 5.5 mg/l /22/ :13 T Analysis Desc: SW A Analysis,Water Preparation Method: SW A Analytical Method: SW A Mercury U mg/l /22/ :57 T VOLATILES Analysis Desc: 8260B Analysis, Water Preparation Method: SW B Analytical Method: SW B 1,1,1-Trichloroethane 0.44 U ug/l /24/ :39 T 1,1,2,2-Tetrachloroethane 0.20 U ug/l /24/ :39 T 1,1,2-Trichloroethane 0.46 U ug/l /24/ :39 T 1,1-Dichloroethane 0.86 U ug/l /24/ :39 T 1,1-Dichloroethylene 0.70 U ug/l /24/ :39 T 1,2-Dichlorobenzene 0.63 U ug/l /24/ :39 T 1,2-Dichloroethane 0.60 U ug/l /24/ :39 T 1,2-Dichloropropane 0.76 U ug/l /24/ :39 T 1,3-Dichlorobenzene 0.43 U ug/l /24/ :39 T 1,4-Dichlorobenzene 0.97 U ug/l /24/ :39 T 2-Chloroethyl Vinyl Ether 0.58 U ug/l /24/ :39 T Benzene 0.20 U ug/l /24/ :39 T Bromodichloromethane 0.60 U ug/l /24/ :39 T Bromoform 0.88 U ug/l /24/ :39 T Bromomethane 0.97 U ug/l /24/ :39 T Carbon Tetrachloride 0.60 U ug/l /24/ :39 T Chlorobenzene 0.56 U ug/l /24/ :39 T Chloroethane 0.38 U ug/l /24/ :39 T Chloroform 0.31 U ug/l /24/ :39 T Chloromethane 0.53 U ug/l /24/ :39 T Report ID: Page 9 of 33 without the written consent of.
33 ANALYTICAL RESULTS Lab ID: T Date Received: 05/21/18 15:16 Matrix: Water Sample ID: OBDF MW-08 Date Collected: 05/21/18 09:36 Sample Description: Parameters s Qual Units Location: DF Adjusted PQL Adjusted MDL Analyzed Dibromochloromethane 0.40 U ug/l /24/ :39 T Dichlorodifluoromethane 0.36 U ug/l /24/ :39 T Ethylbenzene 0.26 U ug/l /24/ :39 T Methyl tert-butyl Ether (MTBE) 0.41 U ug/l /24/ :39 T Methylene Chloride 1.0 U ug/l /24/ :39 T Tetrachloroethylene (PCE) 0.60 U ug/l /24/ :39 T Toluene 0.45 U ug/l /24/ :39 T Trichloroethene 0.60 U ug/l /24/ :39 T Trichlorofluoromethane 0.84 U ug/l /24/ :39 T Vinyl Chloride 0.20 U ug/l /24/ :39 T Xylene (Total) 0.56 U ug/l /24/ :39 T cis-1,2-dichloroethylene 0.51 U ug/l /24/ :39 T cis-1,3-dichloropropene 0.20 U ug/l /24/ :39 T trans-1,2-dichloroethylene 0.50 U ug/l /24/ :39 T trans-1,3-dichloropropylene 0.20 U ug/l /24/ :39 T 1,2-Dichloroethane-d4 (S) 104 % /24/ :39 Toluene-d8 (S) 103 % /24/ :39 Bromofluorobenzene (S) 103 % /24/ :39 WET CHEMISTRY Analysis Desc: IC,E300.0,Water Analytical Method: EPA Chloride 18 mg/l /25/ :10 T Sulfate 84 mg/l /25/ :10 T Analysis Desc: Ammonia,E350.1,Water Analytical Method: EPA Ammonia (N) U mg/l /25/ :36 T Analysis Desc: Alkalinity,SM2320B,Water Analytical Method: SM 2320B Alkalinity, Total 5.0 U mg/l /22/ :56 T Analysis Desc: Tot Dissolved Solids,SM2540C Analytical Method: SM 2540 C Total Dissolved Solids 300 mg/l /22/ :39 T Analysis Desc: Nitrate,Nitrite SM4500NO3F,Water Analytical Method: SM 4500NO3-F Nitrate 15 mg/l /22/ :58 T Lab Report ID: Page 10 of 33 without the written consent of.
34 ANALYTICAL RESULTS Lab ID: T Date Received: 05/21/18 15:16 Matrix: Water Sample ID: OBDF Dup-01 Date Collected: 05/21/18 00:01 Sample Description: Location: Parameters s Qual Units DF Adjusted PQL Adjusted MDL Analyzed Lab METALS Analysis Desc: SW B Analysis,Water Preparation Method: SW A Analytical Method: SW Aluminum 1300 ug/l /22/ :17 T Arsenic 1.6 U ug/l /22/ :17 T Cadmium 0.32 I ug/l /22/ :17 T Chromium 3.1 ug/l /22/ :17 T Iron 48 I ug/l /22/ :17 T Lead 3.2 U ug/l /22/ :17 T Sodium 6.0 mg/l /22/ :17 T Analysis Desc: SW A Analysis,Water Preparation Method: SW A Analytical Method: SW A Mercury U mg/l /22/ :00 T VOLATILES Analysis Desc: 8260B Analysis, Water Preparation Method: SW B Analytical Method: SW B 1,1,1-Trichloroethane 0.44 U ug/l /22/ :06 T 1,1,2,2-Tetrachloroethane 0.20 U ug/l /22/ :06 T 1,1,2-Trichloroethane 0.46 U ug/l /22/ :06 T 1,1-Dichloroethane 0.86 U ug/l /22/ :06 T 1,1-Dichloroethylene 0.70 U ug/l /22/ :06 T 1,2-Dichlorobenzene 0.63 U ug/l /22/ :06 T 1,2-Dichloroethane 0.60 U ug/l /22/ :06 T 1,2-Dichloropropane 0.76 U ug/l /22/ :06 T 1,3-Dichlorobenzene 0.43 U ug/l /22/ :06 T 1,4-Dichlorobenzene 0.97 U ug/l /22/ :06 T 2-Chloroethyl Vinyl Ether 0.58 U ug/l /22/ :06 T Benzene 0.20 U ug/l /22/ :06 T Bromodichloromethane 0.60 U ug/l /22/ :06 T Bromoform 0.88 U ug/l /22/ :06 T Bromomethane 0.97 U ug/l /22/ :06 T Carbon Tetrachloride 0.60 U ug/l /22/ :06 T Chlorobenzene 0.56 U ug/l /22/ :06 T Chloroethane 0.38 U ug/l /22/ :06 T Chloroform 0.31 U ug/l /22/ :06 T Chloromethane 0.53 U ug/l /22/ :06 T Report ID: Page 11 of 33 without the written consent of.
35 ANALYTICAL RESULTS Lab ID: T Date Received: 05/21/18 15:16 Matrix: Water Sample ID: OBDF Dup-01 Date Collected: 05/21/18 00:01 Sample Description: Parameters s Qual Units Location: DF Adjusted PQL Adjusted MDL Analyzed Dibromochloromethane 0.40 U ug/l /22/ :06 T Dichlorodifluoromethane 0.36 U ug/l /22/ :06 T Ethylbenzene 0.26 U ug/l /22/ :06 T Methyl tert-butyl Ether (MTBE) 0.41 U ug/l /22/ :06 T Methylene Chloride 1.0 U ug/l /22/ :06 T Tetrachloroethylene (PCE) 0.60 U ug/l /22/ :06 T Toluene 0.45 U ug/l /22/ :06 T Trichloroethene 0.60 U ug/l /22/ :06 T Trichlorofluoromethane 0.84 U ug/l /22/ :06 T Vinyl Chloride 0.20 U ug/l /22/ :06 T Xylene (Total) 0.56 U ug/l /22/ :06 T cis-1,2-dichloroethylene 0.51 U ug/l /22/ :06 T cis-1,3-dichloropropene 0.20 U ug/l /22/ :06 T trans-1,2-dichloroethylene 0.50 U ug/l /22/ :06 T trans-1,3-dichloropropylene 0.20 U ug/l /22/ :06 T 1,2-Dichloroethane-d4 (S) 94 % /22/ :06 Toluene-d8 (S) 98 % /22/ :06 Bromofluorobenzene (S) 98 % /22/ :06 WET CHEMISTRY Analysis Desc: IC,E300.0,Water Analytical Method: EPA Chloride 19 mg/l /25/ :26 T Sulfate 83 mg/l /25/ :26 T Analysis Desc: Ammonia,E350.1,Water Analytical Method: EPA Ammonia (N) U mg/l /25/ :36 T Analysis Desc: Alkalinity,SM2320B,Water Analytical Method: SM 2320B Alkalinity, Total 5.0 U mg/l /22/ :59 T Analysis Desc: Tot Dissolved Solids,SM2540C Analytical Method: SM 2540 C Total Dissolved Solids 300 mg/l /22/ :39 T Analysis Desc: Nitrate,Nitrite SM4500NO3F,Water Analytical Method: SM 4500NO3-F Nitrate 16 mg/l /22/ :57 T Lab Report ID: Page 12 of 33 without the written consent of.
36 ANALYTICAL RESULTS QUALIFIERS PARAMETER QUALIFIERS U I J4 The compound was analyzed for but not detected. The reported value is between the laboratory method detection limit and the laboratory practical quantitation limit. Estimated LAB QUALIFIERS T DOH Certification #E84589(AEL-T)(FL NELAC Certification) Report ID: Page 13 of 33 without the written consent of.
37 QUALITY CONTROL DATA QC Batch: WCAt/3751 Analysis Method: SM 2540 C QC Batch Method: SM 2540 C Prepared: Associated Lab Samples: T , T , T , T , T METHOD BLANK: Blank Parameter Units WET CHEMISTRY Total Dissolved Solids mg/l 10 Reporting Limit Qualifiers 10 U LABORATORY CONTROL SAMPLE: Spike Parameter Units Conc. LCS LCS Limits Qualifiers WET CHEMISTRY Total Dissolved Solids mg/l SAMPLE DUPLICATE: Original: T Original DUP Parameter Units RPD Max RPD Qualifiers WET CHEMISTRY Total Dissolved Solids mg/l QC Batch: QC Batch Method: Associated Lab Samples: METHOD BLANK: DGMt/1744 SW A Analysis Method: SW Prepared: 05/22/ :00 T , T , T , T , T Blank Parameter Units METALS Aluminum ug/l 25 Arsenic ug/l 1.6 Cadmium ug/l 0.24 Chromium ug/l 2.0 Iron ug/l 21 Sodium mg/l 0.17 Lead ug/l 3.2 Reporting Limit Qualifiers 25 U 1.6 U 0.24 U 2.0 U 21 U 0.17 U 3.2 U Report ID: Page 14 of 33 without the written consent of.
38 QUALITY CONTROL DATA LABORATORY CONTROL SAMPLE: Spike Parameter Units Conc. LCS LCS Limits Qualifiers METALS Aluminum ug/l Arsenic ug/l Cadmium ug/l Chromium ug/l Iron ug/l Sodium mg/l Lead ug/l MATRIX SPIKE & MATRIX SPIKE DUPLICATE: Original: T Original Spike Parameter Units Conc. MS MSD MS MSD Max Limit RPD RPD Qualifiers METALS Aluminum ug/l Arsenic ug/l Cadmium ug/l Chromium ug/l Iron ug/l Sodium mg/l Lead ug/l QC Batch: QC Batch Method: WCAt/3770 SM 4500NO3-F Analysis Method: Prepared: Associated Lab Samples: T , T , T , T SM 4500NO3-F METHOD BLANK: Blank Parameter Units WET CHEMISTRY Nitrate mg/l 0.18 Reporting Limit Qualifiers 0.18 U Report ID: Page 15 of 33 without the written consent of.
39 QUALITY CONTROL DATA LABORATORY CONTROL SAMPLE: Spike Parameter Units Conc. LCS LCS Limits Qualifiers WET CHEMISTRY Nitrate mg/l MATRIX SPIKE & MATRIX SPIKE DUPLICATE: Original: T Original Spike Parameter Units Conc. MS MSD MS MSD Max Limit RPD RPD Qualifiers WET CHEMISTRY Nitrate mg/l QC Batch: QC Batch Method: Associated Lab Samples: METHOD BLANK: WCAt/3771 SM 4500NO3-F T Blank Parameter Units WET CHEMISTRY Nitrate mg/l 0.18 Analysis Method: Prepared: Reporting Limit Qualifiers 0.18 U SM 4500NO3-F LABORATORY CONTROL SAMPLE: Spike Parameter Units Conc. LCS LCS Limits Qualifiers WET CHEMISTRY Nitrate mg/l MATRIX SPIKE & MATRIX SPIKE DUPLICATE: Original: T Original Spike Parameter Units Conc. MS MSD MS MSD Max Limit RPD RPD Qualifiers WET CHEMISTRY Nitrate mg/l Report ID: Page 16 of 33 without the written consent of.
40 QUALITY CONTROL DATA QC Batch: DGMt/1748 Analysis Method: SW A QC Batch Method: SW A Prepared: 05/22/ :00 Associated Lab Samples: T , T , T , T , T METHOD BLANK: Blank Parameter Units METALS Mercury mg/l Reporting Limit Qualifiers U LABORATORY CONTROL SAMPLE: Spike Parameter Units Conc. LCS LCS Limits Qualifiers METALS Mercury mg/l MATRIX SPIKE & MATRIX SPIKE DUPLICATE: Original: T Original Spike Parameter Units Conc. MS MSD MS MSD Max Limit RPD RPD Qualifiers METALS Mercury mg/l 6e QC Batch: WCAt/3782 Analysis Method: SM 2320B QC Batch Method: SM 2320B Prepared: Associated Lab Samples: T , T , T , T , T METHOD BLANK: Blank Parameter Units WET CHEMISTRY Alkalinity, Total mg/l 5.0 Reporting Limit Qualifiers 5.0 U Report ID: Page 17 of 33 without the written consent of.
41 QUALITY CONTROL DATA METHOD BLANK: Blank Parameter Units WET CHEMISTRY Alkalinity, Total mg/l 5.0 Reporting Limit Qualifiers 5.0 U LABORATORY CONTROL SAMPLE: Spike Parameter Units Conc. LCS LCS Limits Qualifiers WET CHEMISTRY Alkalinity, Total mg/l SAMPLE DUPLICATE: Original: T Original DUP Parameter Units RPD Max RPD Qualifiers WET CHEMISTRY Alkalinity, Total mg/l SAMPLE DUPLICATE: Original: T Original DUP Parameter Units RPD Max RPD Qualifiers WET CHEMISTRY Alkalinity, Total mg/l QC Batch: QC Batch Method: Associated Lab Samples: MSVt/1888 METHOD BLANK: SW B T Analysis Method: SW B Prepared: 05/22/ :00 Blank Parameter Units VOLATILES Dichlorodifluoromethane ug/l 0.36 Chloromethane ug/l 0.53 Vinyl Chloride ug/l 0.20 Bromomethane ug/l 0.97 Chloroethane ug/l 0.38 Trichlorofluoromethane ug/l 0.84 Reporting Limit Qualifiers 0.36 U 0.53 U 0.20 U 0.97 U 0.38 U 0.84 U Report ID: Page 18 of 33 without the written consent of.
42 QUALITY CONTROL DATA METHOD BLANK: Blank Parameter Units Reporting Limit Qualifiers 1,1-Dichloroethylene ug/l U Methylene Chloride ug/l U trans-1,2-dichloroethylene ug/l U Methyl tert-butyl Ether ug/l U (MTBE) 1,1-Dichloroethane ug/l U cis-1,2-dichloroethylene ug/l U Chloroform ug/l U 1,2-Dichloroethane ug/l U 1,1,1-Trichloroethane ug/l U Carbon Tetrachloride ug/l U Benzene ug/l U 1,2-Dichloropropane ug/l U Trichloroethene ug/l U Bromodichloromethane ug/l U 2-Chloroethyl Vinyl Ether ug/l U cis-1,3-dichloropropene ug/l U trans-1,3-dichloropropylene ug/l U 1,1,2-Trichloroethane ug/l U Toluene ug/l U Dibromochloromethane ug/l U Tetrachloroethylene (PCE) ug/l U Chlorobenzene ug/l U Ethylbenzene ug/l U Bromoform ug/l U 1,1,2,2-Tetrachloroethane ug/l U 1,3-Dichlorobenzene ug/l U 1,4-Dichlorobenzene ug/l U 1,2-Dichlorobenzene ug/l U Xylene (Total) ug/l U 1,2-Dichloroethane-d4 (S) % Toluene-d8 (S) % Bromofluorobenzene (S) % LABORATORY CONTROL SAMPLE: Spike Parameter Units Conc. LCS LCS Limits Qualifiers VOLATILES Dichlorodifluoromethane ug/l Chloromethane ug/l Vinyl Chloride ug/l Report ID: Page 19 of 33 without the written consent of.
43 QUALITY CONTROL DATA LABORATORY CONTROL SAMPLE: Spike Parameter Units Conc. LCS LCS Limits Qualifiers Bromomethane ug/l Chloroethane ug/l Trichlorofluoromethane ug/l ,1-Dichloroethylene ug/l Methylene Chloride ug/l trans-1,2-dichloroethylene ug/l Methyl tert-butyl Ether ug/l (MTBE) 1,1-Dichloroethane ug/l cis-1,2-dichloroethylene ug/l Chloroform ug/l ,2-Dichloroethane ug/l ,1,1-Trichloroethane ug/l Carbon Tetrachloride ug/l Benzene ug/l ,2-Dichloropropane ug/l Trichloroethene ug/l Bromodichloromethane ug/l Chloroethyl Vinyl Ether ug/l cis-1,3-dichloropropene ug/l trans-1,3-dichloropropylene ug/l ,1,2-Trichloroethane ug/l Toluene ug/l Dibromochloromethane ug/l Tetrachloroethylene (PCE) ug/l Chlorobenzene ug/l Ethylbenzene ug/l Bromoform ug/l ,1,2,2-Tetrachloroethane ug/l ,3-Dichlorobenzene ug/l ,4-Dichlorobenzene ug/l ,2-Dichlorobenzene ug/l Xylene (Total) ug/l ,2-Dichloroethane-d4 (S) % Toluene-d8 (S) % Bromofluorobenzene (S) % Report ID: Page 20 of 33 without the written consent of.