Shawn Herring Civil Applications ProSoft, Inc
|
|
|
- Bertram Golden
- 5 years ago
- Views:
Transcription
1 SSA for Highway Design Using Autodesk Storm and Sanitary Analysis for Simple or Complex Roads Shawn Herring Civil Applications ProSoft, Inc


2 Win a Civil 3D Book!!! A Practical Guide to AutoCAD Civil 3D 2012 Donated by Cadapult Software Solutions Civil 3D and AutoCAD Map 3D books


3 About ME! 8 years in Civil Engineering Community Drafter/Designer CADD Manger Project Manager Civil Engineer 2 Years with Autodesk Reseller Teach and Support Civil 3D, Map 3D, SSA and AutoCAD, Civil 3D Certified Professional Since 2007 Speak at numerous User Groups across the country Multiple Social Media Sites First live AU Presentation!!!
 I have heard of SSA, but have never seen it We")
4 About YOU! I have never heard of Autodesk Storm and Sanitary Analysis (SSA) I have heard of SSA, but have never seen it We have SSA, but do not use it We use Other Stuff only I or a coworker could give this session (Don t be humble)
5 Class Agenda In this class, you will learn how to utilize your AutoCAD Civil 3D corridor design model and surface to quickly break out your catchment areas and prepare for export to Autodesk Storm and Sanitary Analysis (SSA). We will show you how to use the SSA package to run a storm analysis on the network. Finally, we will cover round tripping the network back into Civil 3D to update networks and profiles. Capabilities of Autodesk Storm and Sanitary Analysis GIS Integration Working within AutoCAD Civil 3D Open Civil 3D Review Model Create Catchment Areas Preparation Tasks Stage Storage Analysis Export to SSA Open SSA Begin our Setup Bypass Links and Inspection Run Analysis Profiles and Output Reports Round Tripping
6 The Capabilities of Autodesk Storm and Sanitary Analysis Autodesk Storm and Sanitary Analysis 2012 Extension is a comprehensive hydrology and hydraulic analysis application for planning and designing urban drainage systems, highway drainage systems, storm sewers, and sanitary sewers. Major technical capabilities and functionalities include: Bidirectional exchange of data with AutoCAD Map 3D 2012 and AutoCAD Civil 3D 2012 software Widely accepted hydrology analysis methods, including NRCS (SCS) TR-20/TR-55, Rational Method, Modified Rational, HEC-1, EPA SWMM, UK Modified Rational (Wallingford Procedure), and more Hydraulic analysis of pipes, open channels, streams, bridges, culverts, roadway inlet catch basins, and more Advanced hydrodynamic routing that can handle backwater, surcharging, flow splits, and more Support of networks of unlimited size Compare pre- and post-development conditions Analysis and design of detention and retention ponds Analysis of stormwater best management practices (BMPs) Water quality modeling Sophisticated graphical output providing detailed plan view plots, profile plots, and time series plots Customizable reports and templates for agency regulatory review Geographic information system (GIS) interoperability
 Stormwater sewer networks and interconnected detention ponds Subdivision")
7 The Capabilities of Autodesk Storm and Sanitary Analysis Autodesk Storm and Sanitary Analysis can simultaneously model complex hydrology, hydraulics, and water quality. This software can be used for designing and analyzing: Highway drainage systems (including curb and gutter stormwater inlets) Stormwater sewer networks and interconnected detention ponds Subdivision drainage systems Design and sizing of detention ponds and outlet structures Bridges and culverts, including roadway overtopping Water quality studies
8 The Capabilities of Autodesk Storm and Sanitary Analysis Highway Drainage Design Autodesk Storm and Sanitary Analysis helps simplify your highway drainage design work. The software can simulate dual drainage systems (stormwater sewer network and city streets as dual conveyance pathways) and inlet capacity. It can more quickly determine the amount of stormwater flow that is intercepted by the stormwater network inlets and the amount of stormwater flow that bypasses and is then routed further downstream to other inlets. Highway drainage capabilities include: Select from standard curb openings, grated inlets, slotted inlets, median ditch inlets, and combination inlets Account for on-sag and on-grade conditions Look up standard curb openings and grated inlets from major foundry manufacturers and agencies Use industry-standard FHWA (Federal Highway Administration) HEC-22 computations Compute gutter spread, depth of flow, inlet efficiency, inlet spacing, velocity of flow for gutter and pavement sections The hydraulics of storm drain inlets is computed based on the procedures and equations defined in the FHWA Hydraulic Engineering Circular No. 22 (HEC-22), Urban Drainage Design Manual, Third Edition, The capacity of storm drain inlets on roadway sag is computed by both the weir and orifice equations (FHWA Report, Hydraulic Characteristics of Slotted Drain Inlets, 1980). Flow into the storm drain inlet initially operates as a weir having a crest length equal to the length of drain perimeter that the flow crosses. The storm drain inlet operates under weir conditions to a depth of about 4 inches (100 mm) and then begins to switch to orifice flow.

9 The Capabilities of Autodesk Storm and Sanitary Analysis The following matrix correlates typical project types with available hydrology methods.
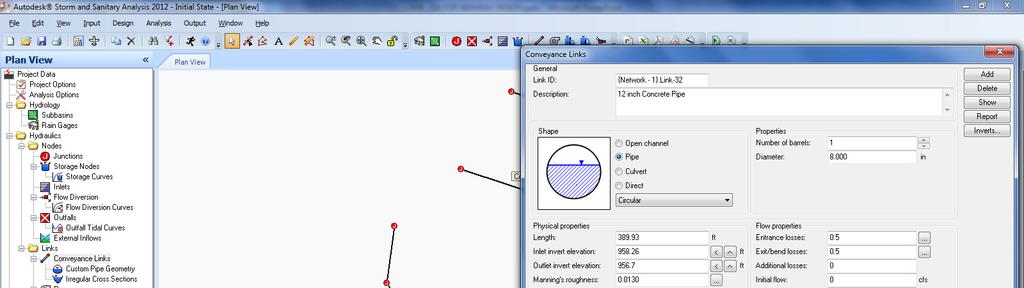
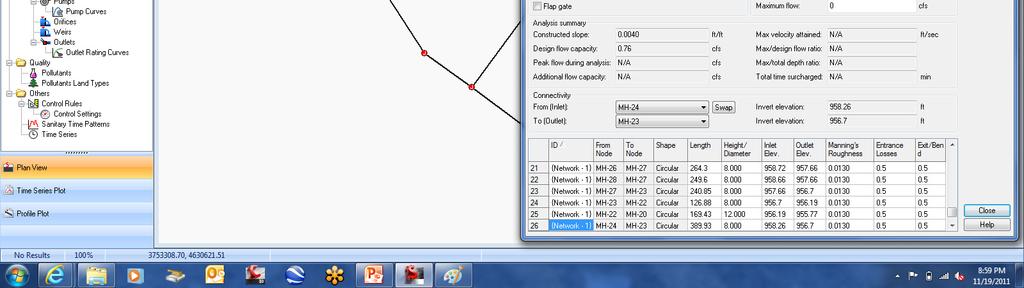
10 The Capabilities of Autodesk Storm and Sanitary Analysis Model Development Simulation models can be more quickly developed using a variety of different sources. Network components can be directly imported from CAD and GIS. The network model can be interactively created using a mouse by pointing and clicking. Graphical symbols are used to represent network elements, such as manholes, pipes, pumps, weirs, ditches, channels, catch basin inlets, and detention ponds. The software enables you, at any time, to interactively add, insert, delete, or move any network element, automatically updating the model. For example, selecting and moving a manhole automatically moves all connected pipes, ditches, channels, and pumps. Pipes can be curvilinear and lengths can be automatically computed. Scanned aerial orthophoto TIFF images and maps, as well as GIS and CAD files of streets, parcels, and buildings can be imported and displayed as background images. This enables you to more quickly digitize a network model, confirm the network layout, or enhance the output modeling results. Moreover, you can point to or click any greaphical symbol from the plan view to quickly determine the defined input data and output modeling results.
 Carter Eagleson FAA Harris County, TX Kirpich Papadakis-Kazan (Maricopa and Pima Counties, AZ)")
11 The Capabilities of Autodesk Storm and Sanitary Analysis Time of Concentration The software includes the following time of concentration methods: SCS TR-55 Kinematic Wave (EPA SWMM only) Carter Eagleson FAA Harris County, TX Kirpich Papadakis-Kazan (Maricopa and Pima Counties, AZ) User-defined

12 The Capabilities of Autodesk Storm and Sanitary Analysis Rainfall Designer Autodesk Storm and Sanitary Analysis includes a Rainfall Designer which, after you select any location within the U.S., will provide the design rainfall for the specified storm frequency. Alternatively, a user-defined rainfall can be specified. Then the appropriate storm distribution can be selected and the design storm is created. Multiple design storms can be created and analyzed. Site-specific storm distribution database with over 3,500 up-to-date rainfall recording stations across the United States Automatically determines design rainfall (based on study location) for 1, 2, 5, 10, 25, 50, and 100 year return frequencies Define any storm duration, multiple storm events Numerous storm distributions, including SCS, Huff, Eastern Washington, Florida, Chicago Storm, Hurricane Hazel, and user-defined
13 The Capabilities of Autodesk Storm and Sanitary Analysis Analysis Output Autodesk Storm and Sanitary Analysis software s graphical capabilities can provide detailed plan view plots, profile plots, and time series plots. On the plan view, the software provides automatic color-coding of links and nodes based on any input or output property, allowing the network to be color-coded based on pipe sizes, pipe slope, flow rates, velocities, capacity, water quality concentrations, or any other attribute. Directional flow arrows can be plotted on top of pipes to show the flow direction for any time step. Furthermore, pipes can be plotted with variable width and nodes with variable radius, so you can more quickly identify those areas of the network experiencing the most surcharge, flooding, pollutant concentration, and so on. The software will automatically generate graphical animations for plan view plots and profile plots to show output result values that change with respect to time. These animations can be recorded as AVI or WMV movie files that can be viewed independent of the software. Multiple time-series plots can be generated for various network elements, such as pipe flow, velocity, junction water surface elevation, pollutant concentration, or any other analysis output attribute. In addition, you can display and compare multiple result files simultaneously, enabling direct comparison between different simulation models. Custom Reports Comprehensive input data and output analysis reports can be generated using the built-in report generator. The software allows full customization of input and output reporting. This gives you greater flexibility and functionality in developing specialized user-defined reports. These reports can be fully customized to help meet any combination of modeling criteria.

14 GIS Integration GIS Support Autodesk Storm and Sanitary Analysis can share spatial data and visual representation of the stormwater and wastewater sewer network with most GIS spatial databases, allowing the software to be part of the stormwater and wastewater management and planning system. These capabilities can greatly assist the decision-making processes for network asset inventory, rehabilitation requirements, and financial planning. The software can intelligently import most any GIS database structure, using attribute mapping and geocoding. Also, the analysis solution results can be exported back to the GIS database, so locations of CSO and SSO spills, manhole overflows, pipe surcharging, and floodplain flooding can be more quickly identified.
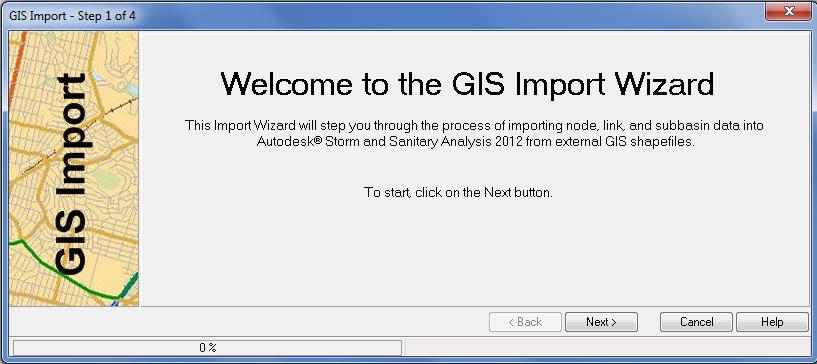
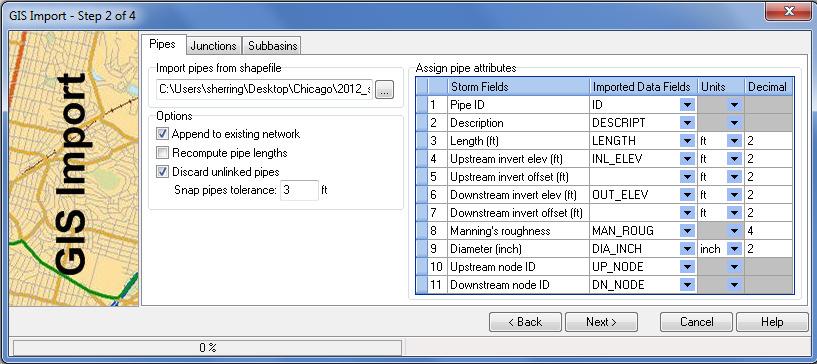
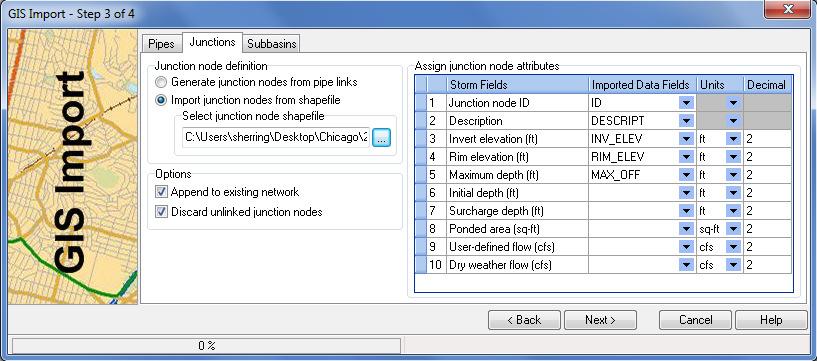
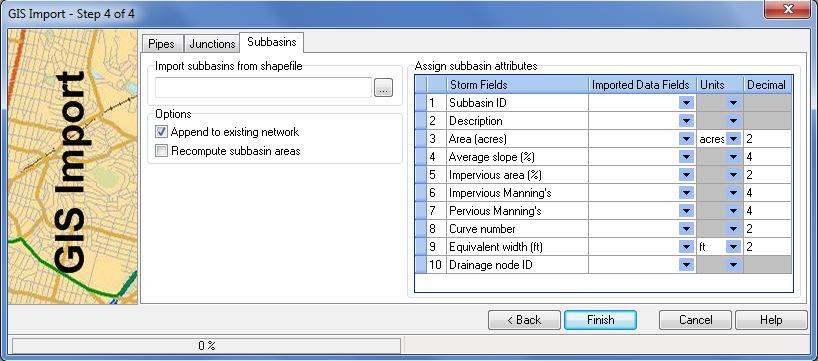

15 GIS Integration
16 GIS Integration

17 Working within AutoCAD Civil 3D Typical Workflow Confirm catchment objects are associated with pipe networks Select pipe network Use Edit in SSA button from Ribbon Automatically opens SSA and imports data, choose new project Review properties and drawing information brought over: DWG file placed in background Conversion of Catchment objects to SSA subbasin elements Pipes become links Structures become junctions Streamlines design tasks Ability to evaluate alternatives earlier in the design process Extends the value of readily available information Extends the AutoCAD Civil 3D model, keeping design and drafting in sync Utilize many data formats Ease of generating deliverables
18 Demonstration and Exercise

![trademarks mentioned in the material] are registered trademarks or trademarks of Autodesk, Inc.](/docs-images/94/119912683/images/19-1.jpg ", and/or its subsidiaries and/or affiliates in the USA and/or other countries.")

19 Q&A Shawn Herring Senior Civil Application Engineer ProSoft, Inc Orem, Utah Autodesk, AutoCAD* [*if/when mentioned in the pertinent material, followed by an alphabetical list of all other trademarks mentioned in the material] are registered trademarks or trademarks of Autodesk, Inc., and/or its subsidiaries and/or affiliates in the USA and/or other countries. All other brand names, product names, or trademarks belong to their respective holders. Autodesk reserves the right to alter product and services offerings, and specifications and pricing at any time without notice, and is not responsible for typographical or graphical errors that may appear in this document., Inc. All rights reserved.