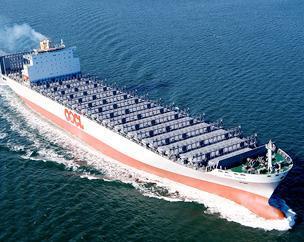
Samsung Heavy Industries. MOJAH 266K LNG Carrier (332m 54m 27m)
|
|
|
- Cathleen Griffith
- 5 years ago
- Views:
Transcription
")
1 Samsung Heavy Industries MOJAH 266K LNG Carrier (332m 54m 27m) Jun 212


2 Contents Company Overview Global Markets Future Strategy Stena Drillmax (219m 42m 19)
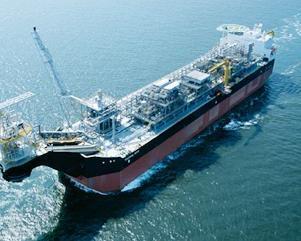
 & LNG FPSO(336m 5m 32m)")
3 Company Overview Business Highlights Order & Backlog Risk Management Financial Results Construction Business LNG Carrier (32m 5m 27m) & LNG FPSO(336m 5m 32m) 3

 Construction 8%")
 (%) 2 15 1 5")


")


4 Business Highlights Revenue of 211 Commercial Vessels 52% Offshore 4% (KRWt) Construction 8% Revenue & OP margin (KRWt) (%) Offshore Ship Backlog as of May 31, 212 EPS and DPS 21~211, K-IFRS Adopted (US$b) (KRW) 5 EPS DPS (KRW) 6 Commercial Vessels 39% Offshore 61% ,178 2,899 2,9 3,848 3, Construction division excluded

 212 New orders Details 9.7 $6.Bil 6.")
 1.4 26 27 28 29 21 211 212.")
 LNG Carriers (14%) Tankers")
 Drillships (29%) Production Facilities (31%)")
5 Order & Backlog New orders Rigs Production LNGC Container Tanker Others(Ferry, WTI) 14.9 (US$b) 212 New orders Details 9.7 $6.Bil 6. Tanker LNG Carriers (3%) (7%) (1 Units) Drillships (45%) May Production Facilities (45%) Order backlog Containerships (16%) LNG Carriers (14%) Tankers (9%) Etc. (1%) Drillships (29%) Production Facilities (31%) (US$b) Order backlog Trend Offshore Commercial Vessels (US$b) 38.3 As of May 31, May
6 Risk Management SHI focuses on minimizing profit volatility Building Event Contract Steel cutting Keel laying Launching Delivery Time Gap (months) Currency Receivables Payables Raw Materials Main Engine Machinery Steel Plate Bulk Parts : Hedging, order : Execution, delivery Foreign currency exposure is fully covered through forward transaction at the stage of shipbuilding contract Main Engine and machinery are ordered within 1~2 months of contract signing No Hedge tools available for Steel plates, SHI put buffer in bidding price to cope with unexpected price hike 6
7 Financial Results Income statement (KRWb) Q 2Q 3Q 4Q Total 1Q Sales 13,95 13,71 3,516 3,162 3,41 3,33 13,391 3,539 Shipbuilding 12,261 12,91 3,234 2,99 3,137 3,39 12,319 3,291 Construction , Operating Profit (Margin) 794 (6.1%) 1,378 (1.5%) 392 (11.1%) 339 (1.7%) 233 (6.8%) 196 (5.9%) 1,16 (8.7%) 337 (9.5%) Pre-tax income 855 1, , Non-OP income 6,222 3, Non-OP expense 6,161 3, Net income
8 Financial Results Balance sheet (KRWb) (A) 212.1Q(B) B-A Total Assets 26,84 2,188 18,44 16,414 15, Cash & equiv. 2,49 1,85 1,226 1,289 1, Account receivable 1,999 3,814 5,444 4,78 3, Advance payments 2,88 2,45 1,663 1,675 1, Hedge related 12,796 6,916 3,37 2,592 2, Inventories Total Liabilities 23,76 17,347 14,343 11,77 1, Advance receipt Debts Hedge related 8, ,518 5,658 2,78 6,817 5,329 2,221 3,578 5,62 1,784 2,452 5,211 1,739 1, Total Equity 2,324 2,841 4,97 4,644 4, Paid in capital 1,154 1,154 1,154 1,154 1,154 - Treasury shares Total Liab. & Eqty 26,84 2,188 18,44 16,414 15,


")


9 Construction Business Business overview Main projects Revenue and profit (KRWb) 1, Revenue Operating Profit 1% Road Apartment 8 8% 6 6% 4 2 4% 2% Incineration plant Office building % Order backlog Civil & Plant 3% Building & Housing 7% Tril KRW Townhouse Hotel Museum As of May 31, 212 9
10 Global Markets Global New Orders Major Market Situation - Commercial Vessels Market - Offshore Market Major products of SHI : Containership, LNG Carrier, Drillship and FPSO (clockwise from upper left) 1
11 Global New Orders Historical Orders by Shiptype and Countries (Mn. GT) 18 LNG Carrier Containership AVG : Tanker Bulker Other AVG : Korea China Japan 1 8 AVG : '99 ' '1 '2 '3 '4 '5 '6 '7 '8 '9 '1 '11 '12.Apr Increase of Sea trade volume together with chinese effect had lead shipbuilding orders for 23~28 After sharp decrease in 29, new orders has been normalized to the level of 23~25 The orders of specialized vessels such as Drillship, LNGC and oversized Containership are increasing 11
 B/A B D I 12 Bulk Carriers 351 56 19 31% W S 8/1/2 8/9/2 9/5/2 1/1/2 1/9/2 54 95 12/5/31 Tankers 249 12 44 18% Source: Clarkson, as of May, 212 (Mn.")
12 Bulk Carriers & Tankers : Overbooked Freight index 11,459 Fleet vs backlog Fleet (A) Old Fleet (2yrs) Backlog (B) (Mn. G/T) B/A B D I 12 Bulk Carriers % W S 8/1/2 8/9/2 9/5/2 1/1/2 1/9/ /5/31 Tankers % Source: Clarkson, as of May, 212 (Mn. G/T) [Bulk Carriers] Backlog Delivery New order 78 '7 '8 '9 '1 '11 '12(E) Order trends and M/S by country 22% 4% 16% Korea Japan 59% China Etc. (Mn. G/T) Backlog Delivery New order [Tankers] 34 '7 '8 '9 '1 '11 '12(E) % 9% 31% 5% Korea China Japan Etc. Source: Clarkson
13 Containerships : Struggling for restricted new orders Fuel & charter cost (HRCI index) 1,6 1,2 8 4 Trade Growth & Fleets (mil.teu) , HRCI Bunker-C Fleet Trade Growth 4 ($/Ton) Source: Clarkson, KMI '7.7 '8.1 '8.7 '9.1 '9.7 '1.1 '1.7 '11.1 '11.7 ' '4 '5 '6 '7 '8 '9 '1 '11 '12(E) (%) 15 Source: Clarkson New Order Trends (, TEU) 3,5 3, 2,5 2, 1,5 1, 5 Idle Fleets (,TEU) (%) '1.1 '1.1 '11.1 '11.4 '11.9 '12.4 (11%) 1,6 1,74 3,24 1,15 TEU Ratio(%) 9 (.5%) Source: Clarkson 1,77 (5.3%) ~8 '6 '7 '8 '9 '1 '11 '12(E) Source: Clarkson, SHI
 (Mil.Ton, 1) 2.3 Bil.Ton (consumption) Trading 878 LNG 268(3%) Source: BP Economical Eco- Friendly LNG Demand & LNGC Fleet Forecast (Mil.")
14 LNG Carriers : Warranted with solid demand Energy Consumption & LNG Trading (MTOE) 12, 1, Coal (29%) 8, Nuclear (5%) 6, Natural Gas (24%) Hydro(7%) 4, Oil (35%) 2, - ' '1 '2 '3 '4 '5 '6 '7 '8 '9 Pipeline 61(7%) (Mil.Ton, 1) 2.3 Bil.Ton (consumption) Trading 878 LNG 268(3%) Source: BP Economical Eco- Friendly LNG Demand & LNGC Fleet Forecast (Mil.ton) (units) LNG Demand LNGC Fleet ' '2 '4 '6 '8 '1 '12F '14F '16F '18F '2F Source: BP, Andy Flower LNGC Global M/S (units) % Delivery 4% Backlog % Korea Japan China Source: SHI, 2~212.May

15 LNG Derivatives : Convergence of Technology & Business LNG Production & Supply Chain 15

![[cover more reserves] Natural gas LNG FPSO Shell LNG FPSO Project Supply Plan Target](/docs-images/94/120042067/images/16-2.jpg "Field Capacity 1 vessels for 15 years (5 Bil $/ vessel) Australian northwest area 3.")
 '13(E) '14(E) '15(E) '16(E) '17(E) '18(E)")
16 LNG FPSO Market New Business Opportunity LNG FPSO Why LNG FPSO? Pre-treatment Liquefaction Traditional onland plant Less Capex [25%] + Mobility [cover more reserves] Natural gas LNG FPSO Shell LNG FPSO Project Supply Plan Target Field Capacity 1 vessels for 15 years (5 Bil $/ vessel) Australian northwest area 3.5 mtpa Capex Forecast for FLNG (US$b) Storage Progress Status 45k cbm 1 st Vessel Contracted 6 3 '1 '11 '12(E) '13(E) '14(E) '15(E) '16(E) '17(E) '18(E) '19(E) '2(E) 16 Source: FlexLNG
 (11~16) (9~11) (7~9) Source: EIA 17 (mil.")
17 Offshore Market Why Deep Water? Supply Increase in Deep Water (mil barrels oil/d) Global Oil Supply 193~23 <Deep Water Supply Ratio> 1 25(E) 2% 8.5% 13% Deep Water Shallow Water Conventional Onshore Oil Sands Global oil price forecast ($/Barrel) (11~16) (9~11) (7~9) Source: EIA 17 (mil. barrels oil/d) 35 shallow water (mil. barrels oil/d) Deep water Shallow water F 22F 225F 23F Global Deep Water Capex (US$b) 16 Source: Energyfiles F 213F 214F 215F Source: Douglas Westwood 211.May


 Deep Water Drillship 25~212.")
 Deep Water Rig orders")

18 Drilling Rig Drillship is main stream Rig Types Order History & M/S by country Shallow Water Jack-ups Jack-ups 2% Semi-sub 31% Drillships 49% 11US$b Orders Drillship Semi Sub Jack-up Semi-submersible Korea Singapore China Others (5%) (3%) (9%) (11%) Deep Water Drillship 25~212.3, Floating rig, value based (source : RS Platou, SHI) Deep Water Rig orders 4 semi-sub 35 drillship '5 '6 '7 '8 '9 '1 '11 '12.May 18


 (14%) (12%) (2%) (28%) 1996~212.")
 Deep Water F.P.")
19 Production Facility Following the Rigs Facility Types Order History & M/S by country Shallow Water Fixed Platform Barge 7% TLP 13% Semi 17% FPSO 64% 154Unit Order Barge Semi TLP FPSO F.P.S.O Korea Singapore China Japan Others (44%) (14%) (12%) (2%) (28%) 1996~212.3, Floating Facilities, number based (Source : IMA, Clarkson) Order forecast for Deep Water Facilities (unit) Deep Water F.P.U 212(F) 213(F) 214(F) 215(F) New Demand Replacement Total Order Forcast(*) Amount(mil $) 8,25 12,1 8,25 11, Source: BP, Energyfiles, *: New Construction 5%, Conversion 5% 19


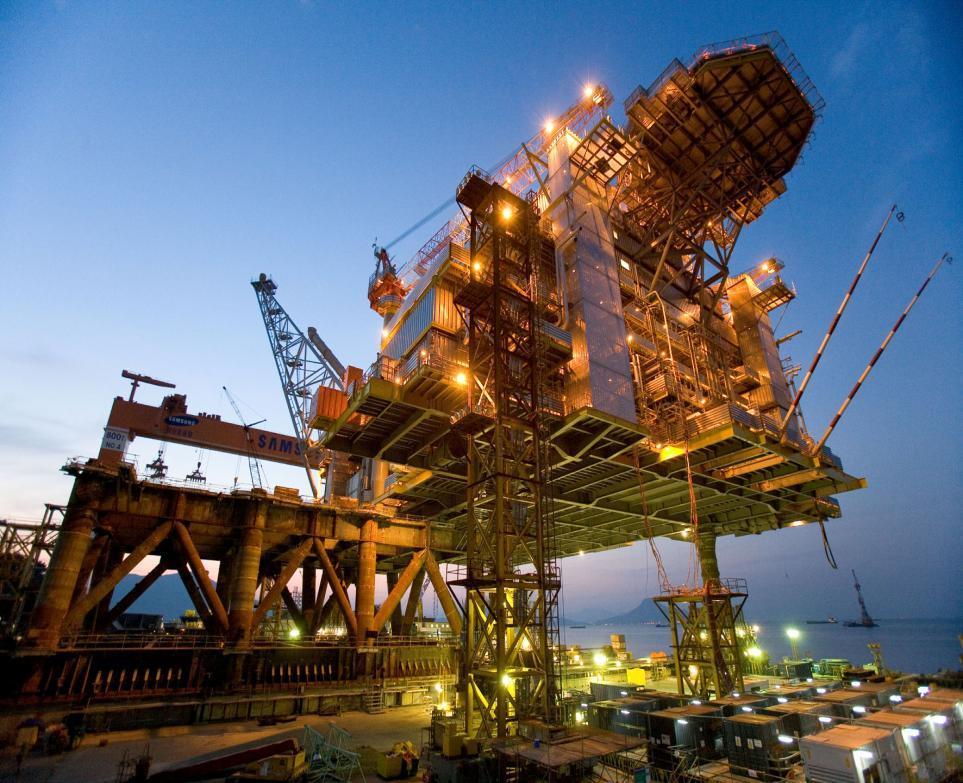
20 Future Strategy Technological Leadership Green Future Vision & Growth Strategies Appendix Sakhalin fixed platform built by SHI 2


21 Technological Leadership Icebreaking Tanker Ice Drillship Ice Container LNG FPSO LNG FSRU CRUISE Growing environmental awareness creating eco-friendly product markets Innovative technology and shrinking oil reserves are triggering new Arctic oil production era Increasing demand for new products provides SHI with new business opportunities 21


22 Green Future Fuel Efficiency matters Paradigm Change Source: Clarksons High Oil Price (Bunker) - 199~2 avg: $9/ton - Current price at 615$ Ship Design & Structure Need for Fuel Saving of ships In Operation In Technology Higher Fuel Efficiency co2 Emission Regulation - Development of Required EEDI - EEOI - GHG Fund, ETS, Carbon Tax Propeller Technology Energy Propeller Saving Technology Device Fuel Efficiency becomes Everything Rudder Bulb Saver Fin 22


23 Vision 22 Reinforcing Shipbuilding & Offshore business and expanding Heavy Electric Machines business to consolidate future growth Vision GLOBAL LEADER of OCEAN & POWER in 22 Objectives Revenue : 36 Bil.USD OP margin : 1% <LNG Fuelled Vessel> Business Stream <LNG FPSO> <Electricity Powered Vessel> <Floaters> <Subsea Plants> <Offshore Wind Power > Stable Growth Growth Engines Seeds for Future 23


 Subsea plants Heavy Electric Machineries")


24 Growth Strategies Shipbuilding Shipbuilding Business High-end & Specialized vessels with Eco-Friendly and innovative technologies Optimized Global Production System Consulting business for operating shipyards Offshore Business Improvement of offshore engineering abilities Diversification related with offshore business (Subsea Etc.) Subsea plants Heavy Electric Machineries Business Business Structure in 22 Motors, Generators and Transformers Etc. Automated Robots for special purposes Offshore Wind-Power business Shipbuilding (36%) Revenue 36 US$b Offshore (4%) Heavy Electric Machineries (24%)


25 Appendix - Shipyard View Floating Dock 4 Floating Dock 3 Floating Dock 2 Floating Dock 5 ShinHanne Factory Dry Dock No.2 Floating Crane 3, ton 3,6 ton 8, ton Floating Dock 1 Offshore Facilities Dry Dock No. 1 Dry Dock No.3 Main Building Site 4.million m2 Quay Wall Length: 7.9Km Berthing Capacity: 24vessels 25 Dock 1 Dock : 283m x 46m 2 Dock : 39m x 65m 3 Dock : 64m x 98m G1 Dock: 27m x 52m G2 Dock: 4m x 55m G3 Dock: 4m x 7m G4 Dock: 42m x 7m G5 Dock: 162m x 15m ( for offshore only)
 - 24, tons in 28-25, tons in 21 Houston - Production facility engineering design Rongcheng (Start: 27) - 56, tons in 28-3, tons in")
26 Appendix Global Networks Global base Shipyard Overseas subsidiary Branch office London Oslo Moscow Houston Houston Athens Dubai Rongcheng Ningbo India Koje Shipyard Tokyo Malaysia Brazil Singapore China block factory Offshore engineering center Ningbo (Start :1997) - 24, tons in 28-25, tons in 21 Houston - Production facility engineering design Rongcheng (Start: 27) - 56, tons in 28-3, tons in 21 India - Production facility basic design Global production and engineering bases enable SHI to meet various needs for customers 26

27 Disclaimer This presentation has been prepared by Samsung Heavy Industries Co., Ltd. and contains forward-looking statements, that are subject to risks, uncertainties, and assumptions. The presentation is solely for your information, subject to change without notice, and makes no representation or warranty, expressed or implied and no reliability should be placed on the accuracy, fairness, or completeness of the information presented herein. The Company, its affiliates or representatives accept no liability for any losses arising from any information contained in the presentation. The contents of this presentation may not be reproduced, redistributed or circulated, directly or indirectly, to any other person or organization, or published, in whole or in part, for any purpose. 27