ENVIRONMENTAL FATE AND TRANSPORT MODELING OF EXPLOSIVES IN THE UNSATURATED ZONE
|
|
|
- Regina Sanders
- 5 years ago
- Views:
Transcription
 National Defense Industrial Association 29 th Environmental and Energy Symposium & Exhibition April 7-10 2003")
1 ENVIRONMENTAL FATE AND TRANSPORT MODELING OF EXPLOSIVES IN THE UNSATURATED ZONE Joseph Robb (AMEC) Jay Clausen (AMEC) Bill Gallagher (MAARNG) National Defense Industrial Association 29 th Environmental and Energy Symposium & Exhibition April Richmond, VA
2 MODEL OBJECTIVES Determine the likelihood that explosives would migrate to the water table Determine the appropriate soil action level for explosives that migrate to the water table.
3
4 SEASONAL SOIL COMPARTMENT MODEL (SESOIL) Precipitation Evapotranspiration One dimensional vertical transport model for unsaturated zone Simulates water movement, sediment transport and pollutant fate and transport Volatilization and Diffusion Downward transport Equilibrium Partitioning Recharge

5 SESOIL MODEL DEVELOPMENT FOR MMR Model divided into 4 layers with 10 sublayers each Meteorological Data from Hatchville, MA Station Site-specific soil properties Chemical constants
6 MODEL CALIBRATION Parameter Acceptable Range Calibrated Value Effective Porosity Disconnectedness Index Intrinsic Permeability Soil Moisture Evapotranspiration Recharge Surface Runoff Variables 0.25 to to E-09 to 1.0E-08 cm 2 Calibration Targets 12.2 to 12.4% 45 to 55 cm/yr 60 to 70 cm/yr 0 cm/yr E-09 cm % 46.5 cm/yr 69.8 cm/yr 0.1 cm/yr
7 SENSITIVITY ANALYSIS EFFECT ON SOIL MOISTURE 14 Soil Moisture (%) Orignial Plus 1% Plus 10% 11 Porosity D.I. Perm. Precip.
8 SENSITIVITY ANALYSIS EFFECT ON RECHARGE Groundwater Recharge (cm/yr) Porosity D.I. Perm. Precip. Orignial Plus 1% Plus 10%
9 SENSITIVITY ANALYSIS EFFECT ON EVAPOTRANSPIRATION Evapotranspiratin (cm/yr) Porosity D.I. Perm. Precip. Orignial Plus 1% Plus 10%

10 USE OF SESOIL TO DERIVE SOIL CLEAN-UP STANDARDS SESOIL developed for EPA in 1981 Used by NJDEP, ORDEQ, HIDOH, MADEP, WIDNR
11 OVERALL APPROACH - RDX Utilize SESOIL and Summers Groundwater Mixing Zone models Perform transport calibration so model predicts average observed mass flux and average observed groundwater concentration Use calibrated model to calculate soil concentration that results in 2 ug/l RDX in groundwater (EPA Lifetime Health Advisory)


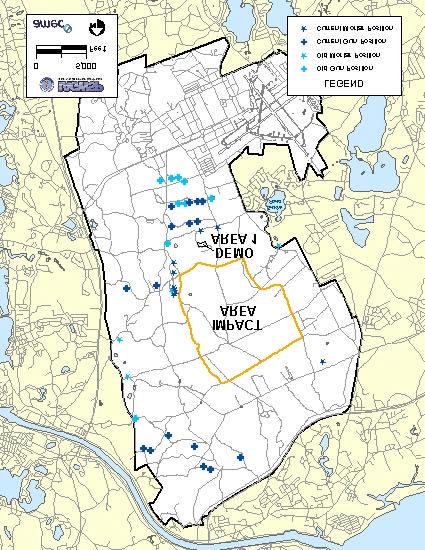
12 DEMOLITION AREA 1
13 MODEL SETUP FOR DEMO 1 Depth of Soil Contamination = 1 ft (0.3 m) Depth to water table = 40 ft (12.2m) Organic carbon = 0.5% (0-12 ft) and 0.01% (12-40 ft) Bulk Density = 1.8 g/ml Time = 100 years
14 MODEL INPUT - CHEMICAL PROPERTIES O 2 N N N NO 2 N NO 2 RDX Solubility (mg/l) Henry s Law Constant (m 3 -atm/mole) Koc (L/kg) E
15 SESOIL + SUMMERS MODEL Q P C P Q P = Flow through vadose zone C P = Soil concentration Vadose Zone Q a = Flow through aquifer C a = Groundwater concentration C GW = [(Q P C P ) + (Q a C a )] (Q a + Q p ) Q a C a Saturated Zone
16 TRANSPORT CALIBRATION Estimate soil concentration (average, area weighted average, geometric mean, median) Vary source size to match observed mass flux ( kg/yr) Vary mixing zone size to match average groundwater concentration (115 ug/l RDX)
17 DEMO 1 RDX IN SOIL Frequency Average (all results) = mg/kg Area weighted avg. = mg/kg Geometric mean = 0.12 mg/kg Median = 0.06 mg/kg More Concentration (mg/kg)
18 TRANSPORT CALIBRATION RESULTS Soil Concentration (mg/kg) Source Size* (cm 2 ) Predicted Mass Flux (kg/yr) Predicted GW Concentration (ug/l) Average x (all results) (220 ft 2 ) Area weighted average x 10 5 (700 ft 2 ) Geometric mean x 10 8 (2.7 acres) Median x (4 acres)
19 PRELIMINARY RDX SOIL CLEANUP STANDARDS Source Size (cm 2 ) 2 x 10 5 (220 ft 2 ) (based on average calibration) 6.5 x 10 5 (700 ft 2 ) (based on area weighted average calibration) Source Concentration (mg/kg) Predicted GW Concentration (ug/l) 2 2

20 COMPARISON OF RESULTS AMEC: 0.4 to 1.2 mg/kg Preliminary value Currently under EPA review AFCEE for CS-19 Site: 5.5 mg/kg INEEL: 0.2 to 2.0 mg/kg (currently under review)
21 SENSITIVITY ANALYSIS High Sensitivity Estimate of initial soil concentration Estimate of average groundwater concentration Moderate Sensitivity Source thickness Mixing zone thickness Mixing zone length Low Sensitivity Number of sublayers per layer Literature Koc vs. Laboratory Measured Kd values
22 POTENTIAL NEXT STEPS Install Lysimeters to measure RDX in vadose zone pore water Refine SESOIL model based on observations THANKS Impact Area Groundwater Study Program US Army Corp of Engineers New England District Air Force Center for Environmental Excellence